Living in Columbus, OH and Hialeah, FL both have their unique advantages and challenges that could sway someone's decision to relocate or visit. This comprehensive comparison covers areas like crime and safety, weather, cost of living, education, work and economy, and more, offering a detailed perspective on what it's like to reside or spend time in these cities.
Distance between
Columbus, OH and
Hialeah, FL : 988.5 miles
Columbus's population is larger by 311%. Its population has grown by 195,058 people (27.4%) since 2000. The population of Hialeah has decreased by 5,929 people (2.6%) during that time.
Columbus, OH has higher crime rates when compared to the national average, but crime rates vary by neighborhood. On the other hand, Hialeah, FL has a lower crime rate than the national average. However, it's important to check specifics depending on your planned area of residence or visit. Both cities are continually improving their safety measures for residents and tourists alike.
City-data.com crime index counts serious crimes and violent crime more heavily. It adjusts for the number of visitors and daily workers commuting into cities. (higher means more crime, U.S. average = 301.1)
City-data.com crime index counts serious crimes and violent crime more heavily. It adjusts for the number of visitors and daily workers commuting into cities. (higher means more crime, U.S. average = 301.1)
Sex Offenders
According to our data, there are 1,576 registered sex offenders living in Columbus and 112 registered sex offenders living in . The ratio of residents to sex offenders in Columbus is 547 to 1; the ratio in Hialeah is 2,142 to 1. The number of registered sex offenders compared to the number of residents is much larger in Columbus than that in Hialeah.
Cost of Living
The cost of living in Columbus, OH, is generally lower than in Hialeah, FL. Particularly, housing tends to be more affordable in Columbus. Groceries, healthcare, and transportation also tend to be cheaper in Columbus than Hialeah.
Income Tax
While Columbus residents face state income taxes, Hialeah residents benefit from living in a state (Florida) with no income tax.
Property Tax
The effective property tax rate in Columbus is a little lower at 1.59% compared to 2.02% in Hialeah. This could be an important consideration for homebuyers.
Sales Tax
Columbus residents pay a 7.5% sales tax while it's higher in Hialeah at 7%. Ohio residents face state income tax rates between 0% and 4.797%, while Florida does not have a state income tax.
Income
Type
Columbus
Hialeah
Estimated median household income
$58,202
$46,674
Estimated per capita income
$32,392
$21,712
Cost of living index (U.S. average is 100)
96.1
107
If you make $50,000 in Columbus, you will have to make $55,671 in Hialeah to maintain the same standard of living.
Geographical Conditions
Columbus boasts rivers, parks, and moderate hills fitting a midwestern landscape, while Hialeah offers tropical beauty with palm trees and proximity to world-renowned beaches.
For education, both cities boast reputed schools and colleges. Columbus, being home to The Ohio State University, has a robust college-town vibe. Hialeah also provides a good education environment, with multiple established universities like the University of Florida nearby.
Columbus has a more diversified economy with sectors such as education, health care, and finance being predominant. In contrast, Hialeah has a large service industry, with trade, transport, and utilities serving as strong sectors.
Biggest Employers
In Columbus, the biggest employers are the Ohio State University, Wexner Medical Center, and Chase Bank. In Hialeah, Palmetto General Hospital, Affiliated Computer Services, and Southeast Frozen Foods Co. are among the biggest employers, emphasizing the city's healthcare and service industry.
There were 913 building permits issued in Columbus in 2012 (246 more than in 2011) compared to 2 building permits issued in Hialeah in 2012 (15 less than in 2011).
In Columbus (Franklin County), 60.8% voted for Democrats and 37.9% for Republicans in 2012 Presidential Election. In Hialeah (Miami-Dade County), 61.8% voted for Democrats and 38.0% for Republicans.
Elections
Type
Democrats
Republicans
Other
Year
Columbus
Hialeah
Columbus
Hialeah
Columbus
Hialeah
2020
64.7%
53.5%
33.4%
46.2%
1.9%
0.3%
2016
59.8%
63.4%
33.9%
33.9%
6.2%
2.7%
2012
60.8%
61.8%
37.9%
38.0%
1.3%
0.3%
2008
59.8%
58.1%
39.0%
41.9%
1.2%
0.0%
2004
54.5%
53.0%
45.2%
46.7%
0.3%
0.3%
2000
48.9%
52.7%
47.9%
46.4%
3.2%
0.9%
1996
48.1%
57.3%
44.5%
37.9%
7.3%
4.8%
Breakdown of population affiliated with a religious congregation
Type
Adherents
Congregations
Religion
Columbus
Hialeah
Columbus
Hialeah
CATHOLIC CHURCH
13.2%
21.8%
5.6%
4.5%
EVANGELICAL LUTHERAN CHURCH IN AMERICA
1.6%
0.2%
3.7%
1.3%
SOUTHERN BAPTIST CONVENTION
1.6%
3.2%
6.8%
21.8%
MUSLIM ESTIMATE
1.3%
0.9%
1.9%
1.0%
VINEYARD USA
1.3%
0.2%
1.2%
0.1%
AMERICAN BAPTIST CHURCHES IN THE USA
1.0%
0.0%
3.3%
0.2%
EPISCOPAL CHURCH
0.4%
0.5%
1.3%
2.1%
SEVENTH DAY ADVENTIST CHURCH
0.4%
1.1%
2.0%
4.3%
Weather
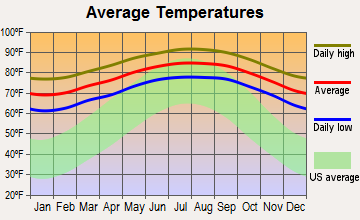
In terms of weather, Hialeah, FL typically has a warm, tropical climate which is pleasant for most of the year but does sit in a hurricane-prone area. Columbus, OH, experiences four distinct seasons, with hot summers and cold winters. So, your preference between a perennially warm climate and experiencing all four seasons would influence your decision.
Weather and climate
Type
Columbus
Hialeah
Temperature - Average
52.8°F
77.9°F
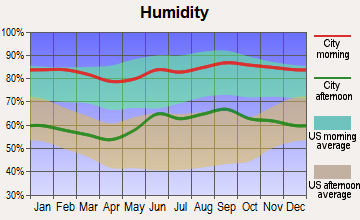
Humidity - Average morning or afternoon humidity
74.8%
77.3%
Humidity - Differences between morning and afternoon humidity
34%
31%
Humidity - Maximum monthly morning or afternoon humidity
86%
86%
Humidity - Minimum monthly morning or afternoon humidity
52%
55%
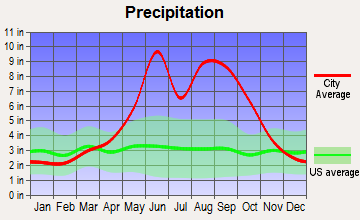
Precipitation - Yearly average
39.3 in
63.5 in
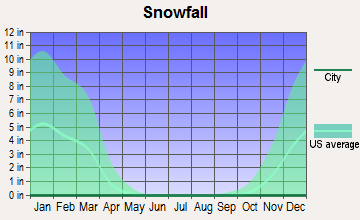
Snowfall - Yearly average
56.6 in
0 in
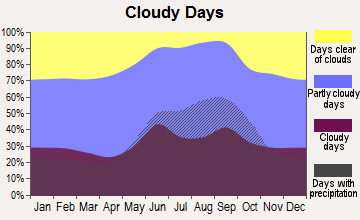
Clouds - Number of days clear of clouds
12%
12.3%
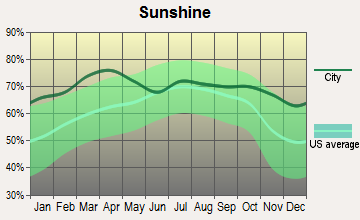
Sunshine amount - Average
49.7%
76.8%
Sunshine amount - Differences during a year
27%
16%
Sunshine amount - Maximum monthly
55%
79%
Sunshine amount - Minimum monthly
28%
63%
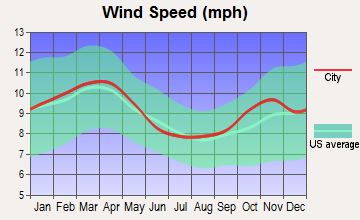
Wind speed - Average
8.2 mph
9.1 mph
Average climate in Columbus, Ohio
Average climate in Hialeah, Florida
Air pollution
Type
AQI
CO
NO2
OZONE
PM10
PM25
SO2
Year
Columbus
Hialeah
Columbus
Hialeah
Columbus
Hialeah
Columbus
Hialeah
Columbus
Hialeah
Columbus
Hialeah
Columbus
Hialeah
2018
69
72
0.11
0.24
10.0
5.4
33.8
27.8
N/A
15.5
6.0
8.1
0.0
0.3
2017
68
80
0.16
0.24
9.6
6.1
28.7
27.4
N/A
N/A
5.5
8.4
0.1
0.3
2016
76
68
0.17
0.25
10.6
5.5
28.5
29.3
N/A
N/A
5.6
7.1
0.1
0.0
2015
74
62
0.16
0.22
11.3
3.4
27.0
26.2
N/A
N/A
6.1
8.2
0.1
0.0
2014
82
71
0.20
0.23
11.0
4.6
28.5
27.7
N/A
N/A
7.4
8.0
0.5
0.0
2013
78
64
N/A
0.18
8.9
3.4
29.6
27.3
N/A
N/A
7.8
7.9
0.6
0.0
2012
87
71
N/A
0.19
N/A
3.4
32.9
28.6
N/A
N/A
8.9
8.7
N/A
0.0
2011
89
72
N/A
0.12
N/A
3.7
28.1
28.3
N/A
N/A
8.9
8.7
N/A
0.0
2010
90
77
N/A
0.33
N/A
5.0
30.5
29.4
N/A
N/A
9.1
9.1
N/A
0.0
2009
61
67
N/A
0.52
N/A
4.2
28.7
28.8
N/A
N/A
N/A
9.1
N/A
0.0
2008
65
95
N/A
0.59
N/A
4.2
31.2
31.0
N/A
18.0
N/A
10.5
1.8
0.0
2007
80
94
N/A
0.65
N/A
5.4
30.8
33.5
N/A
21.9
N/A
10.5
2.8
0.0
2006
75
87
N/A
0.57
N/A
6.4
30.0
34.6
23.7
22.3
N/A
10.2
3.3
0.0
2005
87
75
N/A
0.52
N/A
6.5
29.6
31.8
27.5
18.8
N/A
8.7
4.1
0.0
2004
77
69
N/A
1.03
N/A
6.4
27.8
31.3
24.6
19.5
N/A
8.5
4.4
0.3
2003
91
70
N/A
1.11
N/A
7.2
26.4
29.5
23.9
N/A
N/A
8.4
4.1
0.4
2002
93
75
N/A
0.73
N/A
6.5
31.3
30.2
25.7
N/A
N/A
8.4
4.1
2.1
2001
84
84
N/A
0.74
N/A
6.8
29.2
30.2
25.9
N/A
N/A
9.1
3.5
1.5
2000
57
66
N/A
0.81
N/A
7.3
N/A
31.1
23.5
N/A
N/A
N/A
3.7
1.3
Natural disasters
Type
Columbus
Hialeah
Tornado activity compared to U.S. average
119.1%
66.7%
Earthquake activity compared to U.S. average
96.1%
1.1%
Natural disasters compared to U.S. average
16%
10%
Transportation
Columbus has COTA, an effective public transportation system, and also promotes biking and walking in the downtown and Ohio State University areas. Hialeah is served by the Miami-Dade Transit, providing a network of bus routes, a rail system, and metromover service.
Transport
Type
Columbus
Hialeah
Amtrak stations
1
0
Amtrak stations nearby
1
3
FAA registered aircraft
415
47
FAA registered aircraft manufacturers and dealers
4
2
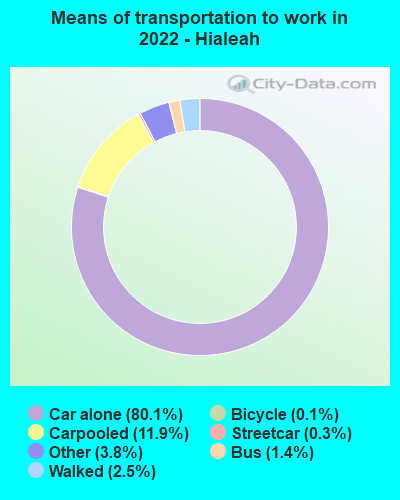
Means of transportation to work
Type
Columbus
Hialeah
Bicycle
0.6%
0.1%
Bus
1.6%
1.5%
Carpooled
7.4%
10.2%
Car alone
86.7%
85%
Railroad
0%
0.1%
Subway
0%
0.2%
Taxicab
0.1%
0%
Walked
2.2%
1.2%
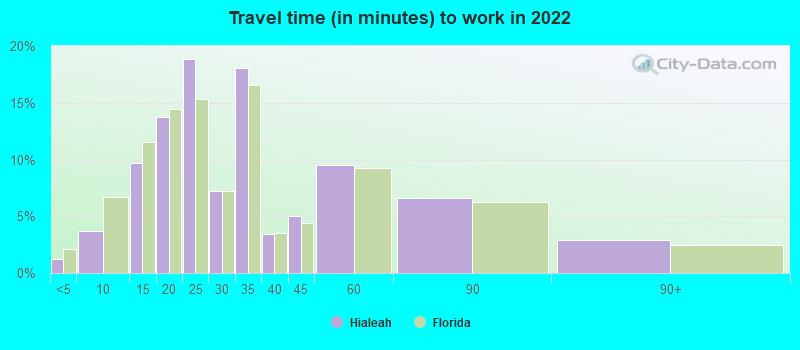
Average travel time to work
Type
Columbus
Hialeah
Average
26.1 min
31.1 min
Other means
21.7 min
27.8 min
Public transportation
35.4 min
47.6 min
Private vehicle occupancy
Type
Columbus
Hialeah
Average
1.1
1.2
Drove alone
90.7%
88.7%
In 2 person carpool
7.3%
7.4%
In 3 person carpool
1.4%
0.6%
In 4 person carpool
0.5%
1.4%
In 5-6 person carpool
0.1%
1.6%
In 7+ person carpool
0.1%
0.2%
How many people usually rode to work in the car, truck or van.
Real Estate
Real estate in Columbus, OH is usually more affordable than in Hialeah, FL, which can make it an attractive option for those looking to relocate. Both cities do offer a range of options from downtown apartments to suburban houses.
Neighborhoods
Both cities offer a mix of neighborhoods catering to different lifestyles. Columbus offers areas such as Victorian Village, known for its historic homes, and German Village, with its charming parks and shops. Hialeah has notable neighborhoods like Palm Springs and Miami Lakes.
Houses and residents
Type
Columbus
Hialeah
Houses
422,120
78,076
Average household size (people)
2.3
3.1
Median year apartment built
1982
1975
Median year house/condo built
1977
1973
Length of stay in the house since moving in
12.6 years
15.4 years
Houses occupied
390,605 (92.5%)
75,692 (96.9%)
Houses occupied by owners
175,427 (44.9%)
35,676 (47.1%)
Houses occupied by renters
215,178 (55.1%)
40,016 (52.9%)
Median rent asked for vacant for-rent units
$1,371
$712.50
Median monthly housing costs
$1,110
$1,239
Median price asked for vacant for-sale houses and condos
$195,022
$578,978
Estimated median house or condo value
$219,200
$324,000
Median numbers of rooms
5
4.4
Median number of rooms in apartments
4.2
3.9
Median number of rooms in houses and condos
6.3
5.2
Median house price - detached houses
$233,452
$353,442
Median house price - in 2-unit structures
$121,729
$207,624
Median house price - in 3-to-4-unit structures
$215,337
$218,498
Median house price - in 5 or more unit structures
$240,711
$239,263
Median house price - mobile homes
$121,578
$433,672
Median house price - Townhouses or other attached units
$218,726
$285,621
Median house price - All housing units
$229,736
$317,773
Median house age
42
46
Renting percentage
53%
49.4%
Housing density (houses/condos per square mile)
2,007.5
4,057.7
House value disparities
30.2%
24.8%
Household income disparities
42.4%
45.8%
Median household income for houses/condes with a mortgage
$89,058
$64,386
Median household income for apartments without a mortgage
$59,295
$44,969
Housing units without a mortgage
4,290 (3.3%)
436 (2.3%)
Housing units with both a second mortgage and home equity loan
10,651 (8.2%)
756 (4%)
Housing units with a mortgage
125,487 (96.7%)
18,412 (97.7%)
Housing units with a home equity loan
775 (0.6%)
53 (0.3%)
Housing units with a second mortgage
13,558 (10.4%)
850 (4.5%)
House/condo owner moved in on average (years ago)
10
15
House/condo renter moved in on average (years ago)
1
3
Housing units lacking complete kitchen facilities
1.6%
2.1%
Housing units lacking complete plumbing facilities
1.3%
1.1%
Housing units in structures
Housing units in structures
Columbus
Hialeah
One, detached
45.8%
39.3%
One, attached
9.1%
9.0%
Two
4.0%
1.3%
3 or 4
8.6%
6.5%
5 to 9
11.8%
8.2%
10 to 19
8.6%
5.7%
20 to 49
4.5%
14.4%
50 or more
6.8%
15.1%
Mobile homes
0.8%
0.5%
Boats, RVs, vans, etc.
0.1%
0.1%
Median real estate property taxes paid for housing units
Self-employed workers in own not incorporated business
20,915
14,316
State government workers
31,881
1,118
Unpaid family workers
724
379
Industries and Occupations
Columbus is known for its diverse selection of industries including finance, education, healthcare, retail, and logistics. Hialeah is primarily service industry-based, with trade and transport being major focuses.
Both cities have excellent healthcare options. Columbus is home to the Wexner Medical Center and Nationwide Children's Hospital. Hialeah has Palmetto General Hospital and is close to Miami's top medical centers.
Health (county statistics)
Type
Columbus
Hialeah
General health status score of residents in this county from 1 (poor) to 5 (excellent)
Both cities have good infrastructure, though Columbus' is more comprehensive due to its larger size and state capital status. There are numerous public parks, libraries, and other community amenities in both locations.
Infrastructure
Type
Columbus
Hialeah
Hospitals
47
6
TV stations
14
27
Bank branches located here
200
53
Bank institutions located here
25
22
Main business address for public companies
23
2
Drinking water stations with no reported violations in the past
17
1
Drinking water stations with reported violations in the past
HMDA - Conventional home purchase loans - Applications denied
Year
Columbus
Hialeah
1999
2,450
0
2000
2,376
267
2001
1,897
265
2002
1,483
244
2003
2,087
696
2004
3,216
983
2005
4,275
1,502
2006
4,662
2,294
2007
2,679
1,204
2008
1,015
319
2009
555
73
Culture and Food
Columbus boasts a rich cultural scene with music, arts, and food festivals, along with Midwest charm. Hialeah is famously known for its Cuban culture and food, combining the best of Latin and American cultures.
Sports Teams
For sports fans, Columbus has the Blue Jackets (NHL), Columbus Crew (MLS), and the Buckeyes college football, while Hialeah residents are close to Miami's Heat (NBA), Dolphins (NFL), and Marlins (MLB).


 Columbus, OH
 Hialeah, FL