Columbus, Ohio, and Garland, Texas, offer diverse lifestyles, both boasting unique advantages. Columbus, as the capital of Ohio, presents significant cultural experiences, robust educational systems, and vibrant neighborhoods. Garland, sitting within the Dallas-Fort Worth area, offers traditional Texas charm, a lower cost of living, and ease of commuting. This comparison aims to help those considering a change in scenery between these two cities, encompassing key factors affecting daily life from weather, cost of living, to health care and recreational options.
Distance between
Columbus, OH and
Garland, TX : 900.8 miles
Columbus's population is larger by 275%. Its population has grown by 195,058 people (27.4%) since 2000. The population of Garland has grown by 26,267 people (12.2%) during that time.
Columbus has a higher crime rate compared to the national average, with property crime being more prevalent. However, most crimes are concentrated in specific areas and the city is generally safe for both residents and tourists. In Garland, the crime rate is slightly lower than the national average, making it relatively safer. Both cities have proactive police departments that work tirelessly to keep their communities safe. Nonetheless, as with any city, certain precautions should be taken, such as avoiding secluded areas at night and securing personal belongings.
City-data.com crime index counts serious crimes and violent crime more heavily. It adjusts for the number of visitors and daily workers commuting into cities. (higher means more crime, U.S. average = 301.1)
City-data.com crime index counts serious crimes and violent crime more heavily. It adjusts for the number of visitors and daily workers commuting into cities. (higher means more crime, U.S. average = 301.1)
Sex Offenders
According to our data, there are 1,576 registered sex offenders living in Columbus and 390 registered sex offenders living in . The ratio of residents to sex offenders in Columbus is 547 to 1; the ratio in Garland is 602 to 1. The number of registered sex offenders compared to the number of residents in Columbus is near to than in Garland.
Cost of Living
The cost of living in Garland is lower than in Columbus. Housing, groceries, health care, and transportation are less expensive, contributing to a lower overall cost compared to the national average. In contrast, Columbus, while still less expensive than other major U.S. cities, has a marginally higher cost of living index. However, it offers a wide range of amenities and opportunities which may justify the slightly higher costs.
Income Tax
Columbus residents are subject to both a state income tax with rates ranging from 0.495% to 4.997% and a city income tax of 2.5%. Texas as a state does not impose an income tax; consequently, Garland residents are not obliged to pay state or city income tax, something to consider for potential transplants.
Property Tax
Property tax rates in Columbus average around 2.02%, whereas, in Garland, the rate is higher at about 2.38%. Despite the higher percentage, Garland's overall lower property prices may make housing costs more affordable.
Sales Tax
In terms of sales tax, Columbus residents pay a combined state and city sales tax rate of 7.5%, while Garland residents face a higher combined rate of 8.25%. However, it's worth noting that Texas does not levy a state income tax, which could balance out the higher sales tax.
Income
Type
Columbus
Garland
Estimated median household income
$58,202
$61,607
Estimated per capita income
$32,392
$24,936
Cost of living index (U.S. average is 100)
96.1
95.5
If you make $50,000 in Garland, you will have to make $50,314 in Columbus to maintain the same standard of living.
Geographical Conditions
Columbus is characterized by flat topography, with the Scioto River running through the city, creating beautiful riverfront views and parklands. Garland is located on the eastern part of Texas' rolling plains, with Lake Ray Hubbard providing waterfront recreational opportunities.
Columbus is home to Ohio State University, one of the largest universities in the U.S., and several other high-ranking institutions, making it a hub for higher education. The city's public school system is diverse and includes several standout schools. Garland's education system, while smaller in scale, has notable programs in its Garland Independent School District, including choice of school and diverse vocational programs catering to students' differing interests and capabilities.
Columbus' economy is diversified, with sectors such as education, government, insurance, banking, fashion, defense, aviation, food, logistics, steel, energy, medical research, and technology providing ample employment opportunities. Garland, part of the Dallas-Fort Worth metroplex, benefits from the dynamic Texan economy with sectors like technology, finance, healthcare, and telecommunications leading the way.
Biggest Employers
In Columbus, the State of Ohio, The Ohio State University, and Wexner Medical Center are among the biggest employers. Garland's largest employers include the Garland Independent School District, the City of Garland, and Baylor Scott & White Medical Center.
There were 913 building permits issued in Columbus in 2012 (246 more than in 2011) compared to 427 building permits issued in Garland in 2012 (279 more than in 2011).
In Columbus (Franklin County), 60.8% voted for Democrats and 37.9% for Republicans in 2012 Presidential Election. In Garland (Dallas County), 57.3% voted for Democrats and 41.8% for Republicans.
Elections
Type
Democrats
Republicans
Other
Year
Columbus
Garland
Columbus
Garland
Columbus
Garland
2020
64.7%
65.1%
33.4%
33.4%
1.9%
1.4%
2016
59.8%
60.8%
33.9%
34.7%
6.2%
4.5%
2012
60.8%
57.3%
37.9%
41.8%
1.3%
1.0%
2008
59.8%
57.4%
39.0%
42.0%
1.2%
0.6%
2004
54.5%
49.0%
45.2%
50.4%
0.3%
0.5%
2000
48.9%
45.0%
47.9%
52.7%
3.2%
2.4%
1996
48.1%
46.0%
44.5%
46.8%
7.3%
7.2%
Breakdown of population affiliated with a religious congregation
Type
Adherents
Congregations
Religion
Columbus
Garland
Columbus
Garland
CATHOLIC CHURCH
13.2%
18.9%
5.6%
2.4%
EVANGELICAL LUTHERAN CHURCH IN AMERICA
1.6%
0.3%
3.7%
0.9%
SOUTHERN BAPTIST CONVENTION
1.6%
11.0%
6.8%
31.1%
MUSLIM ESTIMATE
1.3%
3.6%
1.9%
1.1%
VINEYARD USA
1.3%
0.0%
1.2%
0.0%
AMERICAN BAPTIST CHURCHES IN THE USA
1.0%
0.1%
3.3%
0.2%
EPISCOPAL CHURCH
0.4%
1.0%
1.3%
1.5%
SEVENTH DAY ADVENTIST CHURCH
0.4%
0.5%
2.0%
1.7%
Weather
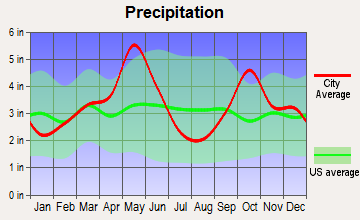
Columbus experiences a typical Midwestern climate, with hot, humid summers and cold, snowy winters. Outdoor enthusiasts will enjoy the beautiful fall foliage and springtime blossoms. Garland, on the other hand, boasts a subtropical climate, with mild winters and hot, humid summers. Those preferring warmer weather and minimal snow may find Garland more comfortable.
Weather and climate
Type
Columbus
Garland
Temperature - Average
52.8°F
64.5°F
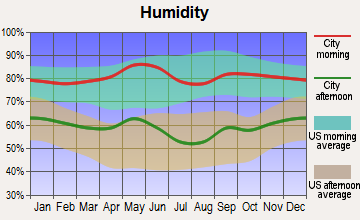
Humidity - Average morning or afternoon humidity
74.8%
71.3%
Humidity - Differences between morning and afternoon humidity
34%
34%
Humidity - Maximum monthly morning or afternoon humidity
86%
82%
Humidity - Minimum monthly morning or afternoon humidity
52%
48%
Precipitation - Yearly average
39.3 in
40 in
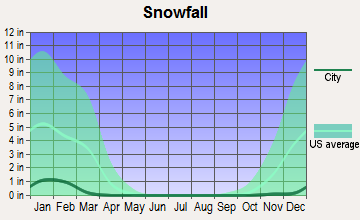
Snowfall - Yearly average
56.6 in
4.2 in
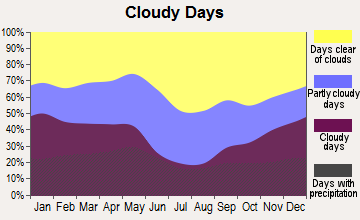
Clouds - Number of days clear of clouds
12%
22.8%
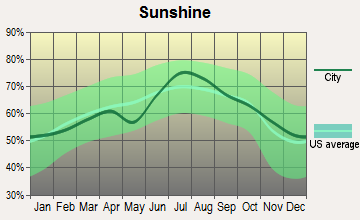
Sunshine amount - Average
49.7%
66.6%
Sunshine amount - Differences during a year
27%
20%
Sunshine amount - Maximum monthly
55%
74%
Sunshine amount - Minimum monthly
28%
54%
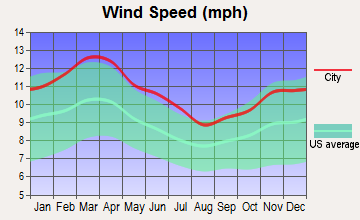
Wind speed - Average
8.2 mph
10.3 mph
Average climate in Columbus, Ohio
Average climate in Garland, Texas
Air pollution
Type
AQI
CO
NO2
OZONE
PB
PM10
PM25
SO2
Year
Columbus
Garland
Columbus
Columbus
Garland
Columbus
Garland
Garland
Columbus
Columbus
Garland
Columbus
Garland
2018
69
86
0.11
N/A
10.0
5.8
33.8
28.4
N/A
N/A
N/A
N/A
6.0
9.7
0.0
0.4
2017
68
84
0.16
N/A
9.6
5.7
28.7
29.7
N/A
N/A
N/A
N/A
5.5
9.1
0.1
0.3
2016
76
78
0.17
N/A
10.6
6.3
28.5
28.7
N/A
N/A
N/A
N/A
5.6
8.4
0.1
0.2
2015
74
84
0.16
N/A
11.3
6.9
27.0
29.1
N/A
N/A
N/A
N/A
6.1
8.9
0.1
0.3
2014
82
83
0.20
N/A
11.0
6.3
28.5
30.1
N/A
N/A
N/A
N/A
7.4
9.9
0.5
0.3
2013
78
95
N/A
N/A
8.9
7.1
29.6
31.2
N/A
N/A
N/A
N/A
7.8
13.0
0.6
0.2
2012
87
113
N/A
N/A
N/A
8.6
32.9
32.8
N/A
N/A
N/A
N/A
8.9
12.0
N/A
0.3
2011
89
98
N/A
N/A
N/A
9.2
28.1
32.8
N/A
N/A
N/A
N/A
8.9
11.9
N/A
0.6
2010
90
79
N/A
N/A
N/A
9.6
30.5
30.0
N/A
N/A
N/A
N/A
9.1
N/A
N/A
0.7
2009
61
87
N/A
N/A
N/A
9.4
28.7
30.8
N/A
N/A
N/A
N/A
N/A
N/A
N/A
0.5
2008
65
86
N/A
N/A
N/A
9.9
31.2
30.9
0.121
N/A
N/A
N/A
N/A
N/A
1.8
0.5
2007
80
94
N/A
N/A
N/A
10.6
30.8
27.6
0.070
N/A
N/A
N/A
N/A
N/A
2.8
0.3
2006
75
107
N/A
N/A
N/A
10.6
30.0
32.3
0.106
N/A
23.7
N/A
N/A
N/A
3.3
0.7
2005
87
105
N/A
N/A
N/A
13.1
29.6
31.4
0.142
N/A
27.5
N/A
N/A
11.0
4.1
0.9
2004
77
96
N/A
N/A
N/A
12.0
27.8
28.5
0.099
N/A
24.6
N/A
N/A
N/A
4.4
0.8
2003
91
102
N/A
N/A
N/A
13.8
26.4
29.8
0.121
N/A
23.9
N/A
N/A
N/A
4.1
1.0
2002
93
97
N/A
N/A
N/A
14.2
31.3
27.7
0.080
N/A
25.7
N/A
N/A
N/A
4.1
0.4
2001
84
100
N/A
N/A
N/A
13.8
29.2
29.0
0.069
N/A
25.9
N/A
N/A
N/A
3.5
1.0
2000
57
109
N/A
N/A
N/A
14.5
N/A
29.6
0.092
N/A
23.5
N/A
N/A
N/A
3.7
1.1
Natural disasters
Type
Columbus
Garland
Tornado activity compared to U.S. average
119.1%
252%
Earthquake activity compared to U.S. average
96.1%
577.9%
Natural disasters compared to U.S. average
16%
21%
Transportation
Public transit in Columbus is managed by the Central Ohio Transit Authority, providing bus service throughout the city. Many areas are also bike-friendly, and commuter driving is manageable. In Garland, Dallas Area Rapid Transit (DART) offers light rail and bus services. As part of the car-centric Dallas-Fort Worth area, many residents prefer driving, and the city provides convenient access to several major highways.
Transport
Type
Columbus
Garland
Amtrak stations
1
0
Amtrak stations nearby
1
1
FAA registered aircraft
415
75
FAA registered aircraft manufacturers and dealers
4
1
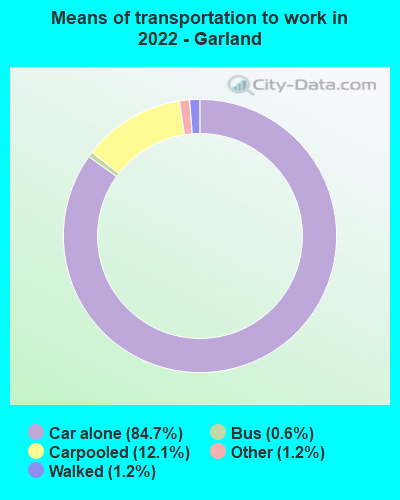
Means of transportation to work
Type
Columbus
Garland
Bicycle
0.6%
0.1%
Bus
1.6%
1%
Carpooled
7.4%
11.2%
Car alone
86.7%
85.3%
Taxicab
0.1%
0%
Walked
2.2%
1.4%
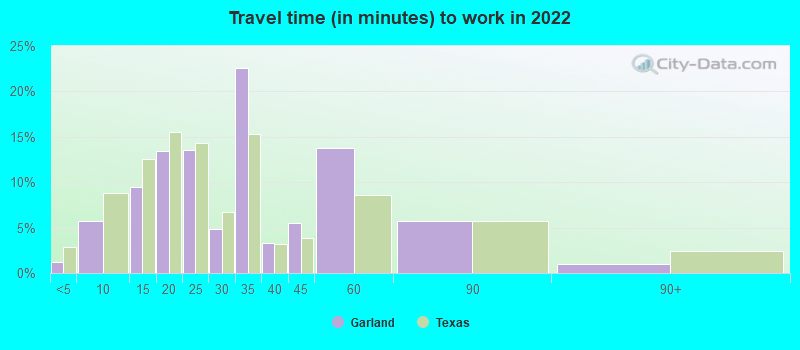
Average travel time to work
Type
Columbus
Garland
Average
26.1 min
30.2 min
Other means
21.7 min
28.8 min
Public transportation
35.4 min
48.5 min
Private vehicle occupancy
Type
Columbus
Garland
Average
1.1
1.2
Drove alone
90.7%
87%
In 2 person carpool
7.3%
9.3%
In 3 person carpool
1.4%
2.2%
In 4 person carpool
0.5%
0.8%
In 5-6 person carpool
0.1%
0.6%
How many people usually rode to work in the car, truck or van.
Real Estate
Housing in Columbus offers a mix of historic homes, downtown apartments, and suburban developments, catering to diverse preferences and budgets. In Garland, property prices are generally lower, with a variety of home types including single-family homes and townhouses, providing affordable options for first-time home buyers.
Neighborhoods
Columbus boasts vibrant neighborhoods like German Village, known for historic architecture, and Short North, buzzing with art galleries and eateries. Garland offers quiet, family-friendly neighborhoods such as Duck Creek and Spring Park, noted for their verdant parklands and greenbelts.
Houses and residents
Type
Columbus
Garland
Houses
422,120
80,577
Average household size (people)
2.3
3
Median year apartment built
1982
1978
Median year house/condo built
1977
1977
Length of stay in the house since moving in
12.6 years
13.7 years
Houses occupied
390,605 (92.5%)
77,777 (96.5%)
Houses occupied by owners
175,427 (44.9%)
46,943 (60.4%)
Houses occupied by renters
215,178 (55.1%)
30,834 (39.6%)
Median rent asked for vacant for-rent units
$1,371
$605.67
Median monthly housing costs
$1,110
$1,285
Median price asked for vacant for-sale houses and condos
$195,022
$176,480
Estimated median house or condo value
$219,200
$232,300
Median numbers of rooms
5
5.3
Median number of rooms in apartments
4.2
4
Median number of rooms in houses and condos
6.3
6
Median house price - detached houses
$233,452
$246,291
Median house price - in 2-unit structures
$121,729
$91,558
Median house price - in 3-to-4-unit structures
$215,337
$95,529
Median house price - in 5 or more unit structures
$240,711
$181,835
Median house price - mobile homes
$121,578
$186,884
Median house price - Townhouses or other attached units
$218,726
$151,380
Median house price - All housing units
$229,736
$241,433
Median house age
42
44
Renting percentage
53%
34.8%
Housing density (houses/condos per square mile)
2,007.5
1,410.9
House value disparities
30.2%
22.4%
Household income disparities
42.4%
41%
Median household income for houses/condes with a mortgage
$89,058
$83,676
Median household income for apartments without a mortgage
$59,295
$65,175
Housing units without a mortgage
4,290 (3.3%)
537 (1.9%)
Housing units with both a second mortgage and home equity loan
10,651 (8.2%)
674 (2.3%)
Housing units with a mortgage
125,487 (96.7%)
28,234 (98.1%)
Housing units with a home equity loan
775 (0.6%)
0 (0%)
Housing units with a second mortgage
13,558 (10.4%)
794 (2.8%)
House/condo owner moved in on average (years ago)
10
13
House/condo renter moved in on average (years ago)
1
1
Housing units lacking complete kitchen facilities
1.6%
1.2%
Housing units lacking complete plumbing facilities
1.3%
1.2%
Housing units in structures
Housing units in structures
Columbus
Garland
One, detached
45.8%
68.7%
One, attached
9.1%
2.6%
Two
4.0%
0.2%
3 or 4
8.6%
5.1%
5 to 9
11.8%
3.2%
10 to 19
8.6%
12.0%
20 to 49
4.5%
2.7%
50 or more
6.8%
4.4%
Mobile homes
0.8%
1.1%
Boats, RVs, vans, etc.
0.1%
0.0%
Median real estate property taxes paid for housing units
Self-employed workers in own not incorporated business
20,915
8,212
State government workers
31,881
2,298
Unpaid family workers
724
81
Industries and Occupations
The top employing industries in Columbus include healthcare, education, and government, with renowned companies such as Nationwide Insurance and American Electric Power headquartered in the city. Garland offers a diverse mix of industries, with finance, healthcare, retail and manufacturing leading in job creation. The city is known for its robust manufacturing sector, hosting several major companies like Raytheon and General Dynamics.
Columbus is highly regarded for its health care, with facilities like OhioHealth, Nationwide Children's Hospital, and The Ohio State University Wexner Medical Center catering to diverse medical needs. Garland's healthcare, though smaller in scale, offers solid services, with top-rated facilities like Baylor Scott & White Medical Center - Garland.
Health (county statistics)
Type
Columbus
Garland
General health status score of residents in this county from 1 (poor) to 5 (excellent)
Columbus' infrastructure supports a high standard of living, with a focus on green energy and well-maintained city facilities. The city's innovation district fosters a tech-friendly environment. Garland, with its connectivity to major highways and well-maintained facilities, ensures a comfortable living environment. Revitalization projects in the downtown area add to the city’s charm, making it attractive for both residents and tourists.
HMDA - Conventional home purchase loans - Applications denied
Year
Columbus
Garland
1999
2,450
916
2000
2,376
398
2001
1,897
296
2002
1,483
297
2003
2,087
750
2004
3,216
921
2005
4,275
1,370
2006
4,662
1,398
2007
2,679
794
2008
1,015
334
2009
555
159
Culture and Food
Columbus offers a thriving arts scene, from the cutting-edge exhibitions at Columbus Museum of Art to performances at Ohio Theatre. The city's culinary scene is diverse, featuring everything from farm-to-table bistros to international cuisine. Garland boasts a rich blend of cultures, reflected in its thriving food scene. From authentic Mexican and Tex-Mex cuisine to traditional Texas barbecues, the city offers a range of dining experiences. The Granville Arts Center and Pace House present local performing arts and historical exhibits.
Sports Teams
Sports enthusiasts in Columbus have several professional teams to root for, including the NHL's Blue Jackets, MLS's Crew SC, and minor league baseball's Clippers. Garland doesn't have any home-based professional teams, but residents can enjoy various Dallas-based teams, such as the NFL's Cowboys, NBA's Mavericks, and MLB's Rangers.
 Columbus, OH
 Garland, TX