Columbus, OH vs Columbus, GA - Advanced U.S. city comparison tool

Columbus, OH vs Columbus, GA

Columbus, OH and Columbus, GA, though sharing a name, offer distinctly different lifestyles. The Ohio city offers a vibrant cultural scene, bustling economy and exceptional education opportunities. Columbus, GA, on the other hand, provides a more relaxed lifestyle, with comfortable weather, lower cost of living, and lovely outdoor attractions. Both cities have their strengths and appeals, depending on individual preferences.
 
 
Distance between Columbus, OH and Columbus, GA : 529.4 miles

Columbus's population is larger by 388%. Its population has grown by 195,058 people (27.4%) since 2000.

Population
Type Columbus Columbus
Population 906,528 185,888
Female / male percentage 50.7% / 49.3%
50.7%
49.3%
51.4% / 48.6%
51.4%
48.6%
Racial makeup - percentage
Ethnicity ColumbusColumbus
White Non-Hispanic 52.9% 48.6%
Black 29.0% 43.4%
Hispanic 6.9% 4.5%
Asian 5.7% 1.5%
Two or more 5.0% 1.4%
American Indian 0.1% 0.3%
Pacific Islander 0.0% 0.1%
Racial makeup - absolute values
Ethnicity ColumbusColumbus
White Non-Hispanic 479,734 90,200
Black 262,859 80,698
Hispanic 62,657 8,368
Asian 51,849 2,788
Two or more 45,592 2,568
American Indian 677 614
Pacific Islander 199 248

Crime and Safety

When comparing safety, both cities have relatively similar crime rates, but Columbus, OH shows slighter better statistics. Efforts in both cities are ongoing to increase safety as they continue to grow. It's always crucial to research neighborhoods before moving, as safety levels can vary drastically from one area to another. Tourists are relatively safe in popular and well-trafficked areas, but it's always advised to keep personal belongings secure and stay aware of one's surroundings.

Crime by year per 100,000 residents
Type City-data.com crime indexRobberies per 100,000Murders per 100,000Rapes per 100,000Assaults per 100,000Burglaries per 100,000Theft per 100,000Auto theft per 100,000Arson per 100,000
Year ColumbusColumbusColumbusColumbusColumbusColumbusColumbusColumbusColumbusColumbusColumbusColumbusColumbusColumbusColumbusColumbusColumbusColumbus
2020 376.1 0.0 197.1 0.0 19.1 0.0 89.5 0.0 250.1 0.0 609.1 0.0 2,180.6 0.0 340.7 0.0 1.3 0.0
2019 366.2 189.1 200.6 111.1 9.5 6.2 99.0 11.8 198.6 188.3 643.0 277.8 2,286.8 1,493.7 394.8 214.0 1.2 2.6
2018 391.5 348.6 219.9 161.2 12.3 12.9 100.6 36.1 182.1 327.1 726.4 614.0 2,437.8 2,807.3 445.2 311.1 1.2 2.1
2017 427.9 429.6 227.6 197.7 16.4 18.1 112.2 36.2 168.7 404.9 820.0 1,072.8 2,681.7 3,017.6 482.8 354.1 1.3 17.6
2016 426.3 416.4 250.7 251.6 12.1 12.9 105.9 18.8 175.6 301.5 901.8 1,118.4 2,775.5 3,206.0 412.3 417.6 47.0 9.4
2015 418.9 454.9 267.1 268.4 9.8 9.3 105.2 33.4 179.2 244.4 857.3 1,256.3 2,738.9 3,767.8 370.4 518.7 47.8 18.2
2014 430.6 499.4 254.2 247.2 10.2 10.6 94.7 22.7 199.3 252.0 1,095.3 1,795.2 2,828.0 4,109.5 355.0 567.0 34.4 22.7
2013 465.9 476.1 301.7 239.1 9.6 10.9 84.8 17.9 148.6 240.1 1,444.1 1,667.8 3,111.8 3,982.8 414.4 550.8 45.2 18.4
2012 513.5 436.4 380.1 215.6 8.9 8.7 74.0 15.8 140.0 266.6 1,865.9 1,380.9 3,235.8 3,930.6 430.3 431.2 65.0 14.3
2011 567.0 477.8 412.8 214.7 11.0 7.8 75.4 20.8 164.5 241.7 1,934.0 1,737.1 3,888.5 4,189.0 461.5 545.3 30.2 20.3
2010 582.4 516.1 428.1 251.2 12.1 7.9 72.9 20.0 182.2 250.2 1,938.7 1,819.0 3,926.9 4,729.7 528.4 530.3 51.2 34.2
2009 591.1 591.5 447.6 308.2 10.8 7.0 78.9 25.2 170.5 278.7 1,924.7 2,036.3 3,977.4 5,033.7 552.0 815.1 56.9 26.3
2008 624.5 622.7 478.9 341.0 13.3 16.1 85.7 38.7 200.7 288.4 1,962.1 1,756.6 3,788.5 5,185.3 708.2 864.6 62.5 43.0
2007 673.2 584.6 523.8 327.1 10.7 12.7 92.8 30.2 228.9 326.6 1,960.5 1,403.6 4,233.9 4,957.6 849.3 937.8 86.7 28.1
2006 664.5 547.9 499.5 304.4 11.6 8.9 81.7 9.9 220.8 297.6 2,031.6 1,450.2 4,243.2 4,812.2 873.6 967.5 76.4 16.2
2005 576.1 423.5 521.7 237.4 14.1 11.7 76.3 12.8 237.3 266.1 2,014.7 1,426.9 4,406.4 4,664.0 1,097.3 894.7 63.7 42.6
2004 575.7 397.7 460.1 209.8 10.7 13.3 81.9 15.9 261.0 241.2 2,002.6 1,220.1 4,673.3 4,642.5 1,168.9 788.3 69.5 36.7
2003 587.3 384.7 458.9 176.0 15.0 10.1 84.7 11.7 297.3 247.2 2,017.5 1,171.6 4,591.7 5,079.3 1,149.2 648.0 22.3 21.3

City-data.com crime index counts serious crimes and violent crime more heavily. It adjusts for the number of visitors and daily workers commuting into cities. (higher means more crime, U.S. average = 301.1)


Crime per year
Type City-data.com crime indexRobberiesMurdersRapesAssaultsBurglariesTheftAuto theftArson
Year ColumbusColumbusColumbusColumbusColumbusColumbusColumbusColumbusColumbusColumbusColumbusColumbusColumbusColumbusColumbusColumbusColumbusColumbus
2019 366.2 189.1 1,818 216 86 12 897 23 1,800 366 5,826 540 20,721 2,903 3,577 416 11 5
2018 391.5 348.6 1,963 313 110 25 898 70 1,625 635 6,484 1,192 21,759 5,450 3,974 604 11 4
2017 427.9 429.6 1,985 393 143 36 979 72 1,471 805 7,152 2,133 23,390 6,000 4,211 704 11 35
2016 426.3 416.4 2,162 509 104 26 913 38 1,515 610 7,778 2,263 23,939 6,487 3,556 845 405 19
2015 418.9 454.9 2,264 547 83 19 892 68 1,519 498 7,268 2,560 23,219 7,678 3,140 1,057 405 37
2014 430.6 499.4 2,112 511 85 22 787 47 1,656 521 9,100 3,711 23,495 8,495 2,949 1,172 286 47
2013 465.9 476.1 2,463 481 78 22 692 36 1,213 483 11,789 3,355 25,404 8,012 3,383 1,108 369 37
2012 513.5 436.4 3,031 423 71 17 590 31 1,116 523 14,878 2,709 25,802 7,711 3,431 846 518 28
2011 567.0 477.8 3,251 413 87 15 594 40 1,296 465 15,232 3,342 30,626 8,059 3,635 1,049 238 39
2010 582.4 516.1 3,369 477 95 15 574 38 1,434 475 15,258 3,454 30,906 8,981 4,159 1,007 403 65
2009 591.1 591.5 3,399 574 82 13 599 47 1,295 519 14,616 3,792 30,204 9,374 4,192 1,518 432 49
2008 624.5 622.7 3,601 635 100 30 644 72 1,509 537 14,753 3,271 28,485 9,656 5,325 1,610 470 80
2007 673.2 584.6 3,855 618 79 24 683 57 1,685 617 14,429 2,652 31,161 9,367 6,251 1,772 638 53
2006 664.5 547.9 3,654 582 85 17 598 19 1,615 569 14,862 2,773 31,041 9,202 6,391 1,850 559 31
2005 576.1 423.5 3,810 446 103 22 557 24 1,733 500 14,714 2,681 32,181 8,763 8,014 1,681 465 80
2004 575.7 397.7 3,358 395 78 25 598 30 1,905 454 14,617 2,297 34,111 8,740 8,532 1,484 507 69
2003 587.3 384.7 3,332 331 109 19 615 22 2,159 465 14,650 2,204 33,343 9,555 8,345 1,219 162 40

City-data.com crime index counts serious crimes and violent crime more heavily. It adjusts for the number of visitors and daily workers commuting into cities. (higher means more crime, U.S. average = 301.1)

Sex Offenders

According to our data, there are 1,576 registered sex offenders living in Columbus and 740 registered sex offenders living in .
The ratio of residents to sex offenders in Columbus is 547 to 1; the ratio in Columbus is 251 to 1.
The number of registered sex offenders compared to the number of residents is a smaller in Columbus than in Columbus.

Cost of Living

Columbus, GA generally has a lower cost of living compared to Columbus, OH. Expenses such as housing, groceries, and health care are usually less expensive in Georgia, which is certainly a consideration for potential residents. However, wages tend to be higher in Ohio which might offset the cost of living difference.

Income Tax

Columbus, OH has a local income tax of 2.5% on top of the Ohio state income tax. In contrast, Columbus, GA, like the rest of Georgia, has no local income taxes, which may be more appealing to those looking to relocate.

Property Tax

Property taxes in Columbus, OH tend to be higher than in Columbus, GA. However, the exact figure will depend on the specific property and neighborhood.

Sales Tax

Ohio has a lower state sales tax rate of 5.75% compared to Georgia's 6%, which could impact day-to-day expenses slightly.
Income
Type Columbus Columbus
Estimated median household income $58,202 $52,817
Estimated per capita income $32,392 $29,689
Cost of living index (U.S. average is 100) 96.1 86.8

If you make $50,000 in Columbus, you will have to make $55,357 in Columbus to maintain the same standard of living.

Geographical Conditions

Geographically, Columbus, OH is largely flat and urban, with some access to outdoor activities like hiking and kayaking in nearby areas. Columbus, GA offers more direct access to outdoor recreation with the Chattahoochee River running through the city and close proximity to the Appalachian Mountains.
Geographical information
Type Columbus Columbus
Land area 210.3 sq. miles 216.1 sq. miles
Population density 4,311.3 people per sq. mile 860.2 people per sq. mile
Elevation 800 feet 300 feet
Relative area comparison
Columbus, OH Columbus, GA
First ancestry reported - percentage
Ancestry ColumbusColumbus
German 7.8% 6.7%
English 5.2% 6.2%
Irish 4.2% 6.6%
Italian 3.2% 1.6%
Polish 1.2% 0.8%
Scottish 0.7% 1.3%
Scotch-Irish 0.5% 1.5%
Welsh 0.5% 0.3%
Slovak 0.3% 0.1%
Russian 0.3% 0.2%
Dutch 0.3% 0.7%
Lithuanian 0.2% 0.1%
Norwegian 0.2% 0.4%
Hungarian 0.2% 0.2%
French 0.2% 1.4%
Swedish 0.2% 0.3%
Ukrainian 0.2% 0.0%
French Canadian 0.1% 0.3%
Subsaharan African 0.0% 1.4%
United States 0.0% 9.8%
Population origin - absolute values
Ancestry ColumbusColumbus
German 39,093 12,529
English 25,954 11,560
Irish 21,227 12,223
Italian 15,939 3,008
Polish 5,799 1,567
Scottish 3,493 2,328
Scotch-Irish 2,642 2,742
Welsh 2,395 547
Slovak 1,547 93
Russian 1,502 284
Dutch 1,361 1,258
Hungarian 1,088 386
Ukrainian 1,081 79
Lithuanian 1,020 99
Norwegian 937 762
Greek 847 210
French 789 2,527
Swedish 763 508
Swiss 757 106
Czech 673 344
Foreign born residents - absolute values
Type Count
Region ColumbusColumbus
All 125,304 8,632
Africa 42,208 228
Asia 44,859 2,213
Europe 8,129 2,653
Latin America 23,931 3,270
North America 1,235 130
Oceania 245 138
Foreign born residents - percentage
Type Percentage
Region ColumbusColumbus
All 13.9% 4.6%
Africa 4.7% 0.1%
Asia 5.0% 1.2%
Europe 0.9% 1.4%
Latin America 2.6% 1.8%
North America 0.1% 0.1%

Education

When it comes to education, Columbus, OH stands out with numerous high-ranking public and private schools. The city is home to The Ohio State University, a highly respected institution known for its research programs. Columbus, GA does have good schools and colleges but Ohio's higher number of educational opportunities gives it an edge.
School enrollment
Type Columbus Columbus
Nursery, preschool 8,473 (3.8%) 4,090 (8%)
Kindergarten 10,536 (4.7%) 3,084 (6.1%)
Grade 1 to 4 40,173 (17.9%) 11,260 (22.1%)
Grade 5 to 8 41,603 (18.5%) 11,183 (22%)
Grade 9 to 12 40,616 (18.1%) 11,192 (22%)
College undergrad 63,955 (28.4%) 8,414 (16.6%)
Graduate or professional 19,575 (8.7%) 1,615 (3.2%)
Students in private schools - absolute values
Type Count
Grade ColumbusColumbus
Grades 1 to 8 (elementary and middle school) 15,679 2,100
Grades 9 to 12 (high school) 5,030 880
Undergraduate colleges 8,811 694
Students in private schools - percentage
Type Percentage
Grade ColumbusColumbus
Grades 1 to 8 (elementary and middle school) 19.2% 9.4%
Grades 9 to 12 (high school) 12.4% 7.9%
Undergraduate colleges 13.8% 8.2%
Educational attainment
Type Columbus Columbus
Less than high school 9.2% 21%
High school or equiv. 24.9% 28.2%
Less than 1 year of college 6.3% 8%
1 or more years of college 13.6% 16.1%
Associate degree 7.6% 6.4%
Bachelor's degree 25% 12.4%
Master's degree 9.8% 5.8%
Profess. school degree 2% 1.7%
Doctorate degree 1.6% 0.5%
Education level (25-year-olds and older)
Type Columbus Columbus
Bachelor's degree or higher 38.4% 20.4%
Graduate or professional degree 13.4% 8%
High school or higher 90.8% 79%

Work and Economy

Columbus, OH presents a stronger economy with a lower unemployment rate compared to Columbus, GA. Key industries in Ohio include finance, healthcare, education, and retail. The economy in Georgia's Columbus is centered around manufacturing, healthcare, and education. Both cities provide job opportunities, but Ohio arguably offers more diversity in industries.

Biggest Employers

Ohio's Columbus houses several huge employers like JPMorgan Chase, Honda, and The Ohio State University. In Columbus, GA, the top employers include TSYS, Aflac, and Fort Benning.
Employment and residency - absolute values
Kind ColumbusColumbus
Work and live in this city 254,193 71,631
Work and live in this county 412,410 N/A
Workers who work outside the city they live in 457,277 114,150
Workers who work outside the county they live in 56,853 N/A
Working at home 111,379 N/A
Not working at home 357,884 N/A
Daytime population change due to commuting 82,520 18,456
Employment and residency - percentage
Kind ColumbusColumbus
Work and live in this city 69.2% 86.5%
Work and live in this county 87.9% N/A
Workers who work outside the city they live in 30.8% 13.5%
Workers who work outside the county they live in 12.1% N/A
Working at home 23.7% N/A
Not working at home 76.3% N/A
Daytime population change due to commuting 11.6% 9.9%
Building permits
Type Average valueCount
City ColumbusColumbusColumbusColumbus
1997 $74,900 $80,500 1,822 633
1998 $78,200 $104,600 1,979 622
1999 $105,800 $97,700 2,871 574
2000 $128,300 $94,900 2,903 556
2001 $130,400 $103,300 3,058 506
2002 $133,600 $99,400 3,196 615
2003 $137,900 $112,400 3,188 704
2004 $141,300 $104,100 2,687 701
2005 $160,500 $106,300 2,360 846
2006 $168,800 $105,700 1,223 710
2007 $163,200 $105,900 1,008 488
2008 $169,200 $105,800 686 286
2009 $162,500 $105,900 852 223
2010 $164,100 $105,900 716 224
2011 $160,000 $105,900 667 217
2012 $163,700 $105,900 723 262
2013 $174,000 $105,900 770 318
2014 $211,100 $105,900 724 333
2015 $244,000 $204,200 729 290
2016 $243,500 $191,900 649 270
2017 $257,700 $195,300 650 311
2018 $226,600 $194,500 555 326
2019 $259,300 $188,600 512 293
2020 $266,700 $96,300 834 901
2021 $306,700 $198,900 913 296

There were 913 building permits issued in Columbus in 2012 (246 more than in 2011) compared to 296 building permits issued in Columbus in 2012 (79 more than in 2011).

In Columbus (Franklin County), 60.8% voted for Democrats and 37.9% for Republicans in 2012 Presidential Election. In Columbus (Muscogee County), 60.3% voted for Democrats and 39.0% for Republicans.

Elections
Type DemocratsRepublicansOther
Year ColumbusColumbusColumbusColumbusColumbusColumbus
2020 64.7% 61.4% 33.4% 37.4% 1.9% 1.2%
2016 59.8% 57.4% 33.9% 38.9% 6.2% 3.7%
2012 60.8% 60.3% 37.9% 39.0% 1.3% 0.7%
2008 59.8% 59.7% 39.0% 40.0% 1.2% 0.4%
2004 54.5% 51.4% 45.2% 48.2% 0.3% 0.4%
2000 48.9% 54.3% 47.9% 45.2% 3.2% 0.5%
1996 48.1% 53.8% 44.5% 41.9% 7.3% 4.4%
Breakdown of population affiliated with a religious congregation
Type AdherentsCongregations
Religion ColumbusColumbusColumbusColumbus
CATHOLIC CHURCH 13.2% 4.6% 5.6% 1.5%
EVANGELICAL LUTHERAN CHURCH IN AMERICA 1.6% 0.1% 3.7% 0.4%
SOUTHERN BAPTIST CONVENTION 1.6% 22.8% 6.8% 16.6%
MUSLIM ESTIMATE 1.3% 1.2% 1.9% 1.2%
VINEYARD USA 1.3% 0.0% 1.2% 0.0%
AMERICAN BAPTIST CHURCHES IN THE USA 1.0% 0.5% 3.3% 0.8%
EPISCOPAL CHURCH 0.4% 0.6% 1.3% 1.2%
SEVENTH DAY ADVENTIST CHURCH 0.4% 0.5% 2.0% 0.8%

Weather

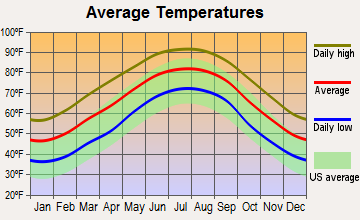
The climates in the two cities are notably different. Columbus, OH experiences a full range of seasons, from cold snowy winters to warm summers. Columbus, GA, in contrast, offers a more temperate and humid climate, with mild winters and hot, humid summers. If enjoying a variety of seasons is a priority, Ohio might be a more suitable choice, whereas Georgia may appeal to those who prefer warmer weather year-round.
Weather and climate
Type Columbus Columbus
Temperature - Average 52.8°F 65.1°F
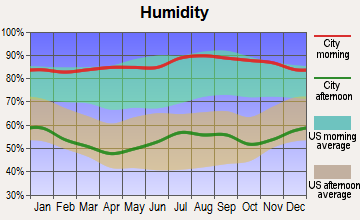
Humidity - Average morning or afternoon humidity 74.8% 74.6%
Humidity - Differences between morning and afternoon humidity 34% 42%
Humidity - Maximum monthly morning or afternoon humidity 86% 89%
Humidity - Minimum monthly morning or afternoon humidity 52% 47%
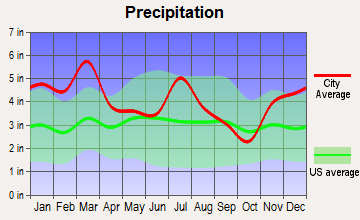
Precipitation - Yearly average 39.3 in 48.6 in
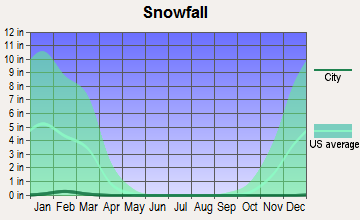
Snowfall - Yearly average 56.6 in 1 in
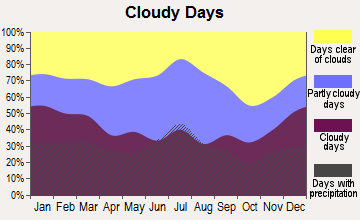
Clouds - Number of days clear of clouds 12% 18.3%
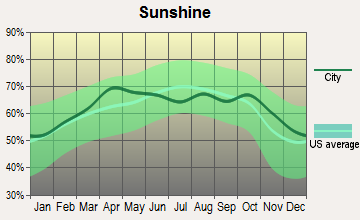
Sunshine amount - Average 49.7% 66.5%
Sunshine amount - Differences during a year 27% 17.4%
Sunshine amount - Maximum monthly 55% 68%
Sunshine amount - Minimum monthly 28% 50.6%
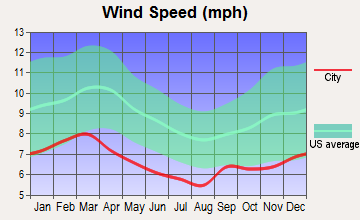
Wind speed - Average 8.2 mph 6.6 mph

Average climate in Columbus, Ohio

Chicago, Illinois average temperatures Chicago, Illinois average precipitation Chicago, Illinois humidity Chicago, Illinois wind speed Chicago, Illinois snowfall Chicago, Illinois sunshine Chicago, Illinois clear and cloudy days
 

Average climate in Columbus, Georgia

Chicago, Illinois average temperatures Chicago, Illinois average precipitation Chicago, Illinois humidity Chicago, Illinois wind speed Chicago, Illinois snowfall Chicago, Illinois sunshine Chicago, Illinois clear and cloudy days
 

Air pollution
Type AQICONO2OZONEPBPM10PM25SO2
Year ColumbusColumbusColumbus Columbus ColumbusColumbusColumbus Columbus ColumbusColumbusColumbusColumbus
2018 69 61 0.11 N/A 10.0 N/A 33.8 28.3 N/A N/A N/A N/A 6.0 6.8 0.0 N/A
2017 68 71 0.16 N/A 9.6 N/A 28.7 28.8 N/A N/A N/A N/A 5.5 8.4 0.1 N/A
2016 76 76 0.17 N/A 10.6 N/A 28.5 30.8 N/A N/A N/A N/A 5.6 8.1 0.1 N/A
2015 74 70 0.16 N/A 11.3 N/A 27.0 26.9 N/A N/A N/A N/A 6.1 8.1 0.1 N/A
2014 82 78 0.20 N/A 11.0 N/A 28.5 28.0 N/A N/A N/A N/A 7.4 9.2 0.5 N/A
2013 78 72 N/A N/A 8.9 N/A 29.6 28.5 N/A N/A N/A N/A 7.8 8.4 0.6 N/A
2012 87 79 N/A N/A N/A N/A 32.9 30.6 N/A N/A N/A N/A 8.9 9.5 N/A 1.1
2011 89 86 N/A N/A N/A N/A 28.1 32.0 N/A N/A N/A N/A 8.9 11.6 N/A 1.2
2010 90 81 N/A N/A N/A N/A 30.5 31.5 N/A N/A N/A N/A 9.1 10.9 N/A 1.2
2009 61 75 N/A N/A N/A N/A 28.7 28.8 N/A N/A N/A N/A N/A 10.0 N/A 1.3
2008 65 81 N/A N/A N/A N/A 31.2 33.2 0.004 N/A N/A N/A N/A 11.7 1.8 1.7
2007 80 103 N/A N/A N/A N/A 30.8 35.7 0.004 N/A N/A N/A N/A 14.8 2.8 N/A
2006 75 99 N/A N/A N/A N/A 30.0 34.6 0.004 N/A 23.7 N/A N/A 14.1 3.3 N/A
2005 87 104 N/A N/A N/A N/A 29.6 30.6 0.004 N/A 27.5 N/A N/A 13.3 4.1 2.0
2004 77 94 N/A N/A N/A N/A 27.8 28.9 0.005 N/A 24.6 N/A N/A 13.3 4.4 N/A
2003 91 84 N/A N/A N/A N/A 26.4 26.9 0.004 N/A 23.9 N/A N/A N/A 4.1 N/A
2002 93 62 N/A N/A N/A N/A 31.3 27.9 N/A N/A 25.7 N/A N/A N/A 4.1 1.9
2001 84 88 N/A N/A N/A N/A 29.2 30.1 N/A N/A 25.9 N/A N/A N/A 3.5 N/A
2000 57 110 N/A N/A N/A N/A N/A 34.2 N/A N/A 23.5 N/A N/A N/A 3.7 N/A
Natural disasters
Type Columbus Columbus
Tornado activity compared to U.S. average 119.1% 137.4%
Earthquake activity compared to U.S. average 96.1% 132.7%
Natural disasters compared to U.S. average 16% 7%

Transportation

Public transit in Ohio's Columbus is more comprehensive, served by Central Ohio Transit Authority (COTA). Georgia's Columbus depends more on personal vehicles, although they do have a public bus service, Metra Transit System.
Transport
Type Columbus Columbus
Amtrak stations 1 1
Amtrak stations nearby 1 1
FAA registered aircraft 415 85
FAA registered aircraft manufacturers and dealers 4 3
Means of transportation to work
Type Columbus Columbus
Bicycle 0.6% 0.1%
Bus 1.6% 1.1%
Carpooled 7.4% 14.6%
Car alone 86.7% 75.5%
Taxicab 0.1% 0.3%
Walked 2.2% 4.7%
Means of transportation to work
Average travel time to work
Type Columbus Columbus
Average 26.1 min 20.5 min
Travel time to work
Time leaving to work
Travel time to work
Time leaving to work

Real Estate

When examining the real estate market, homes in Columbus, GA tend to be more affordable than those in Columbus, OH. The Ohio city, however, offers a wider range of housing options – from urban apartments to suburban family homes.

Neighborhoods

Both cities boast a mix of historical and modern neighborhoods. Ohio's Columbus has vibrant areas like German Village and Short North, while Georgia's Columbus offers charming districts like the Historic District and MidTown.
Houses and residents
Type Columbus Columbus
Houses 422,120 75,938
Average household size (people) 2.3 2.5
Houses occupied 390,605 (92.5%) 69,597 (91.7%)
Houses occupied by owners 175,427 (44.9%) 39,266 (56.4%)
Houses occupied by renters 215,178 (55.1%) 30,331 (43.6%)
Median rent asked for vacant for-rent units $1,371 $599.09
Median price asked for vacant for-sale houses and condos $195,022 $61,168
Estimated median house or condo value $219,200 $171,106
Median number of rooms in apartments 4.2 4.8
Median number of rooms in houses and condos 6.3 6.6
Housing density (houses/condos per square mile) 2,007.5 351.4
Household income disparities 42.4% 46.6%
Housing units without a mortgage 4,290 (3.3%) 9,803 (27%)
Housing units with both a second mortgage and home equity loan 10,651 (8.2%) 91 (0.3%)
Housing units with a mortgage 125,487 (96.7%) 26,511 (73%)
Housing units with a home equity loan 775 (0.6%) 2,477 (6.8%)
Housing units with a second mortgage 13,558 (10.4%) 3,939 (10.8%)
Housing units lacking complete kitchen facilities 1.6% 0.8%
Housing units lacking complete plumbing facilities 1.3% 0.5%
Housing units in structures
Housing units in structures ColumbusColumbus
One, detached 45.8% 65.5%
One, attached 9.1% 3.1%
Two 4.0% 3.4%
3 or 4 8.6% 6.8%
5 to 9 11.8% 7.5%
10 to 19 8.6% 4.0%
20 to 49 4.5% 2.3%
50 or more 6.8% 3.6%
Mobile homes 0.8% 3.8%
Boats, RVs, vans, etc. 0.1% 0.0%
Marital status
Type Columbus Columbus
Divorced 10.2% 11.9%
Never married 45.1% 29%
Now married 38.4% 47.6%
Separated 2.3% 3.7%
Widowed 4% 7.8%
Class of workers - percentage
Class of Workers ColumbusColumbus
Employee of private company 70.7% 67.4%
Private not-for-profit wage and salary workers 8.8% 5.3%
State government workers 6.7% 5.0%
Local government workers 5.4% 7.6%
Self-employed workers in own not incorporated business 4.4% 5.3%
Self-employed in own incorporated business 2.2% 2.6%
Federal government workers 1.7% 6.4%
Unpaid family workers 0.2% 0.3%
Class of workers - absolute values
Class of Workers ColumbusColumbus
Employee of private company 337,898 50,903
Federal government workers 7,961 4,836
Local government workers 25,846 5,760
Private not-for-profit wage and salary workers 42,209 4,010
Self-employed in own incorporated business 10,584 1,958
Self-employed workers in own not incorporated business 20,915 3,992
State government workers 31,881 3,806
Unpaid family workers 724 211

Industries and Occupations

Columbus, OH hosts several Fortune 500 companies providing a diverse range of job opportunities in finance, retail, healthcare, and education. Columbus, GA, while smaller, still boasts solid opportunities, especially in manufacturing, the military, and healthcare.
Food environment data per 10,000 residents
Food environment statistics ColumbusColumbus
Number of convenience stores (no gas) 2.6 4.8
Number of convenience stores (with gas) 1.3 0.1
Number of full-service restaurants 6.5 6.5
Number of grocery stores 2.3 1.9
Number of supercenters and club stores 0.1 0.1
Food environment - absolute values
Food environment statistics ColumbusColumbus
Number of convenience stores (no gas) 285 90
Number of convenience stores (with gas) 146 2
Number of full-service restaurants 730 121
Number of grocery stores 251 36
Number of supercenters and club stores 11 1
Obesity and diabetes
Food environment statistics rate ColumbusColumbus
Adult diabetes rate 9.5% 12.5%
Adult obesity rate 30.2% 30.6%
Low-income preschool obesity rate 13.3% 12.7%

Health Care

Both cities are served by several hospitals and healthcare facilities, but Ohio's Columbus offers more specialized services and is home to the nationally recognized Ohio State University Wexner Medical Center.

Fatal vehicle accidents per 100,000 residents
Type Total count per 100,000Drunk per 100,000Fatal count per 100,000Pedestrian count per 100,000Person count per 100,000Vehicle count per 100,000
Year ColumbusColumbusColumbusColumbusColumbusColumbusColumbusColumbusColumbusColumbusColumbusColumbus
2021 10.5 14.0 0.0 0.0 11.3 14.5 3.5 4.8 24.2 26.9 18.1 19.9
2020 9.6 10.8 2.9 1.6 10.0 10.8 2.8 5.4 20.4 23.7 15.5 17.8
2019 8.6 10.8 2.8 1.6 9.4 10.8 3.6 4.8 18.4 17.8 13.4 14.0
2018 7.5 9.7 2.5 2.2 8.2 11.3 2.2 2.7 16.4 20.5 11.4 14.0
2017 7.1 12.9 2.3 4.8 7.4 14.0 2.4 3.8 15.3 36.1 11.6 21.0
2016 7.0 14.0 3.2 3.2 7.0 14.5 2.5 3.2 15.3 35.0 11.2 21.5
2015 6.5 7.5 2.6 2.7 7.1 7.5 1.9 1.6 15.0 21.5 11.0 13.5
2014 6.0 9.2 2.5 1.6 6.3 9.2 2.2 1.6 12.4 18.8 10.3 16.7
2013 5.3 7.5 1.6 2.2 6.1 7.5 1.3 0.5 12.6 16.7 8.8 11.8
2012 6.9 9.7 2.8 2.7 7.9 10.8 2.1 3.2 16.5 20.5 11.6 15.1
2011 7.4 6.5 1.9 2.2 7.8 6.5 3.1 1.6 15.2 11.8 11.5 8.1
2010 6.6 7.0 2.2 1.1 6.9 7.0 1.8 1.1 15.9 17.2 11.4 12.4
2009 7.3 10.2 2.9 2.7 7.7 10.2 1.8 2.2 18.6 19.4 12.0 15.1
2008 8.6 10.2 3.6 3.2 9.2 10.8 2.9 1.1 25.5 30.7 14.9 19.4
2007 7.3 12.4 3.1 4.3 7.9 12.4 1.7 3.8 16.1 27.5 11.1 15.1
2006 6.3 14.0 2.6 5.4 6.7 14.5 1.3 2.7 16.0 35.0 11.4 22.6
2005 8.3 14.0 2.8 1.6 8.4 14.0 1.8 2.7 21.7 46.8 13.7 22.6
2004 7.7 7.0 1.9 0.0 8.3 8.1 1.5 1.1 19.3 16.7 12.1 10.8
2003 7.6 9.2 3.5 3.8 8.2 9.2 1.8 1.6 24.1 19.4 13.1 13.5
2002 7.7 9.2 2.6 2.2 8.5 10.8 1.2 1.1 17.7 24.2 11.4 14.0
2001 9.7 12.4 3.0 4.8 10.2 14.0 2.9 3.8 28.2 31.8 16.0 17.2
2000 6.5 9.2 1.5 2.2 6.5 9.7 1.4 1.6 16.4 24.8 10.0 16.1
1999 9.4 7.7 3.6 2.2 9.8 7.7 2.2 0.6 25.2 19.3 14.6 12.1
1998 7.6 11.0 2.2 1.1 8.8 11.5 2.1 4.9 22.7 26.9 12.5 13.7
1997 7.5 11.5 2.7 3.8 8.2 11.5 2.7 2.7 19.0 36.2 11.7 19.2
1996 7.4 11.5 2.9 2.2 7.5 11.5 1.7 1.7 22.3 34.1 11.8 19.2
1995 6.8 9.8 1.5 4.9 7.1 12.0 2.0 0.5 16.5 29.5 9.5 15.8
1994 5.0 9.7 1.4 0.5 5.2 10.2 2.1 2.2 11.7 23.1 7.3 16.7
1993 6.9 9.7 2.4 2.2 7.3 9.7 2.9 1.6 17.5 26.5 9.9 17.3
1992 5.5 13.0 0.3 5.4 5.7 14.6 1.5 4.9 13.5 30.2 8.6 18.4
1991 7.3 10.1 1.5 6.1 8.4 10.1 1.1 1.1 18.1 21.2 10.7 14.0
1990 5.3 8.9 1.4 3.9 5.3 8.9 0.0 0.0 12.1 15.1 7.2 11.7
1989 8.8 10.6 1.1 3.4 9.6 11.2 0.0 0.0 23.8 31.3 14.5 16.7
1988 10.0 12.8 4.8 2.2 11.6 12.8 0.0 0.0 23.7 41.3 14.9 22.3
1987 10.4 10.0 3.8 1.7 10.8 10.0 0.0 0.0 27.8 22.3 17.8 15.1
1986 8.9 11.7 5.4 5.0 9.2 12.8 0.0 0.0 19.8 26.2 12.2 16.7
1985 8.7 13.4 4.2 6.7 9.3 13.4 0.0 0.0 22.2 27.4 13.7 21.2
1984 11.5 10.6 4.9 5.0 12.2 11.7 0.0 0.0 27.2 23.4 17.1 14.0
1983 7.7 9.5 3.8 5.6 8.4 11.2 0.0 0.0 18.6 22.9 11.8 11.2
1982 10.7 10.0 4.1 3.4 11.2 10.6 0.0 0.0 25.6 24.6 15.2 14.5
1981 12.1 2.8 3.0 1.7 13.5 2.8 0.0 0.0 30.4 9.5 18.2 5.0
1980 13.6 0.0 3.2 0.0 14.7 0.0 0.0 0.0 30.8 0.0 19.1 0.0
1979 11.2 0.0 2.3 0.0 12.8 0.0 0.0 0.0 27.0 0.0 17.4 0.0
1978 10.2 0.0 2.9 0.0 11.4 0.0 0.0 0.0 24.8 0.0 14.3 0.0
1977 9.5 3.9 2.5 1.1 10.2 5.6 0.0 0.0 20.8 9.5 12.9 4.5
1976 8.3 13.4 0.0 0.0 9.4 15.1 0.0 0.0 21.3 30.1 11.9 16.7
1975 8.3 13.4 0.0 0.0 9.4 15.1 0.0 0.0 21.4 30.1 11.9 16.7

Fatal vehicle accidents
Type Total countDrunkFatal countPedestrian countPerson countVehicle count
Year ColumbusColumbusColumbusColumbusColumbusColumbusColumbusColumbusColumbusColumbusColumbusColumbus
1975 46 24 0 0 52 27 0 0 118 54 66 30
1976 46 24 0 0 52 27 0 0 118 54 66 30
1977 53 7 14 2 57 10 0 0 116 17 72 8
1978 57 0 16 0 64 0 0 0 139 0 80 0
1979 63 0 13 0 72 0 0 0 152 0 98 0
1980 77 0 18 0 83 0 0 0 174 0 108 0
1981 69 5 17 3 77 5 0 0 174 17 104 9
1982 62 18 24 6 65 19 0 0 148 44 88 26
1983 45 17 22 10 49 20 0 0 109 41 69 20
1984 68 19 29 9 72 21 0 0 161 42 101 25
1985 52 24 25 12 56 24 0 0 133 49 82 38
1986 54 21 33 9 56 23 0 0 120 47 74 30
1987 64 18 23 3 66 18 0 0 170 40 109 27
1988 62 23 30 4 72 23 0 0 147 74 92 40
1989 55 19 7 6 60 20 0 0 149 56 91 30
1990 34 16 9 7 34 16 0 0 77 27 46 21
1991 47 18 10 11 54 18 7 2 117 38 69 25
1992 36 24 2 10 37 27 10 9 88 56 56 34
1993 45 18 16 4 48 18 19 3 115 49 65 32
1994 33 18 9 1 34 19 14 4 77 43 48 31
1995 45 18 10 9 47 22 13 1 109 54 63 29
1996 49 21 19 4 50 21 11 3 148 62 78 35
1997 50 21 18 7 55 21 18 5 127 66 78 35
1998 51 20 15 2 59 21 14 9 152 49 84 25
1999 63 14 24 4 66 14 15 1 169 35 98 22
2000 46 17 11 4 46 18 10 3 117 46 71 30
2001 70 23 22 9 74 26 21 7 204 59 116 32
2002 56 17 19 4 62 20 9 2 129 45 83 26
2003 56 17 26 7 60 17 13 3 177 36 96 25
2004 57 13 14 0 61 15 11 2 142 31 89 20
2005 61 26 21 3 62 26 13 5 160 87 101 42
2006 47 26 19 10 50 27 10 5 119 65 85 42
2007 55 23 23 8 59 23 13 7 121 51 83 28
2008 65 19 27 6 70 20 22 2 194 57 113 36
2009 56 19 22 5 59 19 14 4 143 36 92 28
2010 52 13 17 2 54 13 14 2 125 32 90 23
2011 59 12 15 4 62 12 25 3 121 22 92 15
2012 56 18 23 5 64 20 17 6 134 38 94 28
2013 44 14 13 4 50 14 11 1 104 31 72 22
2014 50 17 21 3 53 17 18 3 104 35 86 31
2015 56 14 22 5 61 14 16 3 128 40 94 25
2016 61 26 28 6 61 27 22 6 133 65 97 40
2017 63 24 20 9 65 26 21 7 135 67 102 39
2018 67 18 22 4 73 21 20 5 146 38 102 26
2019 77 20 25 3 85 20 32 9 166 33 121 26
2020 87 20 26 3 91 20 25 10 185 44 140 33
2021 95 26 0 0 102 27 32 9 219 50 164 37
Police full-time law enforcement employees
Year ColumbusColumbus
2021 0 429
2020 2,277 487
2018 2,255 503
2017 1,937 0
2015 2,205 0
2014 2,203 559
2013 2,181 552
2012 2,138 568
2011 2,114 569
2010 0 582
2009 2,179 562
2008 0 495
2007 0 473
2006 2,178 452
2005 2,136 464
2004 0 470
2003 2,150 467
Police full-time law enforcement employees (per 1,000 residents)
Year ColumbusColumbus
2021 0.0 2.2
2020 2.5 2.5
2018 2.5 2.6
2017 2.2 0.0
2015 2.6 0.0
2014 2.7 2.7
2013 2.7 2.7
2012 2.7 2.9
2011 2.7 3.0
2010 0.0 3.1
2009 2.9 3.0
2008 0.0 2.7
2007 0.0 2.5
2006 3.0 2.4
2005 2.9 2.5
2004 0.0 2.5
2003 3.0 2.5
Local government: full-time employees
Job ColumbusColumbus
Correction 71 117
Financial administration 312 82
Firefighters 1,574 383
Fire - other 50 8
Health 431 34
Judicial and legal 453 214
Other and unallocable 408 371
Other government administration 571 55
Parks and recreation 326 134
Police - other 368 131
Police protection - officers 1,925 761
Sewerage 429 17
Solid waste management 199 101
Streets and highways 461 140
Totals for government 8,465 2,704
Transit 0 59
Water supply 412 16
Welfare 309 8
Local government: part-time employees
Job ColumbusColumbus
Correction 4 0
Financial administration 9 2
Fire - other 7 0
Health 45 17
Judicial and legal 32 33
Other and unallocable 33 0
Other government administration 33 5
Parks and recreation 398 241
Police - other 10 64
Police protection - officers 0 2
Sewerage 2 0
Solid waste management 0 10
Streets and highways 7 1
Totals for government 608 415
Transit 0 2
Water supply 11 0
Welfare 15 38
Mechanisms of homicide
Mechanism ColumbusColumbus
Homicides from 2000 to 2006 650 135
Cut / Pierce 68 22
Firearm 455 82
Mechanisms of homicide per 1,000,000 residents
Mechanism ColumbusColumbus
Homicides from 2000 to 2006 85.1 103.2
Cut / Pierce 8.9 16.8
Firearm 59.6 62.7
Mechanisms of suicide per 1,000,000 residents
Mechanism ColumbusColumbus
Suicides from 2000 to 2006 100.0 102.4
Fall 2.9 0
Firearm 47.6 68.8
Poisoning 19.6 0
Suffocation 24.0 0

Infrastructure

Columbus, OH boasts a robust infrastructure with a good mix of urban and suburban areas. Public facilities like parks, community centers, and libraries are plentiful. Columbus, GA also has good infrastructure, with beautiful natural and public spaces, but the development in Ohio is noticeably more extensive.
Infrastructure
Type Columbus Columbus
Hospitals 47 12
TV stations 14 10
Arenas or stadiums 3 1
Bank branches located here 200 50
Bank institutions located here 25 12
Main business address for public companies 23 5
Drinking water stations with no reported violations in the past 17 0
Drinking water stations with reported violations in the past 40 1

Schools

School facilities
Type Columbus Columbus
Private elementary/middle schools 34 7
Private high schools 12 6
Public elementary/middle schools 162 40
Public high schools 64 9
Colleges/Universities 37 8
HMDA - Conventional home purchase loans - Applications denied
Year ColumbusColumbus
1999 2,450 906
2000 2,376 767
2001 1,897 618
2002 1,483 304
2003 2,087 334
2004 3,216 431
2005 4,275 550
2006 4,662 565
2007 2,679 362
2008 1,015 132
2009 555 59

Culture and Food

Ohio's Columbus boasts a diverse cultural scene, with numerous festivals, music events, art galleries, and theaters. It also offers a vibrant food scene, with a variety of restaurants and food trucks. Georgia's Columbus has a rich historical character, with many museums, theaters, and a growing food scene.

Sports Teams

Sports enthusiasts will find a lot to cheer for in Columbus, OH which is home to the Ohio State Buckeyes, the Blue Jackets (NHL), and Columbus Crew (MLS). Columbus, GA doesn't have any major league sports teams, but it does host minor league baseball and hockey teams.