Overview
Charlotte, NC, and Worcester, MA, are two different cities offering different charm, lifestyle, and opportunities. Charlotte is larger and more bustling, characterized by a growing economy, a warm climate, and a rich sport culture. Worcester, the second-largest city in New England, is recognized for its dedication to healthcare, education, and defined seasonal weather. Here's a detailed comparison on various aspects for both relocators and tourists.
Distance between
Charlotte, NC and
Worcester, MA : 688.1 miles
Charlotte's population is larger by 327%. Its population has grown by 338,881 people (62.7%) since 2000. The population of Worcester has grown by 33,270 people (19.3%) during that time.
Charlotte recorded a higher crime rate than the national average, mainly due to property crimes. On the other hand, Worcester's crime rate is less than Charlotte, but still above the national average. Worcester focuses on community policing; however, for both cities, residing in safer neighborhoods is a common measure taken by residents.
Cost of Living
The cost of living in Charlotte is slightly lower than in Worcester, mainly because of lower housing costs. However, grocery and healthcare costs are similar in both cities.
Income Tax
North Carolina has a flat state income tax rate of 5.25%, while Massachusetts has a state income tax of 5%.
Property Tax
Worcester's property tax rates are generally higher than Charlotte's. The city of Worcester's property tax is above 2%, while in Charlotte, it's just above 1%.
Sales Tax
North Carolina has a 4.75% state sales tax, while Massachusetts has a state sales tax of 6.25%. Both Charlotte and Worcester do not charge additional city sales tax.
Income
Type
Charlotte
Worcester
Estimated median household income
$70,869
$63,194
Estimated per capita income
$44,593
$32,772
Cost of living index (U.S. average is 100)
93.2
128.3
If you make $50,000 in Charlotte, you will have to make $68,830 in Worcester to maintain the same standard of living.
Geographical Conditions
Charlotte is located near the Catawba River, known for its beautiful lake system. Worcester, being located in central Massachusetts, features hills and lakes, offering numerous outdoor activities.
Both Charlotte and Worcester have numerous options for education. In Charlotte, there is the University of North Carolina at Charlotte and Central Piedmont Community College. Worcester is home to nine institutions of higher learning, including Worcester Polytechnic Institute and Clark University.
Charlotte has a robust economy with strong banking, automotive, and energy sectors. Worcester's economy is based mainly on education and healthcare. Both cities have seen consistent job growth over the past decade.
Biggest Employers
In Charlotte, the biggest employers include Bank of America, Carolinas HealthCare System, and Wells Fargo. Worcester’s largest employers are UMass Memorial Health Care, University of Massachusetts Medical School, and Hanover Insurance.
In Charlotte (Mecklenburg County), 60.8% voted for Democrats and 38.3% for Republicans in 2012 Presidential Election. In Worcester (Worcester County), 53.7% voted for Democrats and 44.3% for Republicans.
Elections
Type
Democrats
Republicans
Other
Year
Charlotte
Worcester
Charlotte
Worcester
Charlotte
Worcester
2020
66.8%
57.6%
31.6%
39.7%
1.6%
2.7%
2016
62.3%
51.0%
32.9%
40.5%
4.8%
8.5%
2012
60.8%
53.7%
38.3%
44.3%
0.9%
2.0%
2008
62.0%
55.8%
37.6%
42.0%
0.5%
2.2%
2004
51.7%
56.6%
48.0%
42.5%
0.3%
0.9%
2000
48.4%
56.2%
51.1%
36.9%
0.5%
6.9%
1996
48.6%
58.3%
45.9%
29.8%
5.5%
11.9%
Breakdown of population affiliated with a religious congregation
Type
Adherents
Congregations
Religion
Charlotte
Worcester
Charlotte
Worcester
SOUTHERN BAPTIST CONVENTION
9.0%
0.2%
19.0%
3.3%
CATHOLIC CHURCH
8.5%
38.4%
1.8%
20.1%
AMERICAN BAPTIST CHURCHES IN THE USA
2.3%
0.7%
1.1%
4.6%
EPISCOPAL CHURCH
1.2%
1.2%
1.3%
4.8%
EVANGELICAL LUTHERAN CHURCH IN AMERICA
0.9%
0.8%
1.8%
2.2%
PRESBYTERIAN CHURCH IN AMERICA
0.6%
0.0%
1.9%
0.0%
SEVENTH DAY ADVENTIST CHURCH
0.5%
0.8%
1.5%
4.6%
MUSLIM ESTIMATE
0.3%
0.1%
1.2%
0.3%
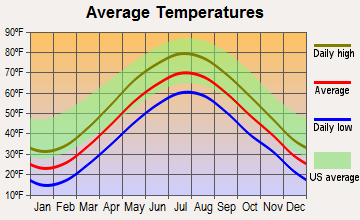
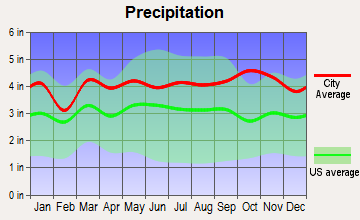
Weather
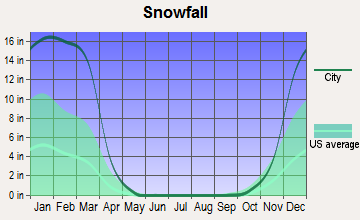
Charlotte experiences a pleasant subtropical climate, with mild winters and warm, humid summers. In contrast, Worcester has a humid continental climate with cold, snowy winters and warm summers. It gets significantly more snow than Charlotte, which might appeal to those who enjoy winter sports.
Weather and climate
Type
Charlotte
Worcester
Temperature - Average
61°F
47.1°F
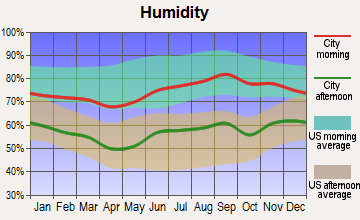
Humidity - Average morning or afternoon humidity
72.3%
71.5%
Humidity - Differences between morning and afternoon humidity
41%
32%
Humidity - Maximum monthly morning or afternoon humidity
87%
81%
Humidity - Minimum monthly morning or afternoon humidity
46%
49.1%
Precipitation - Yearly average
44.5 in
48.9 in
Snowfall - Yearly average
10.2 in
133.4 in
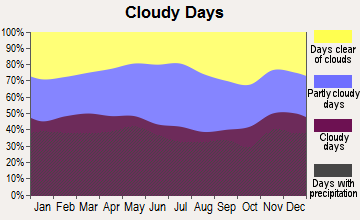
Clouds - Number of days clear of clouds
18.1%
15.2%
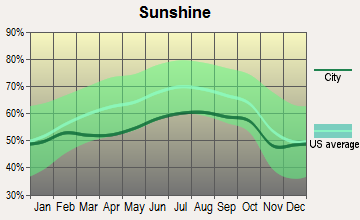
Sunshine amount - Average
69.8%
63%
Sunshine amount - Differences during a year
14%
18.5%
Sunshine amount - Maximum monthly
70%
66.3%
Sunshine amount - Minimum monthly
56%
47.8%
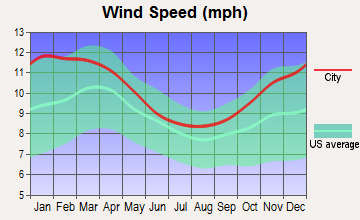
Wind speed - Average
6.9 mph
11 mph
Average climate in Charlotte, North Carolina
Average climate in Worcester, Massachusetts
Air pollution
Type
AQI
CO
NO2
OZONE
PB
PM10
PM25
SO2
Year
Charlotte
Worcester
Charlotte
Worcester
Charlotte
Worcester
Charlotte
Worcester
Charlotte
Charlotte
Charlotte
Worcester
Charlotte
Worcester
2018
75
71
0.24
0.28
6.3
11.2
27.8
31.5
N/A
N/A
15.5
N/A
8.2
6.8
0.2
0.6
2017
77
69
0.25
0.28
7.0
11.5
28.0
32.3
N/A
N/A
16.3
N/A
8.8
5.5
0.2
0.8
2016
82
73
0.25
0.25
7.6
12.2
28.7
33.6
N/A
N/A
N/A
N/A
8.4
6.2
0.2
0.7
2015
76
68
0.25
0.26
8.1
13.4
27.6
32.6
N/A
N/A
N/A
N/A
8.6
7.0
0.2
0.5
2014
76
71
0.26
0.32
8.5
13.1
26.3
33.2
N/A
N/A
N/A
N/A
9.3
7.7
0.3
1.5
2013
71
82
0.29
0.39
8.4
11.8
25.5
34.5
N/A
N/A
N/A
N/A
8.6
8.3
0.3
2.7
2012
95
84
0.28
0.51
8.7
12.8
27.3
37.5
N/A
N/A
N/A
N/A
9.7
7.7
0.3
3.2
2011
94
82
0.34
0.46
10.1
17.4
28.9
34.8
N/A
N/A
N/A
N/A
11.2
9.8
0.6
2.7
2010
97
88
0.33
0.50
11.8
13.9
28.0
37.4
N/A
N/A
N/A
N/A
11.6
9.9
1.0
2.1
2009
82
85
0.30
0.53
10.0
14.4
25.4
N/A
N/A
N/A
N/A
N/A
11.1
8.3
0.9
1.1
2008
102
94
0.32
0.54
11.2
14.9
27.6
38.5
N/A
N/A
N/A
N/A
13.0
8.0
2.1
2.6
2007
108
115
0.37
0.52
13.9
15.7
29.1
N/A
0.001
N/A
N/A
N/A
14.5
9.0
3.0
3.4
2006
107
98
0.44
0.53
13.9
15.2
27.3
38.7
0.000
N/A
N/A
N/A
14.8
8.8
3.3
2.8
2005
109
101
0.53
0.55
14.6
14.9
30.6
N/A
0.000
N/A
N/A
N/A
15.2
10.0
2.7
4.6
2004
89
92
0.53
0.41
14.6
15.8
28.9
N/A
0.001
N/A
N/A
N/A
N/A
11.6
2.8
2.6
2003
85
82
0.57
0.51
15.6
15.6
27.6
N/A
0.003
N/A
N/A
N/A
N/A
N/A
3.0
N/A
2002
103
87
0.63
0.52
15.3
17.4
32.6
39.0
0.003
N/A
N/A
N/A
N/A
N/A
2.7
N/A
2001
108
98
0.72
0.57
17.5
20.0
32.3
32.6
0.005
N/A
N/A
N/A
N/A
N/A
3.9
N/A
2000
107
76
0.79
0.52
18.0
18.6
32.6
31.2
0.014
N/A
N/A
N/A
N/A
N/A
4.4
N/A
Natural disasters
Type
Charlotte
Worcester
Tornado activity compared to U.S. average
111.5%
79.8%
Earthquake activity compared to U.S. average
79%
28.4%
Natural disasters compared to U.S. average
9%
27%
Transportation
Charlotte offers various means of public transportation, including buses, light rail, and trolleys. Worcester also has buses and trains, with trains offering convenient access to Boston.
Transport
Type
Charlotte
Worcester
Amtrak stations
1
0
Amtrak stations nearby
2
2
FAA registered aircraft
439
21
FAA registered aircraft manufacturers and dealers
12
9
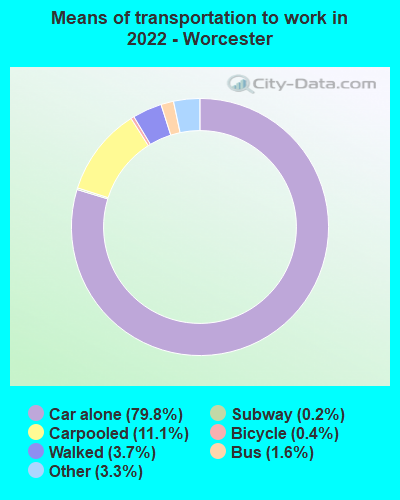
Means of transportation to work
Type
Charlotte
Worcester
Bicycle
0.1%
0.4%
Bus
1.2%
1.3%
Carpooled
8.7%
9.8%
Car alone
86.2%
81.3%
Railroad
0.4%
0.4%
Taxicab
0.2%
0.4%
Walked
1.5%
4.6%
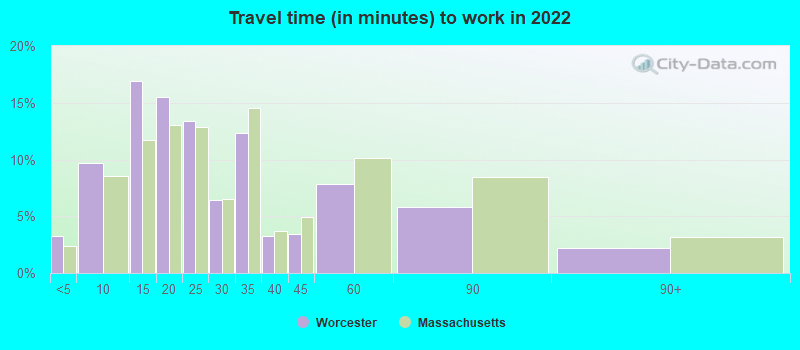
Average travel time to work
Type
Charlotte
Worcester
Average
29.6 min
26.5 min
Other means
24.9 min
23.3 min
Public transportation
44.1 min
34 min
Private vehicle occupancy
Type
Charlotte
Worcester
Average
1.2
1.2
Drove alone
90%
85.3%
In 2 person carpool
6.9%
11.9%
In 3 person carpool
1.8%
1.6%
In 4 person carpool
0.8%
0.6%
In 5-6 person carpool
0.5%
0.3%
In 7+ person carpool
0.1%
0.2%
How many people usually rode to work in the car, truck or van.
Real Estate
The real estate market in Charlotte is hot, with house prices rising because of the city's rapid growth. Worcester also sees steady price appreciation, but its growth is slightly slower than Charlotte's.
Neighborhoods
Charlotte is divided into neighborhoods, each with its unique character. Dilworth and Myers Park are popular for their historic charm. Worcester, with neighborhoods like Shrewsbury Street and Canal District, provide a blend of old-town charm and revitalization efforts.
Houses and residents
Type
Charlotte
Worcester
Houses
393,631
82,375
Average household size (people)
2.5
2.5
Median year apartment built
1998
1960
Median year house/condo built
1993
1952
Length of stay in the house since moving in
11.8 years
15.8 years
Houses occupied
365,269 (92.8%)
76,065 (92.3%)
Houses occupied by owners
193,930 (53.1%)
32,714 (43%)
Houses occupied by renters
171,339 (46.9%)
43,351 (57%)
Median rent asked for vacant for-rent units
$1,482
$1,034
Median monthly housing costs
$1,302
$1,314
Median price asked for vacant for-sale houses and condos
$445,491
$425,443
Estimated median house or condo value
$321,400
$317,800
Median numbers of rooms
5.3
5.1
Median number of rooms in apartments
4
4.3
Median number of rooms in houses and condos
6.6
6.1
Median house price - detached houses
$388,029
$338,239
Median house price - in 2-unit structures
$184,325
$252,487
Median house price - in 3-to-4-unit structures
$178,624
$352,758
Median house price - in 5 or more unit structures
$433,957
$213,457
Median house price - Townhouses or other attached units
$296,370
$290,622
Median house price - All housing units
$378,423
$317,463
Median house age
26
67
Renting percentage
42.6%
55.5%
Housing density (houses/condos per square mile)
1,624.8
2,193.1
House value disparities
33.3%
25.3%
Household income disparities
44.1%
46.9%
Median household income for houses/condes with a mortgage
$105,905
$102,992
Median household income for apartments without a mortgage
$70,681
$78,632
Housing units without a mortgage
3,089 (2.1%)
687 (3%)
Housing units with both a second mortgage and home equity loan
10,553 (7.2%)
2,013 (8.8%)
Housing units with a mortgage
142,912 (97.9%)
22,130 (97%)
Housing units with a home equity loan
171 (0.1%)
289 (1.3%)
Housing units with a second mortgage
13,532 (9.3%)
2,828 (12.4%)
House/condo owner moved in on average (years ago)
9
15
House/condo renter moved in on average (years ago)
1
3
Housing units lacking complete kitchen facilities
0.8%
1.6%
Housing units lacking complete plumbing facilities
0.2%
1.1%
Housing units in structures
Housing units in structures
Charlotte
Worcester
One, detached
52.7%
32.1%
One, attached
9.1%
6.4%
Two
0.9%
7.9%
3 or 4
2.9%
25.1%
5 to 9
7.1%
8.6%
10 to 19
9.5%
5.4%
20 to 49
6.2%
4.4%
50 or more
10.3%
10.0%
Mobile homes
1.4%
0.1%
Median real estate property taxes paid for housing units
Self-employed workers in own not incorporated business
25,780
5,036
State government workers
16,519
5,706
Unpaid family workers
1,214
42
Industries and Occupations
Banking and automotive industries are strong in Charlotte, with Bank of America and Wells Fargo dominating the job market. Worcester has significant diversity in occupations, but education, healthcare, and biotechnology sectors are the most prominent.
Charlotte is home to some of the country's top hospitals, including Carolinas Medical Center and Novant Health. Worcester hosts world-class healthcare facilities like UMass Memorial Medical Center.
Health (county statistics)
Type
Charlotte
Worcester
General health status score of residents in this county from 1 (poor) to 5 (excellent)
Charlotte has seen extensive growth and has up-to-date infrastructure, including roads, electronic infrastructure, and public utilities. Worcester, being an older city, has well-established, but sometimes dated, infrastructure.
Infrastructure
Type
Charlotte
Worcester
Hospitals
37
14
TV stations
16
24
Arenas or stadiums
3
2
Bank branches located here
202
47
Bank institutions located here
26
12
Main business address for public companies
33
2
Nuclear power plants nearby
2
0
Drinking water stations with no reported violations in the past
24
0
Drinking water stations with reported violations in the past
HMDA - Conventional home purchase loans - Applications denied
Year
Charlotte
Worcester
1999
3,049
262
2000
1,568
328
2001
1,382
237
2002
1,275
312
2003
1,879
469
2004
2,415
822
2005
3,078
1,210
2006
3,864
1,134
2007
3,106
721
2008
1,287
375
2009
617
274
Culture and Food
Charlotte is known for its Southern hospitality and food, especially barbecued pork. Worcester also offers great food scenes with an emphasis on farm-to-table dining, and the city is renowned for its diners.
Sports Teams
One of the biggest attractions of Charlotte is its sports scene, with the Charlotte Hornets (NBA) and the Carolina Panthers (NFL). Worcester is not home to any major league teams, but sports enthusiasts can enjoy minor league and college sports action.


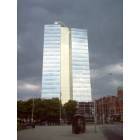
 Charlotte, NC
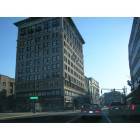
 Worcester, MA