Charlotte, NC vs Providence, RI - Advanced U.S. city comparison tool

Charlotte, NC vs Providence, RI

Charlotte, North Carolina and Providence, Rhode Island are two distinct U.S cities that offer unique lifestyles, cultures, and opportunities. Both cities have unique charms and features that are attractive to potential residents and tourists. The quality of life in each city can be compared in terms of crime and safety, weather, cost of living, education, work and economy, infrastructure, industries and occupations, biggest employers, real estate, and many more. This comprehensive comparison will provide a detailed look into what makes each city unique and how they differ.
 
 
Distance between Charlotte, NC and Providence, RI : 683.0 miles

Charlotte's population is larger by 364%. Its population has grown by 338,881 people (62.7%) since 2000. The population of Providence has grown by 16,074 people (9.3%) during that time.

Population
Type Charlotte Providence
Population 879,709 189,692
Female / male percentage 51.8% / 48.2%
51.8%
48.2%
50.5% / 49.5%
50.5%
49.5%
Racial makeup - percentage
Ethnicity CharlotteProvidence
White Non-Hispanic 39.6% 32.9%
Black 34.4% 9.7%
Hispanic 14.8% 44.6%
Asian 6.5% 6.8%
Two or more 4.1% 4.1%
American Indian 0.1% 0.7%
Racial makeup - absolute values
Ethnicity CharlotteProvidence
White Non-Hispanic 348,655 62,332
Black 302,251 18,307
Hispanic 130,550 84,570
Asian 57,386 12,920
Two or more 35,858 7,818
American Indian 859 1,302
Pacific Islander 97 103

Crime and Safety

Charlotte experiences a significantly higher crime rate than Providence. However, it is worth noting that safety levels can vary from neighborhood to neighborhood, so some areas are safer than others. In Providence, the crime rates are lower, making it generally a safer city compared to Charlotte.

Cost of Living

The cost of living is generally lower in Charlotte than in Providence. The housing cost, in particular, stands out as the biggest factor in the cost of living difference. Groceries, health care, and utilities are also generally more affordable in Charlotte than in Providence.

Income Tax

In terms of income tax, North Carolina has a flat rate of 5.25%, which is lower than Rhode Island’s progressive tax rate that ranges from 3.75% to 5.99%.

Property Tax

Property tax rates in Providence are significantly higher than in Charlotte. Property owners in Providence can expect to pay in the range of 3.7% whereas in Charlotte, the average property tax rate is around 1.31%.

Sales Tax

The sales tax in Charlotte is lower than in Providence, leading to overall lower costs of goods and services. The combined city and state sales tax rate in Charlotte is 7.25% while in Providence it is 7%.
Income
Type Charlotte Providence
Estimated median household income $70,869 $60,970
Estimated per capita income $44,593 $32,495
Cost of living index (U.S. average is 100) 93.2 93.9

If you make $50,000 in Charlotte, you will have to make $50,376 in Providence to maintain the same standard of living.

Geographical Conditions

Charlotte is located in the Piedmont region of North Carolina, characterized by gentle hills and large, sprawling suburbs. Providence is coastal, offering easy access to the ocean and nearby beautiful beaches.
Geographical information
Type Charlotte Providence
Land area 242.3 sq. miles 18.5 sq. miles
Population density 3,631.1 people per sq. mile 10,272 people per sq. mile
Elevation 850 feet 115 feet
Relative area comparison
Charlotte, NC Providence, RI
First ancestry reported - percentage
Ancestry CharlotteProvidence
English 3.7% 1.1%
German 3.0% 1.0%
Irish 2.9% 3.9%
Italian 1.7% 4.7%
Scotch-Irish 1.6% 0.0%
Scottish 0.8% 0.2%
Polish 0.6% 0.4%
Greek 0.5% 0.1%
French 0.3% 1.1%
Russian 0.3% 0.5%
Ukrainian 0.3% 0.2%
Arab 0.2% 0.0%
Dutch 0.2% 0.1%
French Canadian 0.2% 0.5%
Portuguese 0.1% 2.2%
Population origin - absolute values
Ancestry CharlotteProvidence
English 20,052 1,341
German 16,343 1,176
Irish 15,520 4,720
Italian 8,985 5,729
Scotch-Irish 8,506 54
Scottish 4,501 264
Polish 3,219 462
Greek 2,536 150
Ukrainian 1,653 283
French 1,472 1,335
Russian 1,444 558
Arab 1,236 44
Dutch 1,206 72
Welsh 981 92
French Canadian 932 650
Norwegian 871 71
West Indian 869 173
Swedish 698 151
Portuguese 611 2,612
Hungarian 589 86
Foreign born residents - absolute values
Type Count
Region CharlotteProvidence
All 153,766 58,442
Africa 18,825 5,938
Asia 46,818 7,211
Europe 11,896 4,679
Latin America 72,576 39,505
North America 2,117 664
Oceania 216 29
Foreign born residents - percentage
Type Percentage
Region CharlotteProvidence
All 17.4% 30.9%
Africa 2.1% 3.1%
Asia 5.3% 3.8%
Europe 1.3% 2.5%
Latin America 8.2% 20.9%
North America 0.2% 0.4%

Education

Providence is home to prestigious institutions such as Brown University and the Rhode Island School of Design. Charlotte also has strong educational institutions, including the University of North Carolina at Charlotte, but doesn’t have the same level of national recognition in education as Providence.
School enrollment
Type Charlotte Providence
Nursery, preschool 10,625 (5.1%) 1,616 (2.8%)
Kindergarten 11,309 (5.4%) 1,208 (2.1%)
Grade 1 to 4 44,753 (21.5%) 9,007 (15.5%)
Grade 5 to 8 40,086 (19.2%) 11,556 (19.9%)
Grade 9 to 12 44,565 (21.4%) 8,354 (14.4%)
College undergrad 42,468 (20.4%) 20,845 (35.8%)
Graduate or professional 14,664 (7%) 5,572 (9.6%)
Students in private schools - absolute values
Type Count
Grade CharlotteProvidence
Grades 1 to 8 (elementary and middle school) 14,078 2,916
Grades 9 to 12 (high school) 4,801 1,243
Undergraduate colleges 7,904 14,621
Students in private schools - percentage
Type Percentage
Grade CharlotteProvidence
Grades 1 to 8 (elementary and middle school) 16.6% 14.2%
Grades 9 to 12 (high school) 10.8% 14.9%
Undergraduate colleges 18.6% 70.1%
Educational attainment
Type Charlotte Providence
Less than high school 9.9% 19.3%
High school or equiv. 16.9% 26.5%
Less than 1 year of college 4.3% 3.6%
1 or more years of college 13% 11.3%
Associate degree 7.1% 5.5%
Bachelor's degree 31.1% 17.2%
Master's degree 13.5% 10.2%
Profess. school degree 3% 3.2%
Doctorate degree 1.3% 3.3%
Education level (25-year-olds and older)
Type Charlotte Providence
Bachelor's degree or higher 48.8% 33.9%
Graduate or professional degree 17.8% 16.7%
High school or higher 90.1% 80.7%

Work and Economy

Charlotte’s economy thrives on the banking and financial industry, with several Fortune 500 company headquarters. Providence, though smaller, has a diverse economy with key sectors in education, healthcare, and manufacturing.

Biggest Employers

Charlotte is home to several Fortune 500 companies, such as Bank of America and Duke Energy. By contrast, Providence’s largest employers are in the healthcare and education sectors, including Lifespan Hospital Group and Brown University.
Employment and residency - absolute values
Kind CharlotteProvidence
Work and live in this city 230,558 33,938
Work and live in this county 422,392 71,807
Workers who work outside the city they live in 310,270 139,680
Workers who work outside the county they live in 47,321 16,543
Working at home 162,470 17,249
Not working at home 307,243 71,101
Daytime population change due to commuting 114,655 43,446
Employment and residency - percentage
Kind CharlotteProvidence
Work and live in this city 82.2% 50.5%
Work and live in this county 89.9% 81.3%
Workers who work outside the city they live in 17.8% 49.5%
Workers who work outside the county they live in 10.1% 18.7%
Working at home 34.6% 19.5%
Not working at home 65.4% 80.5%
Daytime population change due to commuting 21.2% 25.0%
Geographical mobility: all
Type all
Mobility CharlotteProvidence
Same house 1 year ago 82.2% 85.4%
Moved from abroad 0.9% 0.9%
Moved within same county 10.3% 7.1%
Moved from different state 4.1% 5.7%
Moved within same state 2.5% 0.8%
Geographical mobility: Asian
Type Asian
Mobility CharlotteProvidence
Same house 1 year ago 81.2% 81.1%
Moved from abroad 1.8% 4.3%
Moved within same county 10.3% 7.2%
Moved from different state 4.3% 7.3%
Moved within same state 2.4% 0%
Geographical mobility: Black
Type Black
Mobility CharlotteProvidence
Same house 1 year ago 84.5% 84.6%
Moved from abroad 0.4% 1.4%
Moved within same county 9.4% 9.2%
Moved from different state 3.2% 4.8%
Moved within same state 2.5% 0%
Geographical mobility: White
Type White
Mobility CharlotteProvidence
Same house 1 year ago 82.2% 80.0%
Moved from abroad 0.2% 0.4%
Moved within same county 9.6% 7.2%
Moved from different state 4.9% 10.9%
Moved within same state 3.1% 1.5%

In Charlotte (Mecklenburg County), 60.8% voted for Democrats and 38.3% for Republicans in 2012 Presidential Election. In Providence (Providence County), 66.7% voted for Democrats and 31.7% for Republicans.

Elections
Type DemocratsRepublicansOther
Year CharlotteProvidenceCharlotteProvidenceCharlotteProvidence
2020 66.8% 60.8% 31.6% 37.8% 1.6% 1.3%
2016 62.3% 57.5% 32.9% 36.6% 4.8% 5.9%
2012 60.8% 66.7% 38.3% 31.7% 0.9% 1.7%
2008 62.0% 66.2% 37.6% 32.0% 0.5% 1.7%
2004 51.7% 62.9% 48.0% 35.8% 0.3% 1.3%
2000 48.4% 65.5% 51.1% 28.2% 0.5% 6.3%
1996 48.6% 63.6% 45.9% 23.5% 5.5% 12.9%
Breakdown of population affiliated with a religious congregation
Type AdherentsCongregations
Religion CharlotteProvidenceCharlotteProvidence
SOUTHERN BAPTIST CONVENTION 9.0% 0.0% 19.0% 1.7%
CATHOLIC CHURCH 8.5% 44.0% 1.8% 23.4%
AMERICAN BAPTIST CHURCHES IN THE USA 2.3% 1.5% 1.1% 10.7%
EPISCOPAL CHURCH 1.2% 1.4% 1.3% 6.3%
EVANGELICAL LUTHERAN CHURCH IN AMERICA 0.9% 0.2% 1.8% 1.2%
PRESBYTERIAN CHURCH IN AMERICA 0.6% 0.0% 1.9% 0.2%
SEVENTH DAY ADVENTIST CHURCH 0.5% 0.3% 1.5% 3.9%
MUSLIM ESTIMATE 0.3% 0.2% 1.2% 1.2%

Weather

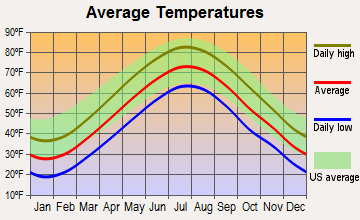
Weather-wise, Charlotte is warmer, with a humid subtropical climate characterized by hot, humid summers and mild winters. Providence, on the other hand, witnesses four distinct seasons, with cold winters and hot, humid summers.
Weather and climate
Type Charlotte Providence
Temperature - Average 61°F 50.7°F
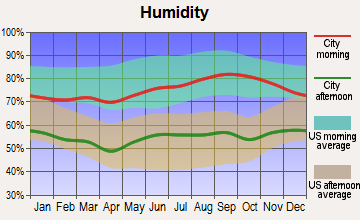
Humidity - Average morning or afternoon humidity 72.3% 70.3%
Humidity - Differences between morning and afternoon humidity 41% 33%
Humidity - Maximum monthly morning or afternoon humidity 87% 82%
Humidity - Minimum monthly morning or afternoon humidity 46% 49%
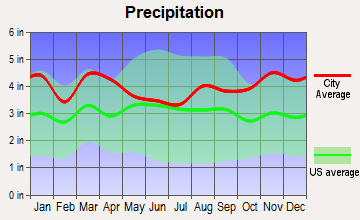
Precipitation - Yearly average 44.5 in 47.7 in
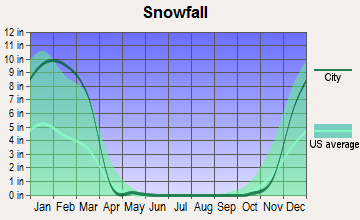
Snowfall - Yearly average 10.2 in 72.7 in
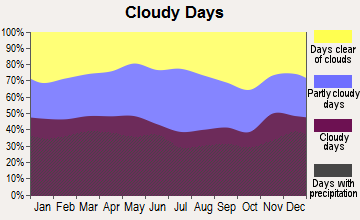
Clouds - Number of days clear of clouds 18.1% 16.2%
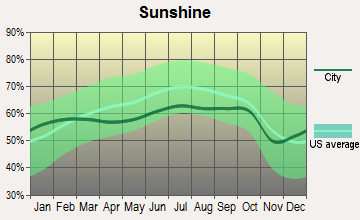
Sunshine amount - Average 69.8% 62%
Sunshine amount - Differences during a year 14% 16%
Sunshine amount - Maximum monthly 70% 64%
Sunshine amount - Minimum monthly 56% 48%
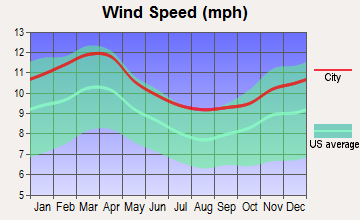
Wind speed - Average 6.9 mph 10 mph

Average climate in Charlotte, North Carolina

Chicago, Illinois average temperatures Chicago, Illinois average precipitation Chicago, Illinois humidity Chicago, Illinois wind speed Chicago, Illinois snowfall Chicago, Illinois sunshine Chicago, Illinois clear and cloudy days
 

Average climate in Providence, Rhode Island

Chicago, Illinois average temperatures Chicago, Illinois average precipitation Chicago, Illinois humidity Chicago, Illinois wind speed Chicago, Illinois snowfall Chicago, Illinois sunshine Chicago, Illinois clear and cloudy days
 

Air pollution
Type AQICONO2OZONEPBPM10PM25SO2
Year CharlotteProvidenceCharlotteProvidenceCharlotteProvidenceCharlotteProvidenceCharlotteProvidenceCharlotte CharlotteProvidenceCharlotteProvidence
2018 75 77 0.24 0.20 6.3 N/A 27.8 31.1 N/A N/A 15.5 N/A 8.2 7.1 0.2 0.3
2017 77 75 0.25 0.21 7.0 8.8 28.0 30.6 N/A N/A 16.3 N/A 8.8 6.3 0.2 0.2
2016 82 82 0.25 0.21 7.6 9.2 28.7 30.0 N/A N/A N/A N/A 8.4 7.5 0.2 0.3
2015 76 86 0.25 0.23 8.1 10.6 27.6 29.3 N/A N/A N/A N/A 8.6 7.9 0.2 0.4
2014 76 74 0.26 0.23 8.5 10.5 26.3 28.9 N/A N/A N/A N/A 9.3 6.0 0.3 0.6
2013 71 97 0.29 0.22 8.4 10.3 25.5 30.9 N/A N/A N/A N/A 8.6 9.7 0.3 0.5
2012 95 94 0.28 0.23 8.7 10.1 27.3 32.6 N/A N/A N/A N/A 9.7 8.2 0.3 1.4
2011 94 86 0.34 0.23 10.1 11.4 28.9 31.0 N/A N/A N/A N/A 11.2 8.7 0.6 1.3
2010 97 79 0.33 0.20 11.8 9.8 28.0 31.0 N/A N/A N/A N/A 11.6 6.3 1.0 1.4
2009 82 75 0.30 0.24 10.0 11.2 25.4 N/A N/A N/A N/A N/A 11.1 5.8 0.9 1.8
2008 102 73 0.32 0.24 11.2 12.3 27.6 N/A N/A N/A N/A N/A 13.0 N/A 2.1 2.1
2007 108 86 0.37 0.25 13.9 13.9 29.1 N/A 0.001 N/A N/A N/A 14.5 N/A 3.0 4.1
2006 107 81 0.44 0.40 13.9 15.2 27.3 N/A 0.000 N/A N/A N/A 14.8 N/A 3.3 4.6
2005 109 91 0.53 0.40 14.6 17.4 30.6 N/A 0.000 N/A N/A N/A 15.2 N/A 2.7 5.8
2004 89 83 0.53 0.46 14.6 17.7 28.9 N/A 0.001 N/A N/A N/A N/A N/A 2.8 6.8
2003 85 86 0.57 0.54 15.6 18.9 27.6 N/A 0.003 N/A N/A N/A N/A N/A 3.0 6.3
2002 103 101 0.63 0.61 15.3 18.3 32.6 N/A 0.003 N/A N/A N/A N/A N/A 2.7 6.1
2001 108 109 0.72 0.53 17.5 20.2 32.3 N/A 0.005 0.019 N/A N/A N/A N/A 3.9 7.5
2000 107 91 0.79 0.51 18.0 20.1 32.6 N/A 0.014 N/A N/A N/A N/A N/A 4.4 6.7
Natural disasters
Type Charlotte Providence
Tornado activity compared to U.S. average 111.5% 52%
Earthquake activity compared to U.S. average 79% 26.6%
Natural disasters compared to U.S. average 9% 17%

Transportation

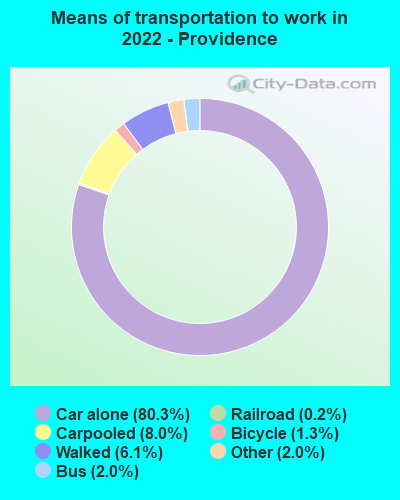
Both cities have well-operated public transportation systems, but you may find the need for a car more in Charlotte due to its size. Providence is more walkable due to its smaller size and less sprawled setup.
Transport
Type Charlotte Providence
Amtrak stations 1 1
Amtrak stations nearby 2 1
FAA registered aircraft 439 48
FAA registered aircraft manufacturers and dealers 12 1
Means of transportation to work
Type Charlotte Providence
Bicycle 0.1% 0.3%
Bus 1.2% 3.2%
Carpooled 8.7% 10.4%
Car alone 86.2% 78.2%
Railroad 0.4% 1%
Subway 0% 0.5%
Taxicab 0.2% 0.2%
Walked 1.5% 5.2%
Means of transportation to work
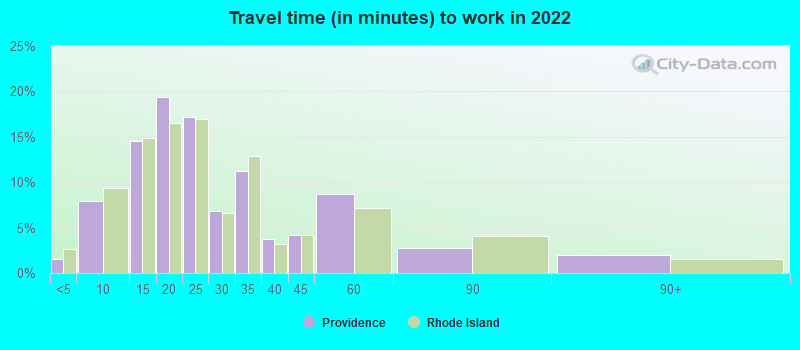
Average travel time to work
Type Charlotte Providence
Average 29.6 min 24.7 min
Other means 24.9 min 20.9 min
Public transportation 44.1 min 36.9 min
Travel time to work
Time leaving to work
Travel time to work
Time leaving to work
Private vehicle occupancy
Type Charlotte Providence
Average 1.2 1.2
Drove alone 90% 83.5%
In 2 person carpool 6.9% 13.1%
In 3 person carpool 1.8% 1.7%
In 4 person carpool 0.8% 0.7%
In 5-6 person carpool 0.5% 0.7%
In 7+ person carpool 0.1% 0.3%

How many people usually rode to work in the car, truck or van.

Real Estate

Real estate in Charlotte is more affordable compared to Providence. While both cities offer a variety of urban and suburban lifestyles, Charlotte tends to offer more value for money in terms of house size and lot size.

Neighborhoods

Charlotte's neighborhoods are significantly larger in size and more diverse in terms of demographics, making it ideal for families of all sizes and ages. Providence, although smaller, has a charm of its own with leafy, historic neighborhoods that are ideal for single professionals and young families.
Houses and residents
Type Charlotte Providence
Houses 393,631 78,329
Average household size (people) 2.5 2.6
Length of stay in the house since moving in 11.8 years 12 years
Houses occupied 365,269 (92.8%) 68,179 (87%)
Houses occupied by owners 193,930 (53.1%) 27,713 (40.6%)
Houses occupied by renters 171,339 (46.9%) 40,466 (59.4%)
Median rent asked for vacant for-rent units $1,482 $1,281
Median monthly housing costs $1,302 $1,343
Median price asked for vacant for-sale houses and condos $445,491 $266,596
Estimated median house or condo value $321,400 $291,200
Median numbers of rooms 5.3 4.7
Median number of rooms in apartments 4 4.3
Median number of rooms in houses and condos 6.6 5.7
Median house price - detached houses $388,029 $434,470
Median house price - in 2-unit structures $184,325 $305,545
Median house price - in 3-to-4-unit structures $178,624 $338,565
Median house price - in 5 or more unit structures $433,957 $296,317
Median house price - Townhouses or other attached units $296,370 $326,633
Median house price - All housing units $378,423 $379,757
Median house age 26 2,021
Renting percentage 42.6% 65.1%
Housing density (houses/condos per square mile) 1,624.8 4,241.6
House value disparities 33.3% 33.7%
Household income disparities 44.1% 48.7%
Median household income for houses/condes with a mortgage $105,905 $98,451
Median household income for apartments without a mortgage $70,681 $73,826
Housing units without a mortgage 3,089 (2.1%) 555 (2.7%)
Housing units with both a second mortgage and home equity loan 10,553 (7.2%) 2,250 (10.7%)
Housing units with a mortgage 142,912 (97.9%) 20,388 (97.3%)
Housing units with a home equity loan 171 (0.1%) 88 (0.4%)
Housing units with a second mortgage 13,532 (9.3%) 2,692 (12.9%)
House/condo owner moved in on average (years ago) 9 8
House/condo renter moved in on average (years ago) 1 3
Housing units lacking complete kitchen facilities 0.8% 2.7%
Housing units lacking complete plumbing facilities 0.2% 0.6%
Housing units in structures
Housing units in structures CharlotteProvidence
One, detached 52.7% 24.2%
One, attached 9.1% 2.9%
Two 0.9% 20.0%
3 or 4 2.9% 29.3%
5 to 9 7.1% 5.3%
10 to 19 9.5% 2.0%
20 to 49 6.2% 2.6%
50 or more 10.3% 13.5%
Mobile homes 1.4% 0.3%
Median real estate property taxes paid for housing units
Type Charlotte Providence
With mortgages $2,584 (0.8%) $3,940 (1.4%)
With no mortgages $2,522 (0.8%) $4,523 (1.4%)
Marital status
Type Charlotte Providence
Divorced 9.6% 7.7%
Never married 41.7% 51.4%
Now married 43.1% 34.9%
Separated 2.1% 2.4%
Widowed 3.5% 3.5%
Class of workers - percentage
Class of Workers CharlotteProvidence
Employee of private company 75.8% 67.4%
Private not-for-profit wage and salary workers 5.9% 15.8%
Self-employed workers in own not incorporated business 5.4% 5.0%
Local government workers 4.2% 3.6%
Self-employed in own incorporated business 3.7% 2.3%
State government workers 3.4% 4.1%
Federal government workers 1.3% 1.8%
Unpaid family workers 0.3% 0.1%
Class of workers - absolute values
Class of Workers CharlotteProvidence
Employee of private company 364,991 62,130
Federal government workers 6,108 1,619
Local government workers 20,212 3,349
Private not-for-profit wage and salary workers 28,585 14,570
Self-employed in own incorporated business 17,833 2,113
Self-employed workers in own not incorporated business 25,780 4,620
State government workers 16,519 3,764
Unpaid family workers 1,214 73

Industries and Occupations

In Charlotte, the primary industries are finance, healthcare, and retail, while Providence's economy is driven by education, healthcare, and manufacturing.
Most common male industries
Industry CharlotteProvidence
Finance and insurance 13.1% 5.7%
Construction 12.5% 7.7%
Professional, scientific, and technical services 11.2% 9.0%
Retail trade 10.6% 13.5%
Manufacturing 9.3% 11.3%
Transportation and warehousing 8.4% 8.6%
Accommodation and food services 5.5% 8.3%
Other services, except public administration 4.3% 2.8%
Health care and social assistance 4.1% 4.7%
Wholesale trade 3.8% 5.0%
Administrative and support and waste management services 3.7% 6.6%
Educational services 3.4% 13.2%
Information 2.7% 0.6%
Real estate and rental and leasing 2.3% 1.5%
Arts, entertainment, and recreation 1.9% 0.8%
Public administration 1.6% 0.5%
Utilities 1.1% 0.3%
Management of companies and enterprises 0.2% 0.0%
Mining, quarrying, and oil and gas extraction 0.2% 0.0%
Agriculture, forestry, fishing and hunting 0.2% 0.2%
Most common female industries
Industry CharlotteProvidence
Health care and social assistance 16.5% 20.2%
Finance and insurance 12.6% 4.0%
Retail trade 10.5% 7.6%
Educational services 10.3% 17.7%
Professional, scientific, and technical services 9.8% 7.4%
Accommodation and food services 6.4% 9.2%
Manufacturing 6.3% 7.7%
Administrative and support and waste management services 5.7% 3.7%
Other services, except public administration 4.3% 4.0%
Transportation and warehousing 3.9% 3.0%
Public administration 3.0% 4.0%
Construction 2.4% 1.4%
Real estate and rental and leasing 2.0% 1.4%
Information 1.8% 3.5%
Arts, entertainment, and recreation 1.8% 3.5%
Wholesale trade 1.8% 2.0%
Utilities 0.7% 0.1%
Most common male occupations
Occupation CharlotteProvidence
Management occupations 15.3% 10.4%
Sales and related occupations 10.5% 9.1%
Business and financial operations occupations 9.3% 4.3%
Construction and extraction occupations 9.3% 5.0%
Computer and mathematical occupations 7.7% 3.6%
Material moving occupations 6.3% 6.9%
Office and administrative support occupations 5.7% 7.1%
Transportation occupations 5.1% 8.6%
Production occupations 4.9% 7.1%
Food preparation and serving related occupations 4.3% 6.0%
Building and grounds cleaning and maintenance occupations 3.0% 5.3%
Installation, maintenance, and repair occupations 2.9% 2.5%
Architecture and engineering occupations 2.8% 2.4%
Educational instruction, and library occupations 2.1% 9.2%
Arts, design, entertainment, sports, and media occupations 2.0% 2.8%
Health diagnosing and treating practitioners and other technical occupations 1.6% 2.0%
Legal occupations 1.3% 1.2%
Community and social service occupations 1.3% 0.8%
Firefighting and prevention, and other protective service workers including supervisors 1.0% 0.8%
Personal care and service occupations 1.0% 1.9%
Most common female occupations
Occupation CharlotteProvidence
Office and administrative support occupations 15.7% 11.8%
Management occupations 12.2% 7.1%
Business and financial operations occupations 10.8% 3.4%
Sales and related occupations 9.7% 6.0%
Educational instruction, and library occupations 7.0% 9.7%
Health diagnosing and treating practitioners and other technical occupations 4.9% 3.4%
Food preparation and serving related occupations 4.7% 9.0%
Healthcare support occupations 4.3% 8.0%
Computer and mathematical occupations 3.5% 3.5%
Production occupations 3.2% 5.1%
Arts, design, entertainment, sports, and media occupations 2.9% 4.2%
Building and grounds cleaning and maintenance occupations 2.8% 5.9%
Community and social service occupations 2.8% 3.8%
Personal care and service occupations 2.5% 4.6%
Material moving occupations 2.3% 3.2%
Health technologists and technicians 2.1% 2.6%
Transportation occupations 1.8% 1.4%
Legal occupations 1.6% 2.4%
Architecture and engineering occupations 1.4% 1.1%
Life, physical, and social science occupations 1.2% 2.0%
Food environment data per 10,000 residents
Food environment statistics CharlotteProvidence
Number of convenience stores (no gas) 2.8 2.1
Number of convenience stores (with gas) 1.0 1.5
Number of full-service restaurants 9.3 8.0
Number of grocery stores 2.1 2.1
Number of supercenters and club stores 0.1 0.0
Food environment - absolute values
Food environment statistics CharlotteProvidence
Number of convenience stores (no gas) 245 132
Number of convenience stores (with gas) 83 94
Number of full-service restaurants 804 499
Number of grocery stores 185 129
Number of supercenters and club stores 10 1
Obesity and diabetes
Food environment statistics rate CharlotteProvidence
Adult diabetes rate 7.7% 8.1%
Adult obesity rate 24.2% 24.0%
Low-income preschool obesity rate 17.4% 16.9%

Health Care

Both, Charlotte and Providence, have excellent healthcare facilities with Charlotte being home to the Carolinas Medical Center and Providence to Rhode Island Hospital, the state's largest hospital.
Health (county statistics)
Type Charlotte Providence
General health status score of residents in this county from 1 (poor) to 5 (excellent) 3.5 3.5
Average weight of females (lbs) 164.8 lbs 158.6 lbs
Average weight of males (lbs) 198.6 lbs 194.9 lbs
Residents visited a dentist within the past year 66.4% 75%
Residents exercised in the past month 73.3% 71.2%
Adult residents drank alcohol in the past 30 days 48.8% 60.3%
Residents smoked 100+ cigarettes in their lives 42.2% 46.3%

Fatal vehicle accidents per 100,000 residents
Type Total count per 100,000Drunk per 100,000Fatal count per 100,000Pedestrian count per 100,000Person count per 100,000Vehicle count per 100,000
Year CharlotteProvidenceCharlotteProvidenceCharlotteProvidenceCharlotteProvidenceCharlotteProvidenceCharlotteProvidence
2021 11.4 6.3 0.0 0.0 12.4 6.3 3.4 1.6 26.6 14.8 21.6 11.6
2020 11.0 6.3 4.3 3.2 11.5 6.3 3.3 1.6 24.4 11.0 17.7 10.5
2019 7.8 2.8 1.9 1.7 8.2 3.3 3.3 1.1 18.1 6.1 11.9 4.5
2018 10.1 4.5 4.0 2.2 11.1 4.5 4.2 0.6 23.0 10.6 17.4 6.7
2017 11.4 5.6 4.6 2.2 12.0 5.6 3.7 1.7 26.4 7.8 18.1 8.4
2016 10.2 5.0 3.8 2.2 11.0 5.0 2.8 2.2 21.7 6.7 15.3 6.1
2015 7.9 5.0 2.8 2.8 8.4 5.6 1.9 2.2 21.2 20.1 13.4 8.9
2014 7.4 2.8 2.8 0.6 7.7 2.8 1.5 1.7 16.1 3.3 11.9 3.3
2013 7.2 6.7 3.0 1.7 8.2 6.7 1.6 3.4 19.8 11.2 12.1 10.1
2012 7.6 4.5 3.9 2.8 7.9 4.5 3.4 1.1 15.2 7.3 11.4 6.2
2011 7.5 6.2 2.0 2.8 7.9 6.2 3.6 0.6 18.8 12.4 12.6 10.1
2010 5.7 7.3 2.3 2.8 5.7 7.3 2.6 3.9 13.0 16.3 8.3 11.2
2009 8.0 5.2 3.2 2.9 8.3 5.8 2.3 0.6 21.3 10.5 11.3 7.0
2008 8.5 4.7 3.2 1.7 8.8 4.7 2.7 2.9 18.8 9.9 12.3 6.4
2007 11.0 8.1 4.0 1.2 12.2 8.1 2.4 3.5 27.0 17.4 17.2 11.0
2006 11.3 6.4 4.4 2.9 11.6 7.5 2.7 2.9 28.2 16.8 17.7 8.1
2005 10.1 7.5 4.3 4.0 10.6 8.0 2.2 2.9 29.5 22.4 18.6 10.9
2004 7.6 8.0 3.1 4.6 8.4 8.5 1.8 1.1 22.1 22.2 12.3 9.7
2003 8.5 5.7 3.8 2.8 9.1 5.7 1.8 2.3 21.1 14.2 14.1 8.5
2002 9.8 9.7 3.0 5.7 10.0 9.7 2.4 2.3 29.0 25.6 16.2 15.4
2001 6.9 6.9 2.7 4.6 7.2 6.9 1.9 3.4 15.1 21.7 9.4 10.3
2000 12.4 7.5 4.4 3.5 12.9 8.1 3.1 1.2 36.8 16.7 19.6 10.4
1999 10.2 5.3 4.4 3.3 10.4 5.3 2.3 0.7 26.5 10.0 16.9 8.0
1998 10.6 6.0 2.2 2.7 11.2 6.0 3.0 2.7 32.3 18.6 16.7 8.6
1997 8.7 8.6 2.8 4.6 9.7 11.3 2.2 2.0 23.7 22.5 12.9 11.9
1996 9.9 5.3 4.1 2.0 10.5 6.6 2.7 2.6 27.0 16.5 16.1 6.6
1995 8.5 3.9 1.9 1.3 9.1 4.6 2.3 1.3 26.4 10.5 13.3 5.9
1994 9.7 9.7 3.5 2.6 10.8 9.7 3.0 3.9 24.7 36.9 14.5 15.5
1993 8.2 7.0 3.5 2.6 10.0 7.7 2.4 3.8 21.3 18.5 13.1 9.6
1992 8.6 7.0 2.5 3.2 9.0 7.0 2.3 1.3 22.1 20.3 14.5 10.8
1991 10.3 9.4 3.4 4.4 11.4 9.4 3.4 1.3 28.1 26.4 14.9 16.4
1990 10.9 5.6 3.7 2.5 12.8 6.2 0.0 0.0 30.2 10.6 16.5 6.9
1989 12.6 5.6 4.1 1.2 13.1 5.6 0.0 0.0 34.8 15.0 18.3 7.5
1988 9.0 4.4 3.4 0.6 9.0 4.4 0.0 0.0 29.0 10.0 15.3 4.4
1987 12.4 11.9 6.5 1.9 13.4 13.2 0.0 0.0 37.9 27.0 20.2 17.5
1986 13.7 10.7 5.2 2.5 14.8 11.3 0.0 0.0 34.9 28.9 19.5 11.9
1985 9.0 10.7 2.2 3.8 9.6 11.3 0.0 0.0 26.7 23.3 13.5 13.2
1984 13.2 6.3 6.0 3.8 15.2 6.3 0.0 0.0 39.4 16.4 22.4 8.2
1983 9.7 8.2 3.5 1.9 10.6 8.2 0.0 0.0 25.6 17.1 15.6 11.4
1982 11.2 8.9 4.5 3.8 12.4 8.9 0.0 0.0 31.4 17.1 16.9 10.2
1981 13.6 12.7 1.5 3.8 14.8 12.7 0.0 0.0 43.3 26.1 21.0 19.7
1980 13.9 6.4 4.1 2.6 15.2 6.4 0.0 0.0 35.8 11.5 21.9 7.0
1979 14.3 7.5 4.9 5.0 16.2 8.2 0.0 0.0 42.2 17.6 19.8 10.7
1978 16.0 4.3 2.7 1.2 17.3 4.3 0.0 0.0 49.2 6.8 24.6 4.3
1977 10.9 8.6 0.7 2.4 11.3 9.2 0.0 0.0 34.1 18.3 17.1 9.8
1976 14.0 7.8 0.0 1.8 14.0 8.4 0.0 0.0 34.3 19.9 18.2 11.5
1975 14.4 7.7 0.0 1.8 14.4 8.3 0.0 0.0 35.2 19.6 18.7 11.3

Fatal vehicle accidents
Type Total countDrunkFatal countPedestrian countPerson countVehicle count
Year CharlotteProvidenceCharlotteProvidenceCharlotteProvidenceCharlotteProvidenceCharlotteProvidenceCharlotteProvidence
1975 40 13 0 3 40 14 0 0 98 33 52 19
1976 40 13 0 3 40 14 0 0 98 33 52 19
1977 32 14 2 4 33 15 0 0 100 30 50 16
1978 48 7 8 2 52 7 0 0 148 11 74 7
1979 44 12 15 8 50 13 0 0 130 28 61 17
1980 44 10 13 4 48 10 0 0 113 18 69 11
1981 44 20 5 6 48 20 0 0 140 41 68 31
1982 37 14 15 6 41 14 0 0 104 27 56 16
1983 33 13 12 3 36 13 0 0 87 27 53 18
1984 46 10 21 6 53 10 0 0 137 26 78 13
1985 32 17 8 6 34 18 0 0 95 37 48 21
1986 50 17 19 4 54 18 0 0 127 46 71 19
1987 46 19 24 3 50 21 0 0 141 43 75 28
1988 34 7 13 1 34 7 0 0 110 16 58 7
1989 49 9 16 2 51 9 0 0 135 24 71 12
1990 47 9 16 4 55 10 0 0 130 17 71 11
1991 45 15 15 7 50 15 15 2 123 42 65 26
1992 38 11 11 5 40 11 10 2 98 32 64 17
1993 37 11 16 4 45 12 11 6 96 29 59 15
1994 45 15 16 4 50 15 14 6 114 57 67 24
1995 40 6 9 2 43 7 11 2 125 16 63 9
1996 48 8 20 3 51 10 13 4 131 25 78 10
1997 43 13 14 7 48 17 11 3 118 34 64 18
1998 54 9 11 4 57 9 15 4 164 28 85 13
1999 53 8 23 5 54 8 12 1 138 15 88 12
2000 67 13 24 6 70 14 17 2 199 29 106 18
2001 40 12 16 8 42 12 11 6 88 38 55 18
2002 58 17 18 10 59 17 14 4 172 45 96 27
2003 51 10 23 5 55 10 11 4 127 25 85 15
2004 47 14 19 8 52 15 11 2 136 39 76 17
2005 64 13 27 7 67 14 14 5 187 39 118 19
2006 74 11 29 5 76 13 18 5 185 29 116 14
2007 74 14 27 2 82 14 16 6 182 30 116 19
2008 59 8 22 3 61 8 19 5 130 17 85 11
2009 57 9 23 5 59 10 16 1 151 18 80 12
2010 42 13 17 5 42 13 19 7 95 29 61 20
2011 56 11 15 5 59 11 27 1 141 22 95 18
2012 59 8 30 5 61 8 26 2 118 13 88 11
2013 57 12 24 3 65 12 13 6 157 20 96 18
2014 60 5 23 1 62 5 12 3 130 6 96 6
2015 65 9 23 5 69 10 16 4 175 36 111 16
2016 86 9 32 4 93 9 24 4 183 12 129 11
2017 98 10 40 4 103 10 32 3 227 14 156 15
2018 88 8 35 4 97 8 37 1 201 19 152 12
2019 69 5 17 3 73 6 29 2 161 11 106 8
2020 96 12 38 6 101 12 29 3 214 21 155 20
2021 100 12 0 0 109 12 30 3 234 28 190 22
Local government: full-time employees
Job CharlotteProvidence
Airports 687 0
Financial administration 353 72
Firefighters 1,150 389
Fire - other 57 76
Health 74 0
Judicial and legal 52 53
Other and unallocable 421 90
Other government administration 331 193
Parks and recreation 257 145
Police - other 398 30
Police protection - officers 2,117 392
Sewerage 150 9
Solid waste management 253 2
Streets and highways 429 87
Totals for government 8,238 4,378
Transit 475 0
Water supply 892 226
Local government: part-time employees
Job CharlotteProvidence
Airports 48 0
Financial administration 9 4
Fire - other 1 0
Judicial and legal 7 0
Other and unallocable 9 15
Other government administration 20 71
Parks and recreation 517 89
Police - other 30 0
Police protection - officers 98 0
Sewerage 4 0
Solid waste management 1 0
Streets and highways 3 0
Totals for government 784 479
Transit 11 0
Water supply 22 6
Place of birth - Foreign born
Residents CharlotteProvidence
All residents 17.1% 33.6%
American Indian / Alaska Native residents 42.3% 13.7%
Asian residents 69.9% 59.5%
Black or African American residents 6.8% 42.5%
Native Hawaiian / Pacific Islander residents 5.6% 11.0%
Other race residents 52.5% 56.5%
Two or more races residents 30.4% 32.5%
White residents 5.8% 8.4%
White alone, not Hispanic / Latino residents 5.7% 8.9%
Place of birth - Native, outside of US
Residents CharlotteProvidence
All residents 1.8% 3.6%
American Indian / Alaska Native residents 0.0% 1.1%
Asian residents 0.9% 1.5%
Black or African American residents 1.3% 1.5%
Native Hawaiian / Pacific Islander residents 22.7% 0.0%
Other race residents 3.3% 6.7%
Two or more races residents 3.2% 7.6%
White residents 1.4% 1.2%
White alone, not Hispanic / Latino residents 1.4% 1.4%
Place of birth - Born in state of residence
Residents CharlotteProvidence
All residents 40.7% 35.0%
American Indian / Alaska Native residents 40.7% 70.8%
Asian residents 16.4% 24.2%
Black or African American residents 53.2% 37.3%
Native Hawaiian / Pacific Islander residents 33.9% 2.2%
Other race residents 28.8% 25.6%
Two or more races residents 37.8% 40.5%
White residents 38.9% 41.3%
White alone, not Hispanic / Latino residents 38.8% 40.5%
Place of birth - Born in other state
Residents CharlotteProvidence
All residents 40.3% 27.9%
American Indian / Alaska Native residents 17.1% 14.5%
Asian residents 12.7% 14.8%
Black or African American residents 38.7% 18.7%
Native Hawaiian / Pacific Islander residents 37.8% 86.8%
Other race residents 15.4% 11.2%
Two or more races residents 28.6% 19.5%
White residents 53.9% 49.1%
White alone, not Hispanic / Latino residents 54.2% 49.2%
English speakers (speaking English at home)
Type Charlotte Providence
Born in the United States residents 93.3% 81%
Foreign born residents 16.8% 12.8%
Native, born elsewhere residents 57.7% 24.5%
Total residents 77.8% 50.8%
Mechanisms of homicide
Mechanism CharlotteProvidence
Homicides from 2000 to 2006 537 201
Cut / Pierce 60 33
Firearm 408 129
Mechanisms of homicide per 1,000,000 residents
Mechanism CharlotteProvidence
Homicides from 2000 to 2006 101.0 45.5
Cut / Pierce 11.3 7.5
Firearm 76.7 29.2
Mechanisms of suicide per 1,000,000 residents
Mechanism CharlotteProvidence
Suicides from 2000 to 2006 93.7 72.6
Firearm 51.7 19.5
Poisoning 15.2 14.7
Suffocation 18.2 33.3

Infrastructure

Both cities boast impressive infrastructure, with Charlotte having a more modern skyline owing to its role as a financial hub. Providence, possessing a rich history, showcases marvelous historic architecture.
Infrastructure
Type Charlotte Providence
Hospitals 37 7
TV stations 16 24
Arenas or stadiums 3 3
Bank branches located here 202 43
Bank institutions located here 26 11
Main business address for public companies 33 8
Nuclear power plants nearby 2 0
Drinking water stations with no reported violations in the past 24 2
Drinking water stations with reported violations in the past 40 11

Schools

School facilities
Type Charlotte Providence
Private elementary/middle schools 19 14
Private high schools 31 10
Public elementary/middle schools 120 30
Public high schools 35 19
Colleges/Universities 25 7
HMDA - Conventional home purchase loans - Applications denied
Year CharlotteProvidence
1999 3,049 381
2000 1,568 421
2001 1,382 447
2002 1,275 425
2003 1,879 786
2004 2,415 1,138
2005 3,078 1,678
2006 3,864 1,738
2007 3,106 1,067
2008 1,287 451
2009 617 149

Culture and Food

Charlotte offers a unique mix of Southern culture, rich history, and modern sophistication, including a thriving culinary scene focused on Southern cuisine. Providence, the oldest city in the USA, is culturally diverse, with a food scene that ranges from Italian to Portuguese to Latin American cuisines.

Sports Teams

Charlotte is home to the NFL's Carolina Panthers and the NBA's Charlotte Hornets. Providence doesn’t have any major league teams, but their minor league team, the Pawtucket Red Sox, has a devout local following.