Comparing two culturally distinct cities - Charlotte, North Carolina, and Lexington-Fayette, Kentucky - each offering unique experiences based on their respective regional importance, cultural impact, economy, and living conditions. Noteworthy considerations for these cities range from crime rates, climate, cost of living, educational opportunities, to economic prospects, infrastructural development, employment sectors, real-estate, taxes, transportation options, food and culture, sports teams, geographical conditions, and healthcare access.
Distance between
Charlotte, NC and
Lexington-Fayette, KY : 281.6 miles
Charlotte's population is larger by 173%. Its population has grown by 338,881 people (62.7%) since 2000. The population of Lexington-Fayette has grown by 61,281 people (23.5%) during that time.
Charlotte, NC tends to have a higher crime rate compared to the national average. Violent crimes are also higher, which may concern prospective residents and visitors. In contrast, Lexington-Fayette, KY has a lower crime rate, making it a safer option statistically. However, both cities have taken steps in recent years to improve safety measures and reduce crime rates.
Cost of Living
The cost of living in Charlotte is slightly higher compared to the national average largely due to housing costs, but still cheaper than many major US cities. Lexington-Fayette, though, offers an even lower cost of living, especially when it comes to housing and groceries. Healthcare and utilities costs are comparable in both cities.
Income Tax
North Carolina has a flat state income tax rate, currently at 5.25%, affecting all income earners in Charlotte. Conversely, Kentucky operates a progressive income tax system, starting at 2% for incomes under $3,000 and capping at 5% for those earning over $5,000.
Property Tax
In Charlotte, the property tax rate ranges from 0.83% to 1.68%, depending on the county. Lexington-Fayette's property tax rates can vary widely but average around 1.113%.
Sales Tax
Charlotte, NC has a combined state and local sales tax rate of 7.25%, while Lexington-Fayette, KY has a 6% state sales tax without any added local tax.
Income
Type
Charlotte
Lexington-Fayette
Estimated median household income
$70,869
$60,942
Estimated per capita income
$44,593
$37,011
Cost of living index (U.S. average is 100)
93.2
89.3
If you make $50,000 in Lexington-Fayette, you will have to make $52,184 in Charlotte to maintain the same standard of living.
Geographical Conditions
Charlotte offers a landscape of rolling hills located inland but still relatively close to both mountains and coast, providing great options for outdoor activities. Lexington, on the other hand, is characterized by its fertile bluegrass landscape famous for pristine horse farms.
Both cities have strong education systems. Charlotte boasts several top-ranking schools and numerous colleges and universities, like the University of North Carolina at Charlotte. Lexington is home to the University of Kentucky, a top-tier public university, and has a strong public school system that scores high in national rankings.
The top-performing sectors in Charlotte are finance, technology, and healthcare, offering many job opportunities. In contrast, Lexington-Fayette's economy is predominantly dependent on thoroughbred horse racing and breeding industries, education, and healthcare.
Biggest Employers
In Charlotte, some of the biggest employers are Wells Fargo, Atrium Health, and American Airlines. In Lexington, University of Kentucky, Lexmark International, and KentuckyOne Health are some of the top employers.
In Charlotte (Mecklenburg County), 60.8% voted for Democrats and 38.3% for Republicans in 2012 Presidential Election. In Lexington-Fayette (Fayette County), 49.3% voted for Democrats and 48.3% for Republicans.
Elections
Type
Democrats
Republicans
Other
Year
Charlotte
Lexington-Fayette
Charlotte
Lexington-Fayette
Charlotte
Lexington-Fayette
2020
66.8%
59.4%
31.6%
38.6%
1.6%
1.9%
2016
62.3%
51.3%
32.9%
41.8%
4.8%
6.9%
2012
60.8%
49.3%
38.3%
48.3%
0.9%
2.3%
2008
62.0%
51.7%
37.6%
46.9%
0.5%
1.3%
2004
51.7%
46.3%
48.0%
53.1%
0.3%
0.6%
2000
48.4%
45.0%
51.1%
51.8%
0.5%
3.2%
1996
48.6%
47.1%
45.9%
46.3%
5.5%
6.6%
Breakdown of population affiliated with a religious congregation
Type
Adherents
Congregations
Religion
Charlotte
Lexington-Fayette
Charlotte
Lexington-Fayette
SOUTHERN BAPTIST CONVENTION
9.0%
13.7%
19.0%
19.5%
CATHOLIC CHURCH
8.5%
8.8%
1.8%
3.0%
AMERICAN BAPTIST CHURCHES IN THE USA
2.3%
0.0%
1.1%
0.0%
EPISCOPAL CHURCH
1.2%
0.9%
1.3%
2.3%
EVANGELICAL LUTHERAN CHURCH IN AMERICA
0.9%
0.4%
1.8%
1.1%
PRESBYTERIAN CHURCH IN AMERICA
0.6%
0.3%
1.9%
0.8%
SEVENTH DAY ADVENTIST CHURCH
0.5%
0.3%
1.5%
1.5%
MUSLIM ESTIMATE
0.3%
0.2%
1.2%
0.8%
VINEYARD USA
0.0%
0.4%
0.1%
0.4%
Weather
Charlotte experiences a humid subtropical climate with hot, humid summers and mild to cool winters. On the other hand, Lexington-Fayette enjoys a slightly more continental climate with cold, snowy winters and hot, humid summers. Severe weather conditions like tornadoes and hurricanes are less common in Lexington-Fayette compared to Charlotte.
Weather and climate
Type
Charlotte
Lexington-Fayette
Temperature - Average
61°F
55.3°F
Humidity - Average morning or afternoon humidity
72.3%
75.8%
Humidity - Differences between morning and afternoon humidity
41%
31%
Humidity - Maximum monthly morning or afternoon humidity
87%
85%
Humidity - Minimum monthly morning or afternoon humidity
46%
54%
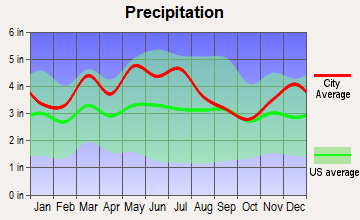
Precipitation - Yearly average
44.5 in
45.9 in
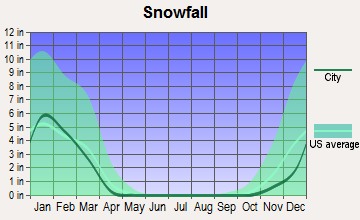
Snowfall - Yearly average
10.2 in
35.2 in
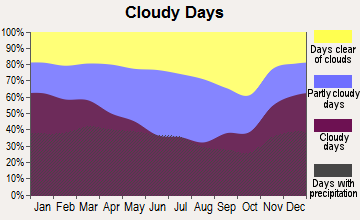
Clouds - Number of days clear of clouds
18.1%
14.9%
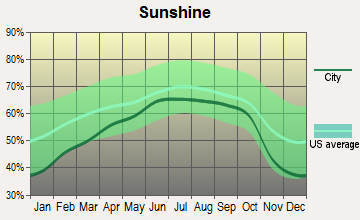
Sunshine amount - Average
69.8%
59.9%
Sunshine amount - Differences during a year
14%
25.5%
Sunshine amount - Maximum monthly
70%
66.2%
Sunshine amount - Minimum monthly
56%
40.7%
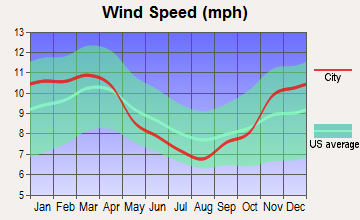
Wind speed - Average
6.9 mph
8.6 mph
Average climate in Charlotte, North Carolina
Average climate in Lexington-Fayette, Kentucky
Air pollution
Type
AQI
CO
NO2
OZONE
PB
PM10
PM25
SO2
Year
Charlotte
Lexington-Fayette
Charlotte
Lexington-Fayette
Charlotte
Lexington-Fayette
Charlotte
Lexington-Fayette
Charlotte
Charlotte
Charlotte
Lexington-Fayette
Charlotte
Lexington-Fayette
2018
75
63
0.24
N/A
6.3
3.1
27.8
31.6
N/A
N/A
15.5
N/A
8.2
9.7
0.2
0.1
2017
77
64
0.25
N/A
7.0
4.9
28.0
32.1
N/A
N/A
16.3
N/A
8.8
7.2
0.2
0.1
2016
82
68
0.25
N/A
7.6
6.6
28.7
33.3
N/A
N/A
N/A
N/A
8.4
6.9
0.2
0.1
2015
76
71
0.25
N/A
8.1
6.7
27.6
31.4
N/A
N/A
N/A
N/A
8.6
7.3
0.2
0.1
2014
76
68
0.26
N/A
8.5
6.8
26.3
34.1
N/A
N/A
N/A
N/A
9.3
7.6
0.3
0.3
2013
71
69
0.29
N/A
8.4
7.3
25.5
31.7
N/A
N/A
N/A
N/A
8.6
10.0
0.3
0.2
2012
95
81
0.28
N/A
8.7
8.1
27.3
34.9
N/A
N/A
N/A
N/A
9.7
10.6
0.3
0.8
2011
94
78
0.34
N/A
10.1
8.3
28.9
34.6
N/A
N/A
N/A
N/A
11.2
11.3
0.6
2.1
2010
97
76
0.33
N/A
11.8
9.5
28.0
34.9
N/A
N/A
N/A
N/A
11.6
10.0
1.0
2.2
2009
82
75
0.30
N/A
10.0
8.5
25.4
31.1
N/A
N/A
N/A
N/A
11.1
9.2
0.9
2.7
2008
102
72
0.32
N/A
11.2
7.8
27.6
36.4
N/A
N/A
N/A
N/A
13.0
9.1
2.1
2.4
2007
108
92
0.37
N/A
13.9
10.9
29.1
37.9
0.001
N/A
N/A
N/A
14.5
12.9
3.0
4.0
2006
107
65
0.44
N/A
13.9
11.8
27.3
32.8
0.000
N/A
N/A
N/A
14.8
N/A
3.3
3.8
2005
109
77
0.53
N/A
14.6
12.1
30.6
34.0
0.000
N/A
N/A
N/A
15.2
N/A
2.7
4.4
2004
89
60
0.53
N/A
14.6
11.6
28.9
28.6
0.001
N/A
N/A
N/A
N/A
N/A
2.8
3.2
2003
85
67
0.57
N/A
15.6
12.2
27.6
30.3
0.003
N/A
N/A
N/A
N/A
N/A
3.0
3.5
2002
103
76
0.63
0.04
15.3
12.1
32.6
31.3
0.003
N/A
N/A
N/A
N/A
N/A
2.7
3.6
2001
108
69
0.72
0.07
17.5
13.2
32.3
30.9
0.005
N/A
N/A
N/A
N/A
N/A
3.9
4.4
2000
107
79
0.79
0.14
18.0
13.4
32.6
32.7
0.014
N/A
N/A
N/A
N/A
N/A
4.4
5.0
Natural disasters
Type
Charlotte
Lexington-Fayette
Tornado activity compared to U.S. average
111.5%
126.8%
Earthquake activity compared to U.S. average
79%
171.6%
Natural disasters compared to U.S. average
9%
14%
Transportation
Charlotte is served by the Charlotte Area Transit System (CATS), which includes bus and light rail services. Lexington's public transportation, Lextran, operates bus routes throughout the city, but lacks rail options.
Transport
Type
Charlotte
Lexington-Fayette
Amtrak stations
1
0
Amtrak stations nearby
2
0
FAA registered aircraft
439
0
FAA registered aircraft manufacturers and dealers
12
0
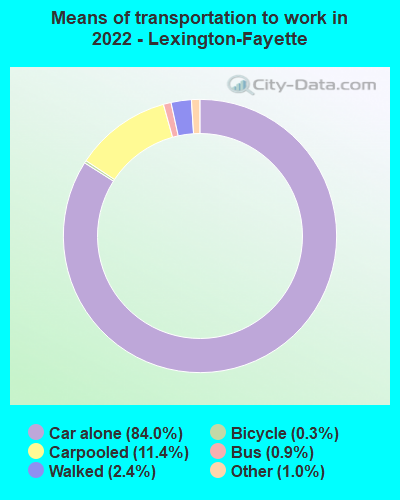
Means of transportation to work
Type
Charlotte
Lexington-Fayette
Bicycle
0.1%
0.6%
Bus
1.2%
1.2%
Carpooled
8.7%
8.3%
Car alone
86.2%
86.5%
Railroad
0.4%
0%
Taxicab
0.2%
0.1%
Walked
1.5%
2.6%
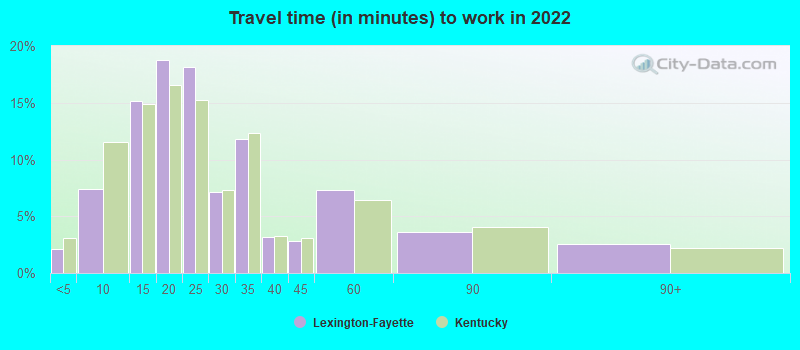
Average travel time to work
Type
Charlotte
Lexington-Fayette
Average
29.6 min
26.5 min
Other means
24.9 min
20.2 min
Public transportation
44.1 min
35 min
Private vehicle occupancy
Type
Charlotte
Lexington-Fayette
Average
1.2
1.1
Drove alone
90%
90.6%
In 2 person carpool
6.9%
7.7%
In 3 person carpool
1.8%
1.2%
In 4 person carpool
0.8%
0.3%
In 5-6 person carpool
0.5%
0.1%
How many people usually rode to work in the car, truck or van.
Real Estate
The housing market in Charlotte leans towards being slightly more expensive, but still reasonable when compared to other major U.S. cities. Lexington offers even more affordable housing options, making it a great choice for those on a budget.
Neighborhoods
Charlotte offers diverse neighborhoods from the hip and trendy NoDa (North Davidson) to the upscale Myers Park. Lexington is known for its historic districts like Gratz Park and trendy neighborhoods such as Chevy Chase.
Houses and residents
Type
Charlotte
Lexington-Fayette
Houses
393,631
147,590
Average household size (people)
2.5
2.3
Median year apartment built
1998
1983
Median year house/condo built
1993
1985
Length of stay in the house since moving in
11.8 years
12 years
Houses occupied
365,269 (92.8%)
139,303 (94.4%)
Houses occupied by owners
193,930 (53.1%)
75,129 (53.9%)
Houses occupied by renters
171,339 (46.9%)
64,174 (46.1%)
Median rent asked for vacant for-rent units
$1,482
$1,514
Median monthly housing costs
$1,302
$1,026
Median price asked for vacant for-sale houses and condos
$445,491
$229,178
Estimated median house or condo value
$321,400
$242,400
Median numbers of rooms
5.3
5.4
Median number of rooms in apartments
4
4
Median number of rooms in houses and condos
6.6
7
Median house price - detached houses
$388,029
$300,664
Median house price - in 2-unit structures
$184,325
$297,942
Median house price - in 3-to-4-unit structures
$178,624
$165,223
Median house price - in 5 or more unit structures
$433,957
$179,160
Median house price - mobile homes
$52,977
$37,529
Median house price - Townhouses or other attached units
$296,370
$232,720
Median house price - All housing units
$378,423
$289,099
Median house age
26
37
Renting percentage
42.6%
44.1%
Housing density (houses/condos per square mile)
1,624.8
518.7
House value disparities
33.3%
33%
Household income disparities
44.1%
46.3%
Median household income for houses/condes with a mortgage
$105,905
$95,171
Median household income for apartments without a mortgage
$70,681
$74,841
Housing units without a mortgage
3,089 (2.1%)
2,236 (4.2%)
Housing units with both a second mortgage and home equity loan
10,553 (7.2%)
6,457 (12.1%)
Housing units with a mortgage
142,912 (97.9%)
51,182 (95.8%)
Housing units with a home equity loan
171 (0.1%)
156 (0.3%)
Housing units with a second mortgage
13,532 (9.3%)
7,551 (14.1%)
House/condo owner moved in on average (years ago)
9
9
House/condo renter moved in on average (years ago)
1
1
Housing units lacking complete kitchen facilities
0.8%
1.3%
Housing units lacking complete plumbing facilities
0.2%
0.4%
Housing units in structures
Housing units in structures
Charlotte
Lexington-Fayette
One, detached
52.7%
58.7%
One, attached
9.1%
6.4%
Two
0.9%
3.0%
3 or 4
2.9%
4.9%
5 to 9
7.1%
7.5%
10 to 19
9.5%
8.4%
20 to 49
6.2%
4.3%
50 or more
10.3%
5.6%
Mobile homes
1.4%
1.3%
Median real estate property taxes paid for housing units
Self-employed workers in own not incorporated business
25,780
9,814
State government workers
16,519
15,501
Unpaid family workers
1,214
346
Industries and Occupations
Charlotte’s dominant sectors include financial services, energy, and healthcare. It is home to several Fortune 500 companies like Bank of America and Duke Energy. Lexington, in contrast, is known for education, healthcare, and the horse racing industry.
Charlotte’s healthcare is world-class, boasting the Atrium Health’s Carolinas Medical Center and Novant Health Presbyterian Medical Center. Lexington has two notable healthcare systems, UK Healthcare and Baptist Health Lexington.
Health (county statistics)
Type
Charlotte
Lexington-Fayette
General health status score of residents in this county from 1 (poor) to 5 (excellent)
Both cities have well-developed infrastructure. Charlotte has a particularly strong banking and finance sector, with impressive high-rise buildings, while Lexington-Fayette has a well-preserved historic district with classic Victorian-style buildings.
HMDA - Conventional home purchase loans - Applications denied
Year
Charlotte
Lexington-Fayette
1999
3,049
756
2000
1,568
655
2001
1,382
568
2002
1,275
463
2003
1,879
529
2004
2,415
777
2005
3,078
997
2006
3,864
751
2007
3,106
517
2008
1,287
325
2009
617
230
Culture and Food
Where Charlotte offers a wide array of restaurants serving everything from traditional Southern cuisine to international dishes, Lexington emerged as a foodie paradise famed for its barbecue and bourbon.
Sports Teams
Sports fans would love Charlotte, home to the Carolina Panthers (NFL), Charlotte Hornets (NBA), and the NASCAR Hall of Fame. Lexington is home to the University of Kentucky Wildcats and is highly recognized for its college basketball team.


 Charlotte, NC
 Lexington-Fayette, KY