Living in Charlotte, North Carolina, and Irving, Texas, offer distinct experiences influenced by factors such as crime levels, weather, cost of living, education, job opportunities, infrastructure, industries, real estate, and healthcare, among others. These cities each have diverse neighborhoods, taxes, cultural scenes, sports teams, and geographical conditions that mold unique lifestyles for residents and tourists alike. To thoroughly understand what each city presents, it's imperative to shed light on these comparative elements.
Distance between
Charlotte, NC and
Irving, TX : 937.2 miles
Charlotte's population is larger by 246%. Its population has grown by 338,881 people (62.7%) since 2000. The population of Irving has grown by 62,583 people (32.7%) during that time.
Comparing the cities' crime rates, Charlotte has a higher crime rate than Irving, mainly due to its larger population. However, both cities have been making strides in enhancing community safety. Both cities have well-structured police departments working to increase safety levels for residents and visitors.
Cost of Living
The cost of living in Charlotte is slightly higher than in Irving, mainly due to higher housing costs. However, both cities have a cost of living below the national average, making them attractive for relocation and tourism.
Income Tax
North Carolina has a flat state income tax of 5.25%. However, Texas, which Irving is part of, does not have a state-level income tax, making Irving advantageous for anyone with tax-centric relocation considerations.
Property Tax
Property taxes in Charlotte tend to be lower than in Irving as North Carolina has a lower average property tax rate than Texas.
Sales Tax
The sales tax in Charlotte, NC, is 7.25%, while in Irving, TX, it's 8.25%. Texas doesn't have a state income tax, which might entice individuals sensitive to tax burdens.
Income
Type
Charlotte
Irving
Estimated median household income
$70,869
$70,340
Estimated per capita income
$44,593
$36,210
Cost of living index (U.S. average is 100)
93.2
95.5
If you make $50,000 in Charlotte, you will have to make $51,234 in Irving to maintain the same standard of living.
Geographical Conditions
Charlotte is characterized by rolling hills and abundant greenery, while Irving enjoys relatively flat terrain with several small lakes and waterways.
In Charlotte, The Charlotte-Mecklenburg School system provides primary and secondary education. There are also numerous colleges and universities, including the University of North Carolina at Charlotte. Irving is served by the Irving Independent School District and a number of private schools, while higher education is available at the University of Dallas and North Lake College.
Charlotte's economy is driven by sectors such as finance, technology, healthcare, and retail. In contrast, Irving's economy leans towards technology, global logistics, retail, and manufacturing. Both provide ample job opportunities with competitive wages.
Biggest Employers
Charlotte's biggest employers include Wells Fargo, Bank of America, and Carolinas Healthcare System. In Irving, top employers are Verizon, Citigroup, and Microsoft.
In Charlotte (Mecklenburg County), 60.8% voted for Democrats and 38.3% for Republicans in 2012 Presidential Election. In Irving (Dallas County), 57.3% voted for Democrats and 41.8% for Republicans.
Elections
Type
Democrats
Republicans
Other
Year
Charlotte
Irving
Charlotte
Irving
Charlotte
Irving
2020
66.8%
65.1%
31.6%
33.4%
1.6%
1.4%
2016
62.3%
60.8%
32.9%
34.7%
4.8%
4.5%
2012
60.8%
57.3%
38.3%
41.8%
0.9%
1.0%
2008
62.0%
57.4%
37.6%
42.0%
0.5%
0.6%
2004
51.7%
49.0%
48.0%
50.4%
0.3%
0.5%
2000
48.4%
45.0%
51.1%
52.7%
0.5%
2.4%
1996
48.6%
46.0%
45.9%
46.8%
5.5%
7.2%
Breakdown of population affiliated with a religious congregation
Type
Adherents
Congregations
Religion
Charlotte
Irving
Charlotte
Irving
SOUTHERN BAPTIST CONVENTION
9.0%
11.0%
19.0%
31.1%
CATHOLIC CHURCH
8.5%
18.9%
1.8%
2.4%
AMERICAN BAPTIST CHURCHES IN THE USA
2.3%
0.1%
1.1%
0.2%
EPISCOPAL CHURCH
1.2%
1.0%
1.3%
1.5%
EVANGELICAL LUTHERAN CHURCH IN AMERICA
0.9%
0.3%
1.8%
0.9%
PRESBYTERIAN CHURCH IN AMERICA
0.6%
0.3%
1.9%
0.6%
SEVENTH DAY ADVENTIST CHURCH
0.5%
0.5%
1.5%
1.7%
MUSLIM ESTIMATE
0.3%
3.6%
1.2%
1.1%
Weather
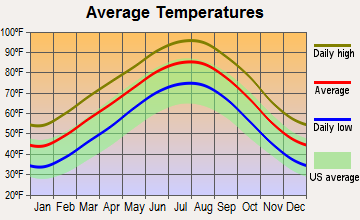
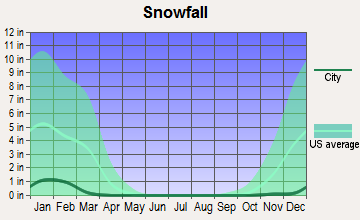
Charlotte experiences a humid subtropical climate with hot and humid summers and mild to cool winters. Snowfall is rare but possible. On the other hand, Irving usually has a humid subtropical climate, characterized by hot, humid summers and mild winters. However, it's less humid than Charlotte, and snowfall is rarer.
Weather and climate
Type
Charlotte
Irving
Temperature - Average
61°F
65.6°F
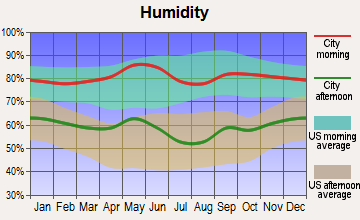
Humidity - Average morning or afternoon humidity
72.3%
71.3%
Humidity - Differences between morning and afternoon humidity
41%
34%
Humidity - Maximum monthly morning or afternoon humidity
87%
82%
Humidity - Minimum monthly morning or afternoon humidity
46%
48%
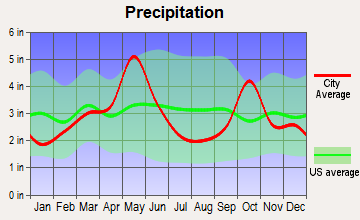
Precipitation - Yearly average
44.5 in
35.2 in
Snowfall - Yearly average
10.2 in
4.2 in
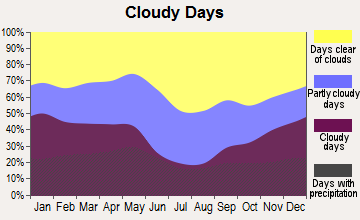
Clouds - Number of days clear of clouds
18.1%
22.8%
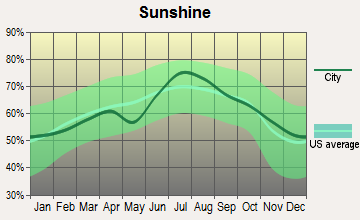
Sunshine amount - Average
69.8%
66.6%
Sunshine amount - Differences during a year
14%
20%
Sunshine amount - Maximum monthly
70%
74%
Sunshine amount - Minimum monthly
56%
54%
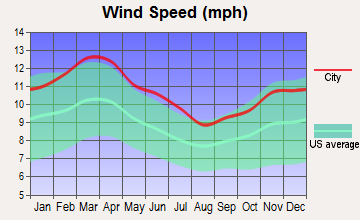
Wind speed - Average
6.9 mph
10.3 mph
Average climate in Charlotte, North Carolina
Average climate in Irving, Texas
Air pollution
Type
AQI
CO
NO2
OZONE
PB
PM10
PM25
SO2
Year
Charlotte
Irving
Charlotte
Irving
Charlotte
Irving
Charlotte
Irving
Charlotte
Irving
Charlotte
Charlotte
Irving
Charlotte
Irving
2018
75
86
0.24
N/A
6.3
5.8
27.8
28.6
N/A
N/A
15.5
N/A
8.2
9.7
0.2
0.4
2017
77
84
0.25
N/A
7.0
5.7
28.0
28.9
N/A
N/A
16.3
N/A
8.8
9.1
0.2
0.3
2016
82
81
0.25
N/A
7.6
6.2
28.7
27.3
N/A
N/A
N/A
N/A
8.4
8.4
0.2
0.2
2015
76
83
0.25
N/A
8.1
6.6
27.6
26.9
N/A
N/A
N/A
N/A
8.6
8.9
0.2
0.3
2014
76
83
0.26
0.22
8.5
6.4
26.3
28.0
N/A
N/A
N/A
N/A
9.3
9.9
0.3
0.3
2013
71
96
0.29
0.25
8.4
7.0
25.5
29.1
N/A
N/A
N/A
N/A
8.6
13.0
0.3
0.2
2012
95
112
0.28
0.26
8.7
8.4
27.3
31.4
N/A
N/A
N/A
N/A
9.7
12.0
0.3
0.3
2011
94
97
0.34
0.23
10.1
8.9
28.9
31.3
N/A
N/A
N/A
N/A
11.2
11.9
0.6
0.6
2010
97
76
0.33
0.23
11.8
9.2
28.0
28.5
N/A
N/A
N/A
N/A
11.6
N/A
1.0
0.7
2009
82
88
0.30
0.25
10.0
9.1
25.4
29.3
N/A
N/A
N/A
N/A
11.1
N/A
0.9
0.5
2008
102
88
0.32
0.25
11.2
9.8
27.6
29.0
N/A
0.121
N/A
N/A
13.0
N/A
2.1
0.5
2007
108
94
0.37
0.30
13.9
10.8
29.1
26.0
0.001
0.070
N/A
N/A
14.5
N/A
3.0
0.3
2006
107
105
0.44
0.34
13.9
10.7
27.3
30.8
0.000
0.106
N/A
N/A
14.8
N/A
3.3
0.7
2005
109
110
0.53
0.34
14.6
12.7
30.6
30.0
0.000
0.142
N/A
N/A
15.2
11.1
2.7
0.9
2004
89
96
0.53
0.39
14.6
11.9
28.9
26.6
0.001
0.099
N/A
N/A
N/A
N/A
2.8
0.8
2003
85
102
0.57
0.40
15.6
13.0
27.6
27.9
0.003
0.121
N/A
N/A
N/A
N/A
3.0
1.0
2002
103
100
0.63
0.37
15.3
13.6
32.6
26.0
0.003
0.080
N/A
N/A
N/A
N/A
2.7
0.4
2001
108
100
0.72
0.48
17.5
14.1
32.3
27.2
0.005
0.069
N/A
N/A
N/A
N/A
3.9
1.0
2000
107
109
0.79
0.55
18.0
14.5
32.6
28.1
0.014
0.092
N/A
N/A
N/A
N/A
4.4
1.1
Natural disasters
Type
Charlotte
Irving
Tornado activity compared to U.S. average
111.5%
255.8%
Earthquake activity compared to U.S. average
79%
574.6%
Natural disasters compared to U.S. average
9%
21%
Transportation
Charlotte has extensive public transit, including buses, the LYNX light rail, and streetcars. Irving, though it doesn’t have a city-wide bus system, is part of the Dallas Area Rapid Transit (DART) system, which provides bus and rail services.
Transport
Type
Charlotte
Irving
Amtrak stations
1
0
Amtrak stations nearby
2
1
FAA registered aircraft
439
112
FAA registered aircraft manufacturers and dealers
12
5
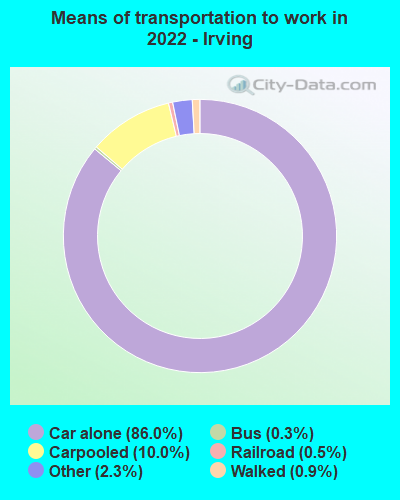
Means of transportation to work
Type
Charlotte
Irving
Bicycle
0.1%
0%
Bus
1.2%
0.4%
Carpooled
8.7%
9.9%
Car alone
86.2%
85.5%
Motorcycle
0.1%
0.1%
Railroad
0.4%
0.4%
Subway
0%
0.1%
Taxicab
0.2%
0.2%
Walked
1.5%
1.3%
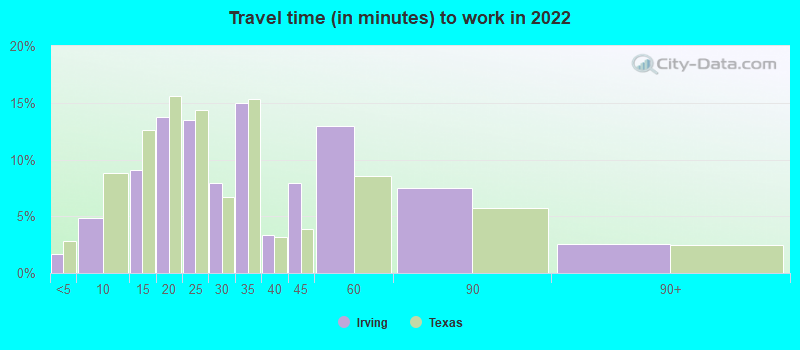
Average travel time to work
Type
Charlotte
Irving
Average
29.6 min
31.5 min
Other means
24.9 min
24.2 min
Public transportation
44.1 min
44.1 min
Private vehicle occupancy
Type
Charlotte
Irving
Average
1.2
1.2
Drove alone
90%
87.2%
In 2 person carpool
6.9%
8.8%
In 3 person carpool
1.8%
2.9%
In 4 person carpool
0.8%
0.7%
In 5-6 person carpool
0.5%
0.3%
How many people usually rode to work in the car, truck or van.
Real Estate
In terms of real estate, both cities offer diverse options ranging from apartments to family homes. However, housing is generally more expensive in Charlotte than Irving.
Neighborhoods
Both cities boast diverse neighborhoods for different lifestyles. In Charlotte, Myers Park and Dilworth are popular, while in Irving, Las Colinas and Valley Ranch are preferred by many residents and tourists alike.
Houses and residents
Type
Charlotte
Irving
Houses
393,631
100,800
Average household size (people)
2.5
2.6
Median year apartment built
1998
1987
Median year house/condo built
1993
1983
Length of stay in the house since moving in
11.8 years
11.7 years
Houses occupied
365,269 (92.8%)
95,309 (94.6%)
Houses occupied by owners
193,930 (53.1%)
34,544 (36.2%)
Houses occupied by renters
171,339 (46.9%)
60,765 (63.8%)
Median rent asked for vacant for-rent units
$1,482
$1,063
Median monthly housing costs
$1,302
$1,330
Median price asked for vacant for-sale houses and condos
$445,491
$665,016
Estimated median house or condo value
$321,400
$274,100
Median numbers of rooms
5.3
4.2
Median number of rooms in apartments
4
3.5
Median number of rooms in houses and condos
6.6
6.1
Median house price - detached houses
$388,029
$337,489
Median house price - in 2-unit structures
$184,325
$126,853
Median house price - in 3-to-4-unit structures
$178,624
$134,257
Median house price - in 5 or more unit structures
$433,957
$217,218
Median house price - mobile homes
$52,977
$125,168
Median house price - Townhouses or other attached units
$296,370
$250,693
Median house price - All housing units
$378,423
$321,036
Median house age
26
35
Renting percentage
42.6%
61.6%
Housing density (houses/condos per square mile)
1,624.8
1,499.4
House value disparities
33.3%
33.7%
Household income disparities
44.1%
42.4%
Median household income for houses/condes with a mortgage
$105,905
$108,487
Median household income for apartments without a mortgage
$70,681
$78,490
Housing units without a mortgage
3,089 (2.1%)
261 (1.2%)
Housing units with both a second mortgage and home equity loan
10,553 (7.2%)
547 (2.6%)
Housing units with a mortgage
142,912 (97.9%)
21,104 (98.8%)
Housing units with a home equity loan
171 (0.1%)
79 (0.4%)
Housing units with a second mortgage
13,532 (9.3%)
681 (3.2%)
House/condo owner moved in on average (years ago)
9
10
House/condo renter moved in on average (years ago)
1
1
Housing units lacking complete kitchen facilities
0.8%
2.2%
Housing units lacking complete plumbing facilities
0.2%
1.5%
Housing units in structures
Housing units in structures
Charlotte
Irving
One, detached
52.7%
39.8%
One, attached
9.1%
3.8%
Two
0.9%
2.0%
3 or 4
2.9%
5.8%
5 to 9
7.1%
11.3%
10 to 19
9.5%
15.2%
20 to 49
6.2%
7.0%
50 or more
10.3%
13.9%
Mobile homes
1.4%
1.3%
Median real estate property taxes paid for housing units
Self-employed workers in own not incorporated business
25,780
9,391
State government workers
16,519
2,329
Unpaid family workers
1,214
283
Industries and Occupations
The most common occupations in Charlotte span across sectors such as finance, healthcare, and retail. In Irving, occupations in the technology, manufacturing, and retail sectors dominate, reflecting the cities' diverse industrial setup.
Both cities offer high-quality healthcare, with many hospitals and clinics. Charlotte has the Carolinas Medical Center and Novant Health Presbyterian Medical Center while Irving has the Baylor Scott & White Medical Center and the Medical City Las Colinas.
Health (county statistics)
Type
Charlotte
Irving
General health status score of residents in this county from 1 (poor) to 5 (excellent)
The infrastructure in both cities is solid with well-maintained roads, airports, and public buildings. Charlotte boasts the Charlotte Douglas International Airport, while Irving offers the Dallas/Fort Worth International Airport.
Infrastructure
Type
Charlotte
Irving
Hospitals
37
12
TV stations
16
26
Arenas or stadiums
3
1
Bank branches located here
202
52
Bank institutions located here
26
20
Main business address for public companies
33
26
Nuclear power plants nearby
2
0
Drinking water stations with no reported violations in the past
24
0
Drinking water stations with reported violations in the past
HMDA - Conventional home purchase loans - Applications denied
Year
Charlotte
Irving
1999
3,049
1,047
2000
1,568
375
2001
1,382
307
2002
1,275
239
2003
1,879
722
2004
2,415
647
2005
3,078
1,099
2006
3,864
1,041
2007
3,106
618
2008
1,287
368
2009
617
179
Culture and Food
As for the cultural scene, both cities are quite rich. Charlotte offers a strong arts scene, with numerous museums, art galleries, and performing arts venues. Irving has a diverse culture influenced heavily by Mexican heritage with regular cultural festivals. Both cities offer a vibrant food scene, with Tex-Mex being popular in Irving and barbecue food reigning supreme in Charlotte.
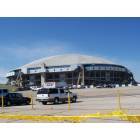
Sports Teams
Charlotte is home to the NFL's Carolina Panthers and the NBA's Charlotte Hornets, attracting sports enthusiasts. Irving, originally the hub for the Dallas Cowboys, is within short reach of Dallas's vibrant sports scene.


 Charlotte, NC
 Irving, TX