When comparing Charlotte, NC to Corpus Christi, TX, a potential relocator or a tourist would need to consider various factors such as crime/safety, weather, cost of living, and more. Both cities have their unique charms and challenges. Charlotte, nicknamed "the Queen City," is known for its robust economy and appealing cosmopolitan nature. On the other hand, Corpus Christi, woven into the fabric of Texas's Coastal Bend, prides itself on its abundant natural beauty and seaside appeal. Here's a detailed comparison of the two cities.
Distance between
Charlotte, NC and
Corpus Christi, TX : 1,102.2 miles
Charlotte's population is larger by 177%. Its population has grown by 338,881 people (62.7%) since 2000. The population of Corpus Christi has grown by 40,319 people (14.5%) during that time.
Crime rates are subject to change, but according to the most recent statistics, Charlotte tends to have a slightly higher crime rate compared to Corpus Christi. Nonetheless, safety can also depend on the specific neighborhoods one chooses to live in or visit. It’s recommended to research various neighborhoods and stay informed about the local news to ensure safety.
Cost of Living
Generally, the cost of living in Charlotte is slightly higher than in Corpus Christi. Housing, in particular, tends to be more expensive in Charlotte. However, other expenses such as groceries, health care, utilities, and transportation tend to be similar in both cities.
Income Tax
The taxation system also differs considerably. Unlike Texas where there is no state income tax, North Carolina has a flat income tax rate of 5.25%, affecting residents in Charlotte.
Property Tax
Even though Charlotte has higher property prices, Corpus Christi has the higher property tax rate of the two cities.
Sales Tax
North Carolina has a lower state sales tax than Texas, and Charlotte's local sales tax rate is competitive and lower than that in Corpus Christi.
Income
Type
Charlotte
Corpus Christi
Estimated median household income
$70,869
$59,812
Estimated per capita income
$44,593
$29,969
Cost of living index (U.S. average is 100)
93.2
86.6
If you make $50,000 in Corpus Christi, you will have to make $53,811 in Charlotte to maintain the same standard of living.
Geographical Conditions
Charlotte is located inland with a mix of city and rural landscapes, while Corpus Christi is a coastal city, offering beautiful beaches and marine views.
Both cities possess strong educational infrastructures. However, Charlotte's education system is often considered superior, with many high-performing public and private schools and internationally recognized universities, such as the University of North Carolina at Charlotte. Corpus Christi also has strong educational institutions but lacks the variety of higher education options found in Charlotte.
When it comes to work opportunities, Charlotte stands out due to its robust economy. It's home to several Fortune 500 companies, especially in the banking sector. Corpus Christi's economy, on the other hand, relies more on the oil industry, agriculture, and tourism. It's also home to the Port of Corpus Christi, the fifth-largest port in the U.S, which provides numerous jobs.
Biggest Employers
In Charlotte, some of the largest employers include the Carolinas HealthCare System, Wells Fargo, and Bank of America. In Corpus Christi, Christus Spohn Health System, the Corpus Christi Independent School District, and H-E-B Grocery are among the major employers.
In Charlotte (Mecklenburg County), 60.8% voted for Democrats and 38.3% for Republicans in 2012 Presidential Election. In Corpus Christi (Nueces County), 47.6% voted for Democrats and 51.0% for Republicans.
Elections
Type
Democrats
Republicans
Other
Year
Charlotte
Corpus Christi
Charlotte
Corpus Christi
Charlotte
Corpus Christi
2020
66.8%
47.9%
31.6%
50.8%
1.6%
1.4%
2016
62.3%
47.2%
32.9%
48.8%
4.8%
4.0%
2012
60.8%
47.6%
38.3%
51.0%
0.9%
1.4%
2008
62.0%
47.4%
37.6%
51.8%
0.5%
0.8%
2004
51.7%
42.6%
48.0%
56.9%
0.3%
0.4%
2000
48.4%
46.7%
51.1%
51.4%
0.5%
1.9%
1996
48.6%
53.7%
45.9%
40.2%
5.5%
6.1%
Breakdown of population affiliated with a religious congregation
Type
Adherents
Congregations
Religion
Charlotte
Corpus Christi
Charlotte
Corpus Christi
SOUTHERN BAPTIST CONVENTION
9.0%
10.6%
19.0%
28.6%
CATHOLIC CHURCH
8.5%
32.8%
1.8%
10.8%
AMERICAN BAPTIST CHURCHES IN THE USA
2.3%
0.0%
1.1%
0.0%
EPISCOPAL CHURCH
1.2%
0.8%
1.3%
2.0%
EVANGELICAL LUTHERAN CHURCH IN AMERICA
0.9%
0.3%
1.8%
1.1%
PRESBYTERIAN CHURCH IN AMERICA
0.6%
0.0%
1.9%
0.6%
SEVENTH DAY ADVENTIST CHURCH
0.5%
0.2%
1.5%
0.9%
LUTHERAN CHURCH
0.3%
0.5%
0.9%
1.7%
MUSLIM ESTIMATE
0.3%
0.7%
1.2%
0.3%
SALVATION ARMY
0.1%
0.5%
0.4%
0.3%
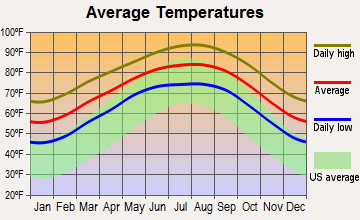
Weather
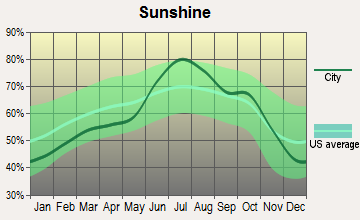
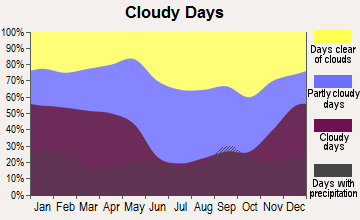
If you are a fan of hot, humid summers and mild, short winters, Charlotte may be a preferred place for you. Corpus Christi, on the other hand, has a typically subtropical climate, characterized by hot, humid summers and mild to cool winters. It also has more sunshine days per year compared to Charlotte.
Weather and climate
Type
Charlotte
Corpus Christi
Temperature - Average
61°F
71.5°F
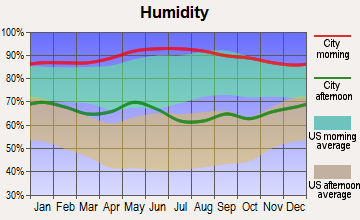
Humidity - Average morning or afternoon humidity
72.3%
81.5%
Humidity - Differences between morning and afternoon humidity
41%
37%
Humidity - Maximum monthly morning or afternoon humidity
87%
93%
Humidity - Minimum monthly morning or afternoon humidity
46%
56%
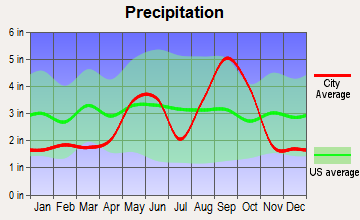
Precipitation - Yearly average
44.5 in
32.6 in
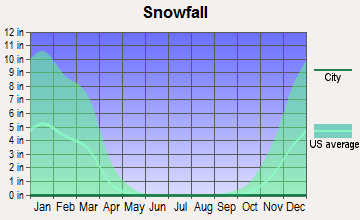
Snowfall - Yearly average
10.2 in
0.2 in
Clouds - Number of days clear of clouds
18.1%
17%
Sunshine amount - Average
69.8%
64.5%
Sunshine amount - Differences during a year
14%
36%
Sunshine amount - Maximum monthly
70%
79%
Sunshine amount - Minimum monthly
56%
43%
Wind speed - Average
6.9 mph
12.7 mph
Average climate in Charlotte, North Carolina
Average climate in Corpus Christi, Texas
Air pollution
Type
AQI
CO
NO2
OZONE
PB
PM10
PM25
SO2
Year
Charlotte
Corpus Christi
Charlotte
Charlotte
Charlotte
Corpus Christi
Charlotte
Charlotte
Charlotte
Corpus Christi
Charlotte
Corpus Christi
2018
75
89
0.24
N/A
6.3
N/A
27.8
23.9
N/A
N/A
15.5
N/A
8.2
9.2
0.2
0.4
2017
77
70
0.25
N/A
7.0
N/A
28.0
27.3
N/A
N/A
16.3
N/A
8.8
8.7
0.2
0.4
2016
82
59
0.25
N/A
7.6
N/A
28.7
26.9
N/A
N/A
N/A
N/A
8.4
8.1
0.2
0.5
2015
76
75
0.25
N/A
8.1
N/A
27.6
25.9
N/A
N/A
N/A
N/A
8.6
9.3
0.2
0.3
2014
76
75
0.26
N/A
8.5
N/A
26.3
26.1
N/A
N/A
N/A
N/A
9.3
9.3
0.3
0.2
2013
71
80
0.29
N/A
8.4
N/A
25.5
27.3
N/A
N/A
N/A
N/A
8.6
8.6
0.3
0.2
2012
95
78
0.28
N/A
8.7
N/A
27.3
28.6
N/A
N/A
N/A
N/A
9.7
8.9
0.3
0.2
2011
94
80
0.34
N/A
10.1
N/A
28.9
29.3
N/A
N/A
N/A
N/A
11.2
10.0
0.6
0.3
2010
97
85
0.33
N/A
11.8
N/A
28.0
27.9
N/A
N/A
N/A
N/A
11.6
9.7
1.0
0.5
2009
82
72
0.30
N/A
10.0
N/A
25.4
26.3
N/A
N/A
N/A
N/A
11.1
9.9
0.9
0.4
2008
102
82
0.32
N/A
11.2
N/A
27.6
26.4
N/A
N/A
N/A
N/A
13.0
10.0
2.1
0.6
2007
108
85
0.37
N/A
13.9
N/A
29.1
25.3
0.001
N/A
N/A
N/A
14.5
10.3
3.0
0.5
2006
107
88
0.44
N/A
13.9
N/A
27.3
27.0
0.000
N/A
N/A
N/A
14.8
10.3
3.3
0.7
2005
109
81
0.53
N/A
14.6
N/A
30.6
24.8
0.000
N/A
N/A
N/A
15.2
10.3
2.7
1.1
2004
89
74
0.53
N/A
14.6
N/A
28.9
26.8
0.001
N/A
N/A
N/A
N/A
N/A
2.8
1.3
2003
85
88
0.57
N/A
15.6
N/A
27.6
27.0
0.003
N/A
N/A
N/A
N/A
N/A
3.0
1.0
2002
103
88
0.63
N/A
15.3
N/A
32.6
27.6
0.003
N/A
N/A
N/A
N/A
N/A
2.7
0.9
2001
108
85
0.72
N/A
17.5
N/A
32.3
26.5
0.005
N/A
N/A
N/A
N/A
N/A
3.9
1.2
2000
107
78
0.79
N/A
18.0
N/A
32.6
25.8
0.014
N/A
N/A
N/A
N/A
N/A
4.4
1.3
Natural disasters
Type
Charlotte
Corpus Christi
Tornado activity compared to U.S. average
111.5%
68.2%
Earthquake activity compared to U.S. average
79%
52%
Natural disasters compared to U.S. average
9%
24%
Transportation
Charlotte boasts a better transit system with a light rail system, buses, and many car rental services. Corpus Christi also has an efficient bus system but lacks the diversity of public transit options found in Charlotte.
Transport
Type
Charlotte
Corpus Christi
Amtrak stations
1
0
Amtrak stations nearby
2
0
FAA registered aircraft
439
298
FAA registered aircraft manufacturers and dealers
12
1
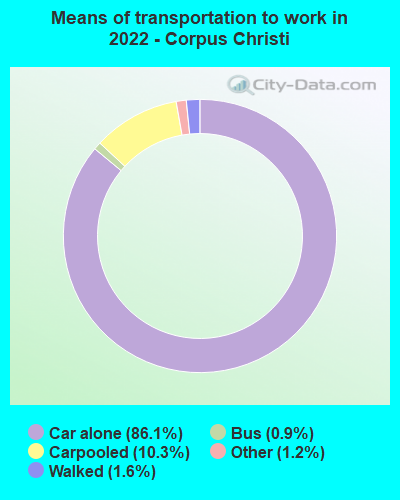
Means of transportation to work
Type
Charlotte
Corpus Christi
Bicycle
0.1%
0.2%
Bus
1.2%
1.1%
Carpooled
8.7%
9.9%
Car alone
86.2%
86.5%
Motorcycle
0.1%
0.2%
Railroad
0.4%
0%
Taxicab
0.2%
0.1%
Walked
1.5%
1.4%
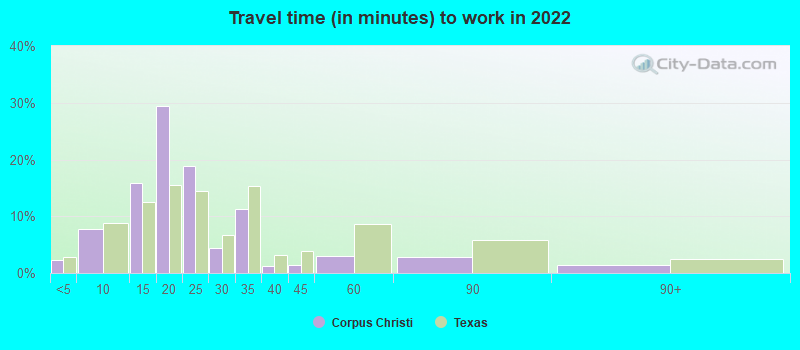
Average travel time to work
Type
Charlotte
Corpus Christi
Average
29.6 min
21.4 min
Other means
24.9 min
20.1 min
Public transportation
44.1 min
37.6 min
Private vehicle occupancy
Type
Charlotte
Corpus Christi
Average
1.2
1.1
Drove alone
90%
90.4%
In 2 person carpool
6.9%
7.6%
In 3 person carpool
1.8%
1.2%
In 4 person carpool
0.8%
0.4%
In 5-6 person carpool
0.5%
0.3%
How many people usually rode to work in the car, truck or van.
Real Estate
The housing market in Charlotte is reasonably competitive with a high demand for homes. In contrast, Corpus Christi has a more relaxed housing market where you may get more house for your money.
Neighborhoods
Both cities boast diverse neighborhoods catering to different lifestyles. Uptown Charlotte is popular for its business buzz and nightlife, while NoDa and Plaza Midwood are known for their artsy vibes and eclectic dining scenes. On the other hand, Ocean Drive and Mustang Island in Corpus Christi offer stunning sea views and serene neighborhoods.
Houses and residents
Type
Charlotte
Corpus Christi
Houses
393,631
137,431
Average household size (people)
2.5
2.7
Median year apartment built
1998
1984
Median year house/condo built
1993
1981
Length of stay in the house since moving in
11.8 years
13.3 years
Houses occupied
365,269 (92.8%)
117,366 (85.4%)
Houses occupied by owners
193,930 (53.1%)
67,874 (57.8%)
Houses occupied by renters
171,339 (46.9%)
49,492 (42.2%)
Median rent asked for vacant for-rent units
$1,482
$1,470
Median monthly housing costs
$1,302
$1,102
Median price asked for vacant for-sale houses and condos
$445,491
$329,579
Estimated median house or condo value
$321,400
$171,500
Median numbers of rooms
5.3
4.9
Median number of rooms in apartments
4
4.1
Median number of rooms in houses and condos
6.6
5.6
Median house price - detached houses
$388,029
$212,792
Median house price - in 2-unit structures
$184,325
$219,111
Median house price - in 3-to-4-unit structures
$178,624
$270,664
Median house price - in 5 or more unit structures
$433,957
$270,817
Median house price - mobile homes
$52,977
$33,205
Median house price - Townhouses or other attached units
$296,370
$168,101
Median house price - All housing units
$378,423
$210,115
Median house age
26
40
Renting percentage
42.6%
40.7%
Housing density (houses/condos per square mile)
1,624.8
888.7
House value disparities
33.3%
37.5%
Household income disparities
44.1%
45%
Median household income for houses/condes with a mortgage
$105,905
$84,755
Median household income for apartments without a mortgage
$70,681
$55,283
Housing units without a mortgage
3,089 (2.1%)
190 (0.5%)
Housing units with both a second mortgage and home equity loan
10,553 (7.2%)
1,163 (3.1%)
Housing units with a mortgage
142,912 (97.9%)
37,907 (99.5%)
Housing units with a home equity loan
171 (0.1%)
0 (0%)
Housing units with a second mortgage
13,532 (9.3%)
1,292 (3.4%)
House/condo owner moved in on average (years ago)
9
11
House/condo renter moved in on average (years ago)
1
1
Housing units lacking complete kitchen facilities
0.8%
2.9%
Housing units lacking complete plumbing facilities
0.2%
2.8%
Housing units in structures
Housing units in structures
Charlotte
Corpus Christi
One, detached
52.7%
65.0%
One, attached
9.1%
1.6%
Two
0.9%
3.0%
3 or 4
2.9%
6.5%
5 to 9
7.1%
8.7%
10 to 19
9.5%
5.7%
20 to 49
6.2%
2.3%
50 or more
10.3%
4.1%
Mobile homes
1.4%
2.8%
Boats, RVs, vans, etc.
0.0%
0.3%
Median real estate property taxes paid for housing units
Self-employed workers in own not incorporated business
25,780
10,817
State government workers
16,519
6,884
Unpaid family workers
1,214
230
Industries and Occupations
With its thriving banking sector, Charlotte offers opportunities primarily in finance, technology, and healthcare. Corpus Christi, conversely, has more employment opportunities in oil and refining industries, healthcare, agriculture, and tourism.
Both cities have excellent healthcare facilities. However, Charlotte has several high-ranking hospitals according to U.S. News, including the Carolinas Medical Center.
Health (county statistics)
Type
Charlotte
Corpus Christi
General health status score of residents in this county from 1 (poor) to 5 (excellent)
Corpus Christi's infrastructure is mainly focused on its coastal areas with an emphasis on tourism and water resources. In contrast, Charlotte has a more diverse infrastructure accommodating its banking sector, technology startups, and the motor sporting industry.
Infrastructure
Type
Charlotte
Corpus Christi
Hospitals
37
34
TV stations
16
21
Arenas or stadiums
3
1
Bank branches located here
202
83
Bank institutions located here
26
17
Main business address for public companies
33
1
Nuclear power plants nearby
2
0
Drinking water stations with no reported violations in the past
24
1
Drinking water stations with reported violations in the past
HMDA - Conventional home purchase loans - Applications denied
Year
Charlotte
Corpus Christi
1999
3,049
1,534
2000
1,568
814
2001
1,382
738
2002
1,275
631
2003
1,879
737
2004
2,415
1,013
2005
3,078
1,275
2006
3,864
1,217
2007
3,106
942
2008
1,287
546
2009
617
413
Culture and Food
Charlotte's food scene mirrors its diversity with southern BBQ, soul food, and international cuisine, while Corpus Christi offers an array of seafood, Tex-Mex and barbeque joints. From cultural institutions like the Mint Museum in Charlotte to the Texas State Aquarium in Corpus Christi, both cities offer rich cultural experiences.
Sports Teams
For sports enthusiasts, Charlotte is home to the Carolina Panthers (NFL), Charlotte Hornets (NBA), and NASCAR Hall of Fame. Corpus Christi doesn't have major league teams but is home to the Corpus Christi Hooks (AA baseball).


 Charlotte, NC
 Corpus Christi, TX