Comparing Charlotte, NC, and Chesapeake, VA, it's clear that both cities provide distinct experiences, benefits, and challenges. Both cities have their own unique characteristics in areas such as crime and safety, weather, cost of living, education, the local economy, and infrastructure. While each city has its own unique industries, major employers, real estate market, and neighborhoods, they also have varying levels of transportation availability, taxes, culture and food, sports teams, geographical conditions, and health care facilities. This comparison will aid prospective residents or tourists in understanding the key features of each city.
Distance between
Charlotte, NC and
Chesapeake, VA : 275.8 miles
Charlotte's population is larger by 250%. Its population has grown by 338,881 people (62.7%) since 2000. The population of Chesapeake has grown by 52,085 people (26.1%) during that time.
Charlotte, NC sees higher levels of crime compared to Chesapeake, VA, creating a more challenging environment in terms of safety. However, Charlotte's crime rates vary greatly by neighborhood, and certain parts of the city are very safe. Chesapeake, VA, on the other hand, is known for its low crime rate and safe community atmosphere, a key interest for those considering a move or a visit.
Cost of Living
Living costs in Charlotte are slightly higher than the national average but lower than in Chesapeake. The primary contributing factors to this discrepancy are housing prices and general expenses, which are relatively higher in Chesapeake. This difference provides a more affordable living situation in Charlotte.
Income Tax
Income tax rates in North Carolina are lower than in Virginia, providing an advantage for those earning a living in Charlotte over Chesapeake.
Property Tax
Property taxes tend to be higher in Chesapeake as compared to Charlotte. This could potentially be a deciding factor for those considering a home purchase in either city.
Sales Tax
Sales tax in Charlotte is roughly 7.25%, which is higher than Chesapeake's 6%. This difference may impact the cost of goods and services in both cities, affecting your overall expenses.
Income
Type
Charlotte
Chesapeake
Estimated median household income
$70,869
$88,815
Estimated per capita income
$44,593
$39,875
Cost of living index (U.S. average is 100)
93.2
96.1
If you make $50,000 in Charlotte, you will have to make $51,556 in Chesapeake to maintain the same standard of living.
Geographical Conditions
Charlotte offers a mix of urban and suburban settings, whereas Chesapeake is renowned for its green spaces and proximity to the Atlantic Ocean.
Both cities boast strong education systems, with Charlotte’s larger size offering a wider variety of schools and universities. Chesapeake's education system, while smaller, consistently receives high scores for quality. Where you choose to relocate or visit may largely depend upon your educational needs.
Charlotte's economy is particularly strong, with a focus on finance, tech, and healthcare, providing numerous job opportunities. Chesapeake has a more mixed economy, with significant contributions from manufacturing, construction, and healthcare sectors. This provides varied employment opportunities for residents.
Biggest Employers
In Charlotte, the biggest employer is Wells Fargo, followed by Atrium Health. Chesapeake's largest employers include Chesapeake Regional Healthcare and the local government.
In Charlotte (Mecklenburg County), 60.8% voted for Democrats and 38.3% for Republicans in 2012 Presidential Election. In Chesapeake (Chesapeake city), 50.1% voted for Democrats and 49.1% for Republicans.
Elections
Type
Democrats
Republicans
Other
Year
Charlotte
Chesapeake
Charlotte
Chesapeake
Charlotte
Chesapeake
2020
66.8%
52.2%
31.6%
45.8%
1.6%
2.0%
2016
62.3%
46.7%
32.9%
48.0%
4.8%
5.3%
2012
60.8%
50.1%
38.3%
49.1%
0.9%
0.8%
2008
62.0%
50.5%
37.6%
49.2%
0.5%
0.3%
2004
51.7%
42.4%
48.0%
57.3%
0.3%
0.3%
2000
48.4%
45.2%
51.1%
53.4%
0.5%
1.4%
1996
48.6%
45.8%
45.9%
46.7%
5.5%
7.5%
Breakdown of population affiliated with a religious congregation
Type
Adherents
Congregations
Religion
Charlotte
Chesapeake
Charlotte
Chesapeake
SOUTHERN BAPTIST CONVENTION
9.0%
10.7%
19.0%
19.1%
CATHOLIC CHURCH
8.5%
5.9%
1.8%
2.5%
AMERICAN BAPTIST CHURCHES IN THE USA
2.3%
0.0%
1.1%
0.5%
EPISCOPAL CHURCH
1.2%
0.4%
1.3%
1.0%
EVANGELICAL LUTHERAN CHURCH IN AMERICA
0.9%
0.1%
1.8%
0.5%
PRESBYTERIAN CHURCH IN AMERICA
0.6%
0.0%
1.9%
0.5%
SEVENTH DAY ADVENTIST CHURCH
0.5%
0.2%
1.5%
2.5%
MUSLIM ESTIMATE
0.3%
1.5%
1.2%
0.5%
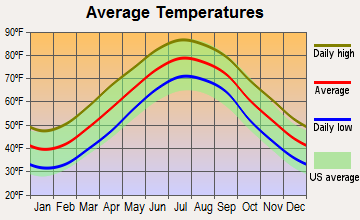
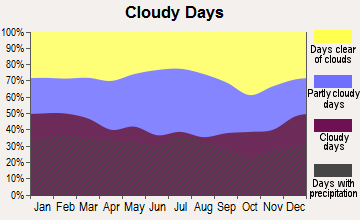
Weather
Charlotte experiences a comfortable year-round climate with hot summers and short, mildly cold winters. Alternatively, Chesapeake, though also warm, experiences more pronounced seasons, with cooler winters. This variation provides a distinct weather experience if you're considering relocating or vacationing.
Weather and climate
Type
Charlotte
Chesapeake
Temperature - Average
61°F
59.5°F
Humidity - Average morning or afternoon humidity
72.3%
73%
Humidity - Differences between morning and afternoon humidity
41%
32%
Humidity - Maximum monthly morning or afternoon humidity
87%
83%
Humidity - Minimum monthly morning or afternoon humidity
46%
51%
Precipitation - Yearly average
44.5 in
48.1 in
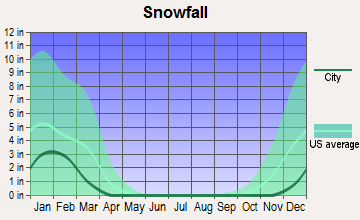
Snowfall - Yearly average
10.2 in
15.4 in
Clouds - Number of days clear of clouds
18.1%
17.6%
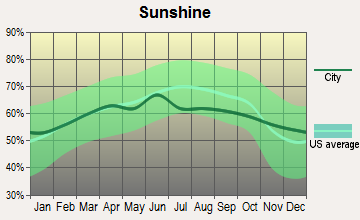
Sunshine amount - Average
69.8%
66.8%
Sunshine amount - Differences during a year
14%
14%
Sunshine amount - Maximum monthly
70%
67%
Sunshine amount - Minimum monthly
56%
53%
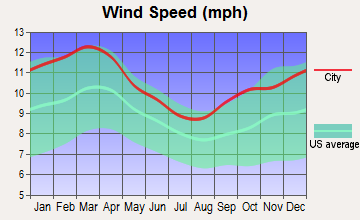
Wind speed - Average
6.9 mph
10.4 mph
Average climate in Charlotte, North Carolina
Average climate in Chesapeake, Virginia
Air pollution
Type
AQI
CO
NO2
OZONE
PB
PM10
PM25
SO2
Year
Charlotte
Chesapeake
Charlotte
Chesapeake
Charlotte
Chesapeake
Charlotte
Chesapeake
Charlotte
Chesapeake
Charlotte
Charlotte
Chesapeake
Charlotte
Chesapeake
2018
75
57
0.24
0.29
6.3
6.7
27.8
30.8
N/A
0.002
15.5
N/A
8.2
6.1
0.2
0.3
2017
77
60
0.25
0.23
7.0
7.3
28.0
32.9
N/A
0.002
16.3
N/A
8.8
6.9
0.2
0.3
2016
82
66
0.25
0.22
7.6
7.0
28.7
31.3
N/A
0.002
N/A
N/A
8.4
6.1
0.2
0.3
2015
76
57
0.25
0.27
8.1
7.8
27.6
33.4
N/A
0.002
N/A
N/A
8.6
6.4
0.2
0.5
2014
76
59
0.26
0.28
8.5
8.0
26.3
33.4
N/A
0.002
N/A
N/A
9.3
6.8
0.3
1.2
2013
71
66
0.29
0.28
8.4
7.5
25.5
30.8
N/A
0.002
N/A
N/A
8.6
6.8
0.3
1.2
2012
95
76
0.28
0.29
8.7
8.2
27.3
34.1
N/A
0.002
N/A
N/A
9.7
8.1
0.3
1.1
2011
94
66
0.34
0.27
10.1
9.9
28.9
34.7
N/A
0.003
N/A
N/A
11.2
8.8
0.6
1.7
2010
97
71
0.33
0.24
11.8
4.8
28.0
38.1
N/A
0.004
N/A
N/A
11.6
N/A
1.0
2.2
2009
82
51
0.30
0.25
10.0
9.7
25.4
31.5
N/A
0.012
N/A
N/A
11.1
N/A
0.9
2.7
2008
102
77
0.32
0.24
11.2
10.3
27.6
36.2
N/A
0.004
N/A
N/A
13.0
N/A
2.1
3.4
2007
108
81
0.37
0.17
13.9
12.2
29.1
36.6
0.001
0.004
N/A
N/A
14.5
N/A
3.0
4.5
2006
107
62
0.44
0.33
13.9
N/A
27.3
36.8
0.000
0.004
N/A
N/A
14.8
N/A
3.3
3.4
2005
109
67
0.53
0.28
14.6
N/A
30.6
35.7
0.000
N/A
N/A
N/A
15.2
N/A
2.7
3.4
2004
89
80
0.53
0.29
14.6
15.9
28.9
33.6
0.001
N/A
N/A
N/A
N/A
N/A
2.8
4.3
2003
85
84
0.57
0.34
15.6
16.2
27.6
34.6
0.003
N/A
N/A
N/A
N/A
N/A
3.0
4.0
2002
103
99
0.63
0.40
15.3
17.8
32.6
38.2
0.003
N/A
N/A
N/A
N/A
N/A
2.7
6.1
2001
108
92
0.72
0.42
17.5
18.2
32.3
36.6
0.005
N/A
N/A
N/A
N/A
N/A
3.9
6.1
2000
107
85
0.79
0.44
18.0
15.7
32.6
36.9
0.014
N/A
N/A
N/A
N/A
N/A
4.4
6.6
Natural disasters
Type
Charlotte
Chesapeake
Tornado activity compared to U.S. average
111.5%
72.4%
Earthquake activity compared to U.S. average
79%
36.3%
Natural disasters compared to U.S. average
9%
0%
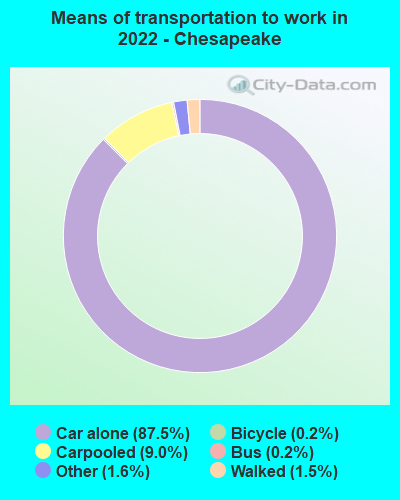
Transportation
Charlotte has robust public transportation options including light rail, buses, and bike sharing. Chesapeake, being a smaller city, has fewer public transit options and most residents rely on cars for commuting.
Transport
Type
Charlotte
Chesapeake
Amtrak stations
1
0
Amtrak stations nearby
2
3
FAA registered aircraft
439
168
FAA registered aircraft manufacturers and dealers
12
3
Means of transportation to work
Type
Charlotte
Chesapeake
Bicycle
0.1%
0.1%
Bus
1.2%
0.3%
Carpooled
8.7%
9.9%
Car alone
86.2%
86.3%
Railroad
0.4%
0%
Taxicab
0.2%
0.1%
Walked
1.5%
2.5%
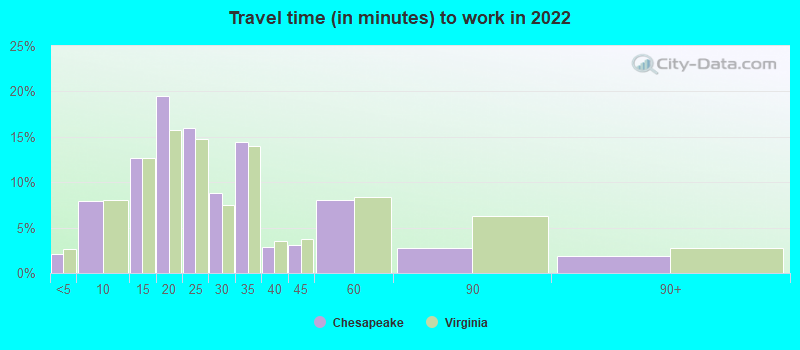
Average travel time to work
Type
Charlotte
Chesapeake
Average
29.6 min
24.7 min
Other means
24.9 min
24.8 min
Public transportation
44.1 min
42 min
Private vehicle occupancy
Type
Charlotte
Chesapeake
Average
1.2
1.1
Drove alone
90%
90.8%
In 2 person carpool
6.9%
7.5%
In 3 person carpool
1.8%
1.2%
In 4 person carpool
0.8%
0.4%
In 5-6 person carpool
0.5%
0.1%
How many people usually rode to work in the car, truck or van.
Real Estate
Charlotte’s real estate is somewhat expensive compared to national averages but cheaper than Chesapeake. Chesapeake's real estate prices are higher, reflecting the city’s desirability and high quality of life.
Neighborhoods
Both cities provide diverse neighborhoods. Charlotte is known for its vibrant downtown and diverse suburban neighborhoods, while Chesapeake boasts calm, family-friendly neighborhoods.
Houses and residents
Type
Charlotte
Chesapeake
Houses
393,631
96,040
Average household size (people)
2.5
2.8
Median year apartment built
1998
1985
Median year house/condo built
1993
1990
Length of stay in the house since moving in
11.8 years
12.2 years
Houses occupied
365,269 (92.8%)
93,849 (97.7%)
Houses occupied by owners
193,930 (53.1%)
69,186 (73.7%)
Houses occupied by renters
171,339 (46.9%)
24,663 (26.3%)
Median rent asked for vacant for-rent units
$1,482
$1,502
Median monthly housing costs
$1,302
$1,483
Median price asked for vacant for-sale houses and condos
$445,491
$319,618
Estimated median house or condo value
$321,400
$320,600
Median numbers of rooms
5.3
6.7
Median number of rooms in apartments
4
4.4
Median number of rooms in houses and condos
6.6
7.5
Median house price - detached houses
$388,029
$345,910
Median house price - in 2-unit structures
$184,325
$123,576
Median house price - in 3-to-4-unit structures
$178,624
$136,311
Median house price - in 5 or more unit structures
$433,957
$134,590
Median house price - mobile homes
$52,977
$35,812
Median house price - Townhouses or other attached units
$296,370
$274,340
Median house price - All housing units
$378,423
$330,444
Median house age
26
33
Renting percentage
42.6%
27%
Housing density (houses/condos per square mile)
1,624.8
281.9
House value disparities
33.3%
27.1%
Household income disparities
44.1%
41%
Median household income for houses/condes with a mortgage
$105,905
$115,958
Median household income for apartments without a mortgage
$70,681
$71,224
Housing units without a mortgage
3,089 (2.1%)
1,697 (3.1%)
Housing units with both a second mortgage and home equity loan
10,553 (7.2%)
4,439 (8.2%)
Housing units with a mortgage
142,912 (97.9%)
52,330 (96.9%)
Housing units with a home equity loan
171 (0.1%)
61 (0.1%)
Housing units with a second mortgage
13,532 (9.3%)
5,413 (10%)
House/condo owner moved in on average (years ago)
9
9
House/condo renter moved in on average (years ago)
1
1
Housing units lacking complete kitchen facilities
0.8%
1.2%
Housing units in structures
Housing units in structures
Charlotte
Chesapeake
One, detached
52.7%
69.6%
One, attached
9.1%
10.4%
Two
0.9%
2.3%
3 or 4
2.9%
2.9%
5 to 9
7.1%
4.6%
10 to 19
9.5%
3.6%
20 to 49
6.2%
2.5%
50 or more
10.3%
2.7%
Mobile homes
1.4%
1.4%
Median real estate property taxes paid for housing units
Self-employed workers in own not incorporated business
25,780
5,430
State government workers
16,519
3,079
Unpaid family workers
1,214
728
Industries and Occupations
Charlotte is a key financial hub of the country, attracting professionals in finance and tech. Chesapeake’s economy is more diverse, with a wide range of careers in industries such as government, manufacturing, and retail.
Charlotte offers a range of quality healthcare facilities, including large hospitals and specialized clinics. Chesapeake provides comprehensive health services with its well-respected healthcare system.
Health (county statistics)
Type
Charlotte
Chesapeake
General health status score of residents in this county from 1 (poor) to 5 (excellent)
Being a larger city, Charlotte boasts a more developed infrastructure, including amenities for residents and tourists. Chesapeake provides well-planned suburban infrastructure, with a focus on residential comfort.
Infrastructure
Type
Charlotte
Chesapeake
Hospitals
37
5
TV stations
16
25
Bank branches located here
202
50
Bank institutions located here
26
15
Main business address for public companies
33
2
Nuclear power plants nearby
2
0
Drinking water stations with no reported violations in the past
24
3
Drinking water stations with reported violations in the past
HMDA - Conventional home purchase loans - Applications denied
Year
Charlotte
Chesapeake
1999
3,049
0
2000
1,568
0
2001
1,382
0
2002
1,275
0
2003
1,879
461
2004
2,415
749
2005
3,078
820
2006
3,864
834
2007
3,106
561
2008
1,287
171
2009
617
75
Culture and Food
Charlotte offers a cosmopolitan culture with plenty of restaurants, events, and activities. Chesapeake typifies Virginia’s mix of southern charm and seaside tranquility, offering a blend of historical and outdoor activities.
Sports Teams
If you're a sports fan, Charlotte might be more appealing, boasting teams like the Carolina Panthers (NFL) and Charlotte Hornets (NBA). Chesapeake, while not home to major league teams, is close enough to larger cities for sports fans to catch games.


 Charlotte, NC
 Chesapeake, VA