When considering relocation or planning a visit, one must weigh the pros and cons of their destination. This comparative analysis of living or visiting Charlotte, North Carolina, and Buffalo, New York offers insight into a variety of factors. These include the safety, weather, cost of living, education system, economic opportunities, infrastructure, local industries, largest employers, real estate market, neighborhoods, transportation, taxes, food and culture, sports teams, geographical features, and healthcare facilities.
Distance between
Charlotte, NC and
Buffalo, NY : 542.3 miles
Charlotte's population is larger by 218%. Its population has grown by 338,881 people (62.7%) since 2000. The population of Buffalo has decreased by 15,841 people (5.4%) during that time.
Both cities focus heavily on ensuring the safety and security of their residents and visitors alike. Charlotte, NC, has a higher crime rate than the national average but is taking measures to reduce it. Buffalo, NY, on the other hand, has a lower crime rate in comparison but still exceeds the national average. Regardless, both cities continually work to improve their safety environments.
Cost of Living
The overall cost of living in Buffalo is lower than Charlotte. Housing is especially affordable in Buffalo, whereas healthcare and transportation tend to be more affordable in Charlotte. These factors can dramatically affect budgeting for potential transplants or long-term visitors.
Income Tax
Residents in both cities are subject to state income tax. However, New York generally has a higher state income tax rate than North Carolina.
Property Tax
Property tax rates in Buffalo are higher than in Charlotte. This could be a significant consideration for anyone looking to purchase property.
Sales Tax
North Carolina’s state sales tax is higher than New York State, but Buffalo residents pay an additional local sales tax. On the other hand, Charlotte doesn't charge extra city sales tax.
Income
Type
Charlotte
Buffalo
Estimated median household income
$70,869
$40,669
Estimated per capita income
$44,593
$27,269
Cost of living index (U.S. average is 100)
93.2
101.9
If you make $50,000 in Charlotte, you will have to make $54,667 in Buffalo to maintain the same standard of living.
Geographical Conditions
Charlotte offers an appealing mix of urban and natural attractions with its accessible parks and Uptown skyscrapers. Buffalo is situated near the Great Lakes, lending the city picturesque landscapes and outdoor attractions.
Both cities offer quality education to their residents. Charlotte-Mecklenburg Schools is one of the highest-rated districts in North Carolina. Buffalo’s public school system has programs for learners of all ages, with various charter schools offering diverse educational experiences.
The booming economy is one of Charlotte’s winning points, with its rapid growth in finance, technology, and healthcare sectors. Buffalo’s economy is stable and diverse, with health and education as the leading sectors. Both cities offer good job prospects depending on your industry preference.
Biggest Employers
In Charlotte, the largest employers include Atrium Health and Wells Fargo. Buffalo's largest employers include Kaleida Health and the University at Buffalo. Each city offers varied opportunities for career pursuit and advancement.
In Charlotte (Mecklenburg County), 60.8% voted for Democrats and 38.3% for Republicans in 2012 Presidential Election. In Buffalo (Erie County), 57.4% voted for Democrats and 41.0% for Republicans.
Elections
Type
Democrats
Republicans
Other
Year
Charlotte
Buffalo
Charlotte
Buffalo
Charlotte
Buffalo
2020
66.8%
56.3%
31.6%
41.6%
1.6%
2.1%
2016
62.3%
51.0%
32.9%
44.5%
4.8%
4.5%
2012
60.8%
57.4%
38.3%
41.0%
0.9%
1.6%
2008
62.0%
58.2%
37.6%
40.6%
0.5%
1.3%
2004
51.7%
56.5%
48.0%
41.5%
0.3%
1.9%
2000
48.4%
56.7%
51.1%
37.8%
0.5%
5.5%
1996
48.6%
54.7%
45.9%
32.3%
5.5%
13.0%
Breakdown of population affiliated with a religious congregation
Type
Adherents
Congregations
Religion
Charlotte
Buffalo
Charlotte
Buffalo
SOUTHERN BAPTIST CONVENTION
9.0%
0.2%
19.0%
2.5%
CATHOLIC CHURCH
8.5%
38.4%
1.8%
15.8%
AMERICAN BAPTIST CHURCHES IN THE USA
2.3%
0.8%
1.1%
3.6%
EPISCOPAL CHURCH
1.2%
0.8%
1.3%
4.4%
EVANGELICAL LUTHERAN CHURCH IN AMERICA
0.9%
1.7%
1.8%
4.9%
PRESBYTERIAN CHURCH IN AMERICA
0.6%
0.0%
1.9%
0.1%
SEVENTH DAY ADVENTIST CHURCH
0.5%
0.1%
1.5%
0.6%
LUTHERAN CHURCH
0.3%
0.9%
0.9%
3.3%
MUSLIM ESTIMATE
0.3%
1.8%
1.2%
1.9%
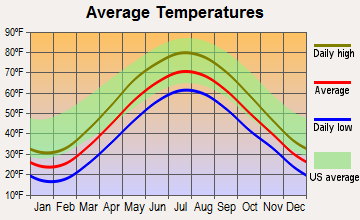
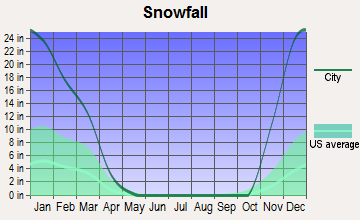
Weather
If weather is a primary concern, Charlotte boasts a temperate climate with hot summers and cool winters, ideal for those who enjoy outdoor activities throughout the year. Buffalo experiences long, cold, and snowy winters and short, comfortable summers, which provides opportunities for winter sports and activities.
Weather and climate
Type
Charlotte
Buffalo
Temperature - Average
61°F
47.7°F
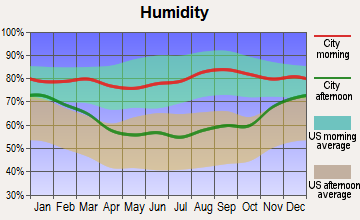
Humidity - Average morning or afternoon humidity
72.3%
76.3%
Humidity - Differences between morning and afternoon humidity
41%
28%
Humidity - Maximum monthly morning or afternoon humidity
87%
83%
Humidity - Minimum monthly morning or afternoon humidity
46%
55%
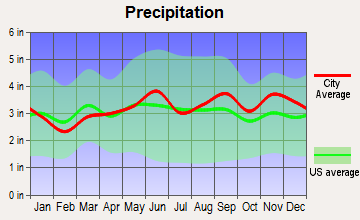
Precipitation - Yearly average
44.5 in
38.7 in
Snowfall - Yearly average
10.2 in
183.7 in
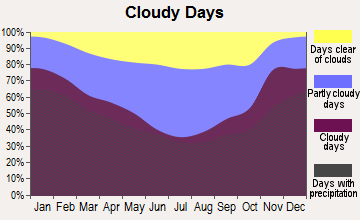
Clouds - Number of days clear of clouds
18.1%
8.9%
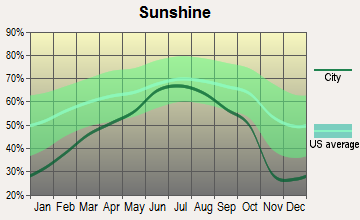
Sunshine amount - Average
69.8%
51.3%
Sunshine amount - Differences during a year
14%
43%
Sunshine amount - Maximum monthly
70%
66%
Sunshine amount - Minimum monthly
56%
23%
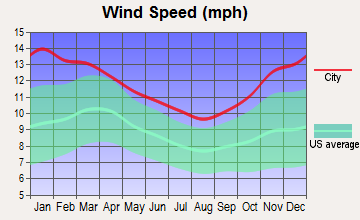
Wind speed - Average
6.9 mph
11.2 mph
Average climate in Charlotte, North Carolina
Average climate in Buffalo, New York
Air pollution
Type
AQI
CO
NO2
OZONE
PB
PM10
PM25
SO2
Year
Charlotte
Buffalo
Charlotte
Buffalo
Charlotte
Buffalo
Charlotte
Buffalo
Charlotte
Buffalo
Charlotte
Charlotte
Buffalo
Charlotte
Buffalo
2018
75
62
0.24
0.26
6.3
N/A
27.8
30.2
N/A
N/A
15.5
N/A
8.2
7.5
0.2
0.4
2017
77
68
0.25
0.32
7.0
N/A
28.0
29.8
N/A
N/A
16.3
N/A
8.8
7.5
0.2
0.4
2016
82
71
0.25
0.30
7.6
N/A
28.7
31.7
N/A
N/A
N/A
N/A
8.4
7.7
0.2
0.5
2015
76
69
0.25
0.35
8.1
N/A
27.6
30.2
N/A
N/A
N/A
N/A
8.6
8.8
0.2
1.1
2014
76
69
0.26
0.39
8.5
N/A
26.3
30.7
N/A
N/A
N/A
N/A
9.3
8.6
0.3
1.5
2013
71
73
0.29
0.33
8.4
N/A
25.5
31.4
N/A
N/A
N/A
N/A
8.6
9.0
0.3
2.4
2012
95
83
0.28
0.34
8.7
6.4
27.3
30.5
N/A
N/A
N/A
N/A
9.7
9.4
0.3
2.7
2011
94
82
0.34
0.41
10.1
8.3
28.9
28.8
N/A
N/A
N/A
N/A
11.2
8.9
0.6
2.0
2010
97
85
0.33
0.35
11.8
8.3
28.0
30.6
N/A
N/A
N/A
N/A
11.6
10.3
1.0
1.5
2009
82
78
0.30
0.28
10.0
7.4
25.4
28.7
N/A
N/A
N/A
N/A
11.1
9.8
0.9
1.7
2008
102
90
0.32
0.36
11.2
9.5
27.6
29.5
N/A
N/A
N/A
N/A
13.0
11.4
2.1
2.3
2007
108
97
0.37
0.38
13.9
10.2
29.1
29.5
0.001
N/A
N/A
N/A
14.5
12.4
3.0
2.7
2006
107
76
0.44
0.38
13.9
10.5
27.3
27.4
0.000
N/A
N/A
N/A
14.8
N/A
3.3
2.8
2005
109
94
0.53
0.41
14.6
12.3
30.6
29.7
0.000
N/A
N/A
N/A
15.2
N/A
2.7
3.8
2004
89
76
0.53
0.43
14.6
11.9
28.9
27.6
0.001
N/A
N/A
N/A
N/A
N/A
2.8
3.4
2003
85
89
0.57
0.50
15.6
13.0
27.6
27.6
0.003
0.005
N/A
N/A
N/A
N/A
3.0
5.5
2002
103
100
0.63
0.46
15.3
13.4
32.6
30.5
0.003
0.008
N/A
N/A
N/A
N/A
2.7
5.8
2001
108
93
0.72
0.46
17.5
15.2
32.3
27.9
0.005
0.021
N/A
N/A
N/A
N/A
3.9
7.2
2000
107
85
0.79
0.53
18.0
15.3
32.6
25.6
0.014
0.023
N/A
N/A
N/A
N/A
4.4
6.8
Natural disasters
Type
Charlotte
Buffalo
Tornado activity compared to U.S. average
111.5%
26.3%
Earthquake activity compared to U.S. average
79%
32.9%
Natural disasters compared to U.S. average
9%
22%
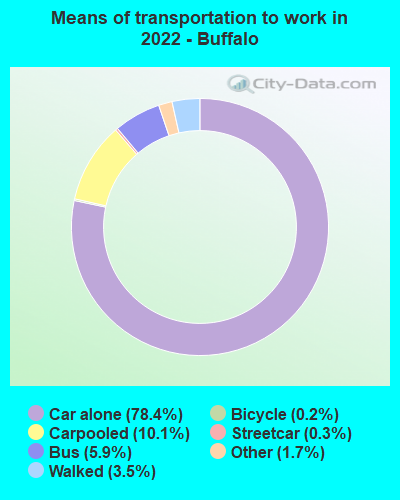
Transportation
Charlotte has an efficient public transportation system that includes buses, trains, and bike shares. Buffalo also has a strong public transit system, with buses and light rail, and tends to have shorter commute times.
Transport
Type
Charlotte
Buffalo
Amtrak stations
1
0
Amtrak stations nearby
2
3
FAA registered aircraft
439
87
FAA registered aircraft manufacturers and dealers
12
1
Means of transportation to work
Type
Charlotte
Buffalo
Bicycle
0.1%
0.5%
Bus
1.2%
5.8%
Carpooled
8.7%
7.8%
Car alone
86.2%
80.5%
Railroad
0.4%
0.2%
Streetcar
0%
0.3%
Subway
0%
0.6%
Taxicab
0.2%
0.3%
Walked
1.5%
3.1%
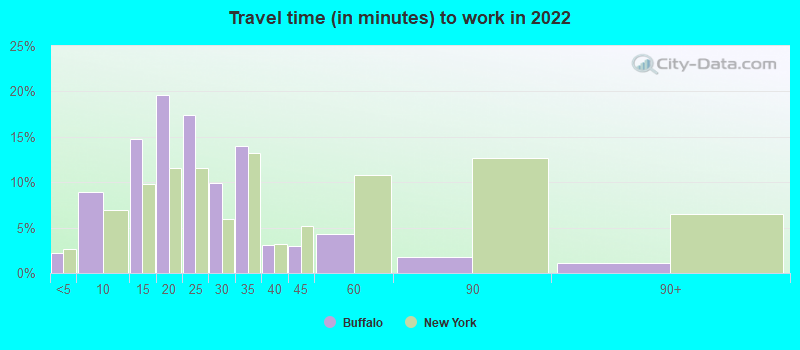
Average travel time to work
Type
Charlotte
Buffalo
Average
29.6 min
23.8 min
Other means
24.9 min
19.9 min
Public transportation
44.1 min
36.6 min
Private vehicle occupancy
Type
Charlotte
Buffalo
Average
1.2
1.1
Drove alone
90%
89.9%
In 2 person carpool
6.9%
6.9%
In 3 person carpool
1.8%
2.6%
In 4 person carpool
0.8%
0.3%
In 5-6 person carpool
0.5%
0.2%
How many people usually rode to work in the car, truck or van.
Real Estate
The real estate markets in Charlotte and Buffalo are different, with Charlotte having a higher median home value. Buffalo’s market is more affordable but isn’t growing as fast as Charlotte's.
Neighborhoods
Both cities offer diverse neighborhoods with their distinct characters. From the stylish Uptown of Charlotte to the historic Allentown of Buffalo, there's a place for every lifestyle.
Houses and residents
Type
Charlotte
Buffalo
Houses
393,631
137,222
Average household size (people)
2.5
2.2
Length of stay in the house since moving in
11.8 years
15.8 years
Houses occupied
365,269 (92.8%)
122,569 (89.3%)
Houses occupied by owners
193,930 (53.1%)
54,108 (44.1%)
Houses occupied by renters
171,339 (46.9%)
68,461 (55.9%)
Median rent asked for vacant for-rent units
$1,482
$372.33
Median monthly housing costs
$1,302
$812
Median price asked for vacant for-sale houses and condos
$445,491
$283,454
Estimated median house or condo value
$321,400
$155,200
Median numbers of rooms
5.3
5.6
Median number of rooms in apartments
4
4.9
Median number of rooms in houses and condos
6.6
6.5
Median house price - detached houses
$388,029
$160,989
Median house price - in 2-unit structures
$184,325
$176,595
Median house price - in 3-to-4-unit structures
$178,624
$166,381
Median house price - in 5 or more unit structures
$433,957
$451,923
Median house price - mobile homes
$52,977
$51,009
Median house price - Townhouses or other attached units
$296,370
$280,424
Median house price - All housing units
$378,423
$172,704
Median house age
26
2,021
Renting percentage
42.6%
59.3%
Housing density (houses/condos per square mile)
1,624.8
3,378.8
House value disparities
33.3%
44.5%
Household income disparities
44.1%
50.4%
Median household income for houses/condes with a mortgage
$105,905
$78,318
Median household income for apartments without a mortgage
$70,681
$50,382
Housing units without a mortgage
3,089 (2.1%)
2,243 (7.7%)
Housing units with both a second mortgage and home equity loan
10,553 (7.2%)
1,953 (6.7%)
Housing units with a mortgage
142,912 (97.9%)
26,930 (92.3%)
Housing units with a home equity loan
171 (0.1%)
69 (0.2%)
Housing units with a second mortgage
13,532 (9.3%)
2,377 (8.1%)
House/condo owner moved in on average (years ago)
9
16
House/condo renter moved in on average (years ago)
1
3
Housing units lacking complete kitchen facilities
0.8%
5.5%
Housing units lacking complete plumbing facilities
0.2%
1.9%
Housing units in structures
Housing units in structures
Charlotte
Buffalo
One, detached
52.7%
39.4%
One, attached
9.1%
2.7%
Two
0.9%
34.2%
3 or 4
2.9%
8.0%
5 to 9
7.1%
3.3%
10 to 19
9.5%
2.6%
20 to 49
6.2%
3.4%
50 or more
10.3%
6.1%
Mobile homes
1.4%
0.0%
Boats, RVs, vans, etc.
0.0%
0.2%
Median real estate property taxes paid for housing units
Self-employed workers in own not incorporated business
25,780
5,576
State government workers
16,519
6,135
Unpaid family workers
1,214
313
Industries and Occupations
Charlotte is home to a thriving financial sector, with Bank of America's headquarters and a significant presence of Wells Fargo. Buffalo has a broad economic base, with a greater emphasis on healthcare, education, and manufacturing.
Both cities have well-equipped healthcare facilities. Charlotte's Atrium Health and Novant Health, and Buffalo's Kaleida Health are just a few to mention. Quality healthcare is accessible in both cities.
Health (county statistics)
Type
Charlotte
Buffalo
General health status score of residents in this county from 1 (poor) to 5 (excellent)
Charlotte's infrastructure is modern and continuously developing with a focus on sustainability. Buffalo, with its historic roots, combines vintage architecture with modern improvements to infrastructure, providing a unique, urban aesthetic.
Infrastructure
Type
Charlotte
Buffalo
Hospitals
37
15
TV stations
16
14
Arenas or stadiums
3
2
Bank branches located here
202
69
Bank institutions located here
26
10
Main business address for public companies
33
6
Nuclear power plants nearby
2
0
Drinking water stations with no reported violations in the past
24
4
Drinking water stations with reported violations in the past
HMDA - Conventional home purchase loans - Applications denied
Year
Charlotte
Buffalo
1999
3,049
426
2000
1,568
620
2001
1,382
559
2002
1,275
407
2003
1,879
335
2004
2,415
468
2005
3,078
447
2006
3,864
701
2007
3,106
619
2008
1,287
316
2009
617
105
Culture and Food
Charlotte boasts of a diverse culinary scene, innovative breweries, and a vibrant arts scene. Buffalo equally holds its head high with a variety of ethnic cuisines, rich history, and plenty of cultural attractions.
Sports Teams
Both cities are cheered on by passionate fans. Charlotte boasts the NFL's Panthers and the NBA's Hornets, while Buffalo roars with NHL's Sabres and NFL's Bills.


 Charlotte, NC
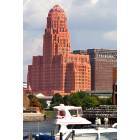
 Buffalo, NY