Comparing Charlotte, North Carolina, and Birmingham, Alabama, paves the way to understanding the unique contrasts and similarities these two southeastern cities share. Both cities hold historical significance, rich cultural scenes, and thriving business sectors, but each also retains its distinctive advantages. Whether considering relocation or planning a short trip, knowing how they stack up against each other in factors like crime, economy, transportation, education, culture, taxation, can present complex behavioral patterns of each city.
Distance between
Charlotte, NC and
Birmingham, AL : 360.4 miles
Charlotte's population is larger by 345%. Its population has grown by 338,881 people (62.7%) since 2000. The population of Birmingham has decreased by 45,245 people (18.6%) during that time.
Both cities have higher crime rates compared to the national average. Birmingham falls in the higher range, consistently being ranked among the most dangerous cities in the US. Violent crime is particularly high, which may deter potential residents and tourists. In comparison, Charlotte does have crime, but it is largely localized to specific areas and less common overall.
Cost of Living
When it comes to affordability, Birmingham generally has a lower cost of living compared to Charlotte. On average, housing costs, groceries, and utilities are cheaper; however, healthcare costs in Birmingham are a bit higher than national averages. In Charlotte, while the cost of living is higher than Birmingham, it is still lower than the national average.
Income Tax
Charlotte residents pay both a flat state and city income taxes of 5.25%. On the contrary, Birmingham, Alabama, imposes a marginal tax rate of 5% at the state level and an additional flat tax rate at the city level.
Property Tax
Both cities also have property taxes, but those are significantly lower in Birmingham. Homes in Birmingham have an average property tax of around 0.6%, while in Charlotte, that rate is closer to 1%.
Sales Tax
Both cities have their fair share of taxes. Charlotte, in North Carolina, imposes a combined state and local sales tax rate of 7.25%. Birmingham, Alabama, has an even higher combined rate of around 10%.
Income
Type
Charlotte
Birmingham
Estimated median household income
$70,869
$36,614
Estimated per capita income
$44,593
$27,211
Cost of living index (U.S. average is 100)
93.2
87.1
If you make $50,000 in Birmingham, you will have to make $53,502 in Charlotte to maintain the same standard of living.
Geographical Conditions
Charlotte is characterized by its hilly terrain and lush greenery, offering several nature parks and lakes. Conversely, Birmingham is located in the Appalachian Mountains, offering rolling hills and plentiful outdoor hiking options.
Considering education, Charlotte has a prominent edge. Home to prestigious universities like the University of North Carolina at Charlotte, the city is known for its strong academic reputation. Birmingham also has educational institutions like the University of Alabama, but its education outcomes are generally lower.
Economically, Charlotte holds a significant upper hand. The city is a major banking and financial center, the second-largest in the country. Birmingham has a more diversified economy, with a notable presence in healthcare and business services. However, Charlotte generally offers more job opportunities and a higher average salary.
Biggest Employers
In Charlotte, Bank of America, Wells Fargo, and Atrium Health are among the biggest employers. Birmingham's largest employers include University of Alabama at Birmingham, Regions Financial Corporation, and Children's of Alabama.
In Charlotte (Mecklenburg County), 60.8% voted for Democrats and 38.3% for Republicans in 2012 Presidential Election. In Birmingham (Jefferson County), 52.7% voted for Democrats and 46.7% for Republicans.
Elections
Type
Democrats
Republicans
Other
Year
Charlotte
Birmingham
Charlotte
Birmingham
Charlotte
Birmingham
2020
66.8%
55.8%
31.6%
42.6%
1.6%
1.6%
2016
62.3%
51.6%
32.9%
44.3%
4.8%
4.1%
2012
60.8%
52.7%
38.3%
46.7%
0.9%
0.5%
2008
62.0%
52.6%
37.6%
47.4%
0.5%
0.0%
2004
51.7%
45.3%
48.0%
54.3%
0.3%
0.3%
2000
48.4%
47.6%
51.1%
50.8%
0.5%
1.6%
1996
48.6%
46.1%
45.9%
50.2%
5.5%
3.7%
Breakdown of population affiliated with a religious congregation
Type
Adherents
Congregations
Religion
Charlotte
Birmingham
Charlotte
Birmingham
SOUTHERN BAPTIST CONVENTION
9.0%
28.2%
19.0%
22.7%
CATHOLIC CHURCH
8.5%
8.4%
1.8%
2.7%
AMERICAN BAPTIST CHURCHES IN THE USA
2.3%
0.0%
1.1%
0.0%
EPISCOPAL CHURCH
1.2%
2.1%
1.3%
1.4%
EVANGELICAL LUTHERAN CHURCH IN AMERICA
0.9%
0.1%
1.8%
0.3%
PRESBYTERIAN CHURCH IN AMERICA
0.6%
1.4%
1.9%
1.1%
SEVENTH DAY ADVENTIST CHURCH
0.5%
0.6%
1.5%
1.2%
MUSLIM ESTIMATE
0.3%
0.5%
1.2%
0.6%
Weather
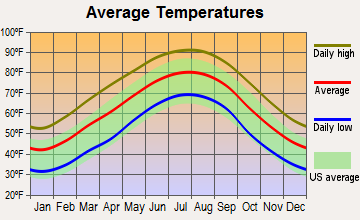
Climate-wise, both cities enjoy a subtropical climate. However, Birmingham is a bit warmer, experiencing humid, hot summers and mild to cool winters. Charlotte is slightly cooler with abundant rainfall throughout the year. Notably, Charlotte experiences more change of seasons, making it attractive for people who love witnessing fall foliage.
Weather and climate
Type
Charlotte
Birmingham
Temperature - Average
61°F
62.1°F
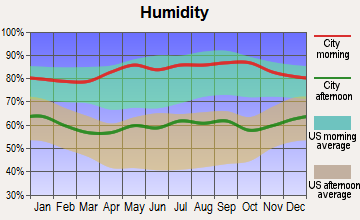
Humidity - Average morning or afternoon humidity
72.3%
75.5%
Humidity - Differences between morning and afternoon humidity
41%
38%
Humidity - Maximum monthly morning or afternoon humidity
87%
88%
Humidity - Minimum monthly morning or afternoon humidity
46%
50%
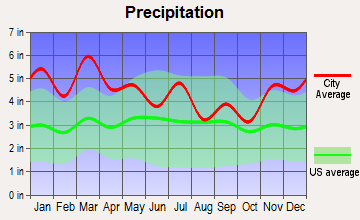
Precipitation - Yearly average
44.5 in
53.2 in
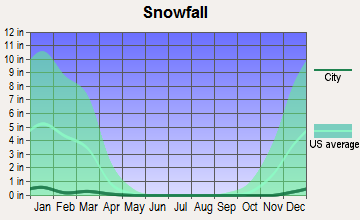
Snowfall - Yearly average
10.2 in
3.4 in
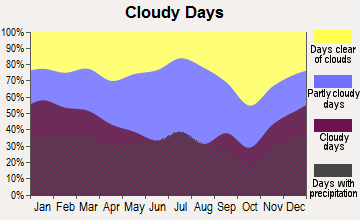
Clouds - Number of days clear of clouds
18.1%
16.4%
Sunshine amount - Average
69.8%
63.4%
Sunshine amount - Differences during a year
14%
21%
Sunshine amount - Maximum monthly
70%
67%
Sunshine amount - Minimum monthly
56%
46%
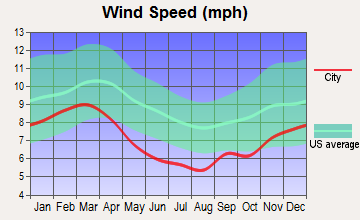
Wind speed - Average
6.9 mph
6.7 mph
Average climate in Charlotte, North Carolina
Average climate in Birmingham, Alabama
Air pollution
Type
AQI
CO
NO2
OZONE
PB
PM10
PM25
SO2
Year
Charlotte
Birmingham
Charlotte
Birmingham
Charlotte
Birmingham
Charlotte
Birmingham
Charlotte
Charlotte
Birmingham
Charlotte
Birmingham
Charlotte
Birmingham
2018
75
83
0.24
0.29
6.3
9.6
27.8
26.2
N/A
N/A
15.5
18.9
8.2
10.5
0.2
2.3
2017
77
91
0.25
0.35
7.0
10.0
28.0
24.2
N/A
N/A
16.3
18.9
8.8
11.0
0.2
2.7
2016
82
87
0.25
0.34
7.6
12.1
28.7
27.6
N/A
N/A
N/A
19.7
8.4
10.4
0.2
1.1
2015
76
84
0.25
0.33
8.1
10.9
27.6
24.5
N/A
N/A
N/A
19.3
8.6
10.6
0.2
1.1
2014
76
84
0.26
0.29
8.5
11.7
26.3
24.1
N/A
N/A
N/A
21.3
9.3
11.4
0.3
1.1
2013
71
82
0.29
0.22
8.4
N/A
25.5
21.4
N/A
N/A
N/A
19.2
8.6
10.9
0.3
1.2
2012
95
92
0.28
0.28
8.7
N/A
27.3
24.4
N/A
N/A
N/A
21.8
9.7
11.5
0.3
1.6
2011
94
104
0.34
0.33
10.1
N/A
28.9
24.9
N/A
N/A
N/A
24.3
11.2
13.0
0.6
1.9
2010
97
101
0.33
0.24
11.8
N/A
28.0
24.1
N/A
N/A
N/A
25.6
11.6
12.9
1.0
N/A
2009
82
94
0.30
0.51
10.0
N/A
25.4
21.5
N/A
N/A
N/A
25.1
11.1
12.5
0.9
N/A
2008
102
105
0.32
0.72
11.2
N/A
27.6
23.9
N/A
N/A
N/A
32.2
13.0
15.2
2.1
N/A
2007
108
124
0.37
0.82
13.9
N/A
29.1
24.6
0.001
N/A
N/A
41.6
14.5
17.5
3.0
N/A
2006
107
131
0.44
1.16
13.9
N/A
27.3
24.0
0.000
N/A
N/A
33.2
14.8
18.0
3.3
N/A
2005
109
131
0.53
0.95
14.6
N/A
30.6
21.8
0.000
N/A
N/A
38.0
15.2
18.4
2.7
N/A
2004
89
116
0.53
0.68
14.6
N/A
28.9
19.1
0.001
N/A
N/A
39.7
N/A
17.1
2.8
N/A
2003
85
123
0.57
0.53
15.6
N/A
27.6
18.2
0.003
N/A
N/A
42.1
N/A
16.1
3.0
N/A
2002
103
133
0.63
0.70
15.3
N/A
32.6
21.2
0.003
N/A
N/A
37.1
N/A
17.2
2.7
N/A
2001
108
175
0.72
1.69
17.5
N/A
32.3
19.6
0.005
N/A
N/A
32.3
N/A
N/A
3.9
N/A
2000
107
136
0.79
1.35
18.0
N/A
32.6
23.3
0.014
N/A
N/A
38.3
N/A
N/A
4.4
N/A
Natural disasters
Type
Charlotte
Birmingham
Tornado activity compared to U.S. average
111.5%
252.3%
Earthquake activity compared to U.S. average
79%
229.7%
Natural disasters compared to U.S. average
9%
32%
Transportation
Charlotte comes with an advantage, offering more diverse public transit options like light rail, streetcars, and buses. On the other hand, Birmingham relies mostly on buses and is not as well-connected in terms of public transportation.
Transport
Type
Charlotte
Birmingham
Amtrak stations
1
1
Amtrak stations nearby
2
1
FAA registered aircraft
439
358
FAA registered aircraft manufacturers and dealers
12
4
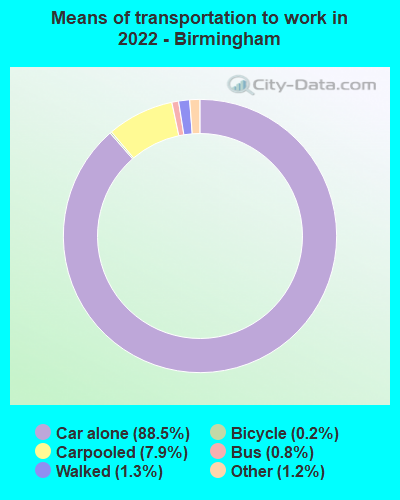
Means of transportation to work
Type
Charlotte
Birmingham
Bicycle
0.1%
0.2%
Bus
1.2%
0.4%
Carpooled
8.7%
7.4%
Car alone
86.2%
89.4%
Railroad
0.4%
0%
Taxicab
0.2%
0.2%
Walked
1.5%
1.1%
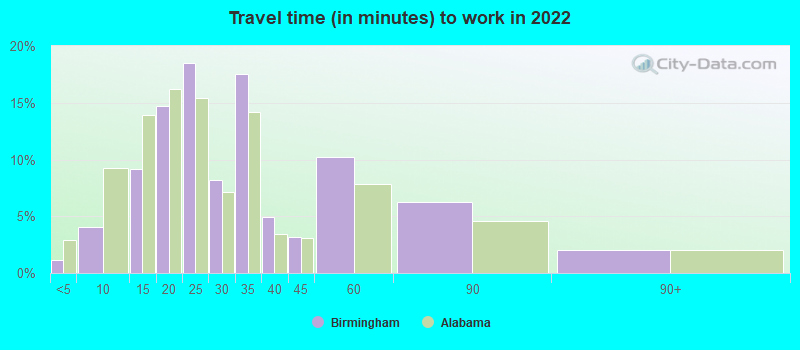
Average travel time to work
Type
Charlotte
Birmingham
Average
29.6 min
29.2 min
Other means
24.9 min
22.9 min
Public transportation
44.1 min
47 min
Private vehicle occupancy
Type
Charlotte
Birmingham
Average
1.2
1.2
Drove alone
90%
90.6%
In 2 person carpool
6.9%
7.4%
In 3 person carpool
1.8%
0.5%
In 4 person carpool
0.8%
0.6%
In 5-6 person carpool
0.5%
0.3%
In 7+ person carpool
0.1%
0.6%
How many people usually rode to work in the car, truck or van.
Real Estate
Charlotte's real estate market is more expensive but also more active compared to Birmingham's. Housing values are generally increasing in Charlotte, whereas in Birmingham, they have remained fairly stable over the years.
Neighborhoods
Charlotte offers an array of diverse neighborhoods, from the bustling Uptown to the arts-oriented NoDa. Birmingham also has unique neighborhoods like Five Points South, known for its excellent dining scene. Both cities provide various neighborhood flavors for different lifestyles.
Houses and residents
Type
Charlotte
Birmingham
Houses
393,631
108,533
Average household size (people)
2.5
2.3
Median year apartment built
1998
1973
Median year house/condo built
1993
1959
Length of stay in the house since moving in
11.8 years
17.5 years
Houses occupied
365,269 (92.8%)
87,570 (80.7%)
Houses occupied by owners
193,930 (53.1%)
40,665 (46.4%)
Houses occupied by renters
171,339 (46.9%)
46,905 (53.6%)
Median rent asked for vacant for-rent units
$1,482
$620.56
Median monthly housing costs
$1,302
$820
Median price asked for vacant for-sale houses and condos
$445,491
$51,535
Estimated median house or condo value
$321,400
$117,600
Median numbers of rooms
5.3
5.2
Median number of rooms in apartments
4
4.5
Median number of rooms in houses and condos
6.6
6.2
Median house price - detached houses
$388,029
$178,184
Median house price - in 2-unit structures
$184,325
$97,076
Median house price - in 3-to-4-unit structures
$178,624
$231,741
Median house price - in 5 or more unit structures
$433,957
$220,662
Median house price - mobile homes
$52,977
$47,467
Median house price - Townhouses or other attached units
$296,370
$189,730
Median house price - All housing units
$378,423
$184,367
Median house age
26
57
Renting percentage
42.6%
50.7%
Housing density (houses/condos per square mile)
1,624.8
724
House value disparities
33.3%
42.2%
Household income disparities
44.1%
50.2%
Median household income for houses/condes with a mortgage
$105,905
$63,812
Median household income for apartments without a mortgage
$70,681
$42,701
Housing units without a mortgage
3,089 (2.1%)
652 (3.2%)
Housing units with both a second mortgage and home equity loan
10,553 (7.2%)
837 (4%)
Housing units with a mortgage
142,912 (97.9%)
20,029 (96.8%)
Housing units with a home equity loan
171 (0.1%)
0 (0%)
Housing units with a second mortgage
13,532 (9.3%)
1,439 (7%)
House/condo owner moved in on average (years ago)
9
18
House/condo renter moved in on average (years ago)
1
1
Housing units lacking complete kitchen facilities
0.8%
5.3%
Housing units lacking complete plumbing facilities
0.2%
4.4%
Housing units in structures
Housing units in structures
Charlotte
Birmingham
One, detached
52.7%
59.4%
One, attached
9.1%
2.1%
Two
0.9%
1.8%
3 or 4
2.9%
6.3%
5 to 9
7.1%
9.3%
10 to 19
9.5%
8.0%
20 to 49
6.2%
6.3%
50 or more
10.3%
6.1%
Mobile homes
1.4%
0.7%
Median real estate property taxes paid for housing units
Self-employed workers in own not incorporated business
25,780
4,375
State government workers
16,519
5,819
Unpaid family workers
1,214
158
Industries and Occupations
Charlotte offers opportunities in finance, technology, transportation, and healthcare, among other fields. Birmingham's economy draws mostly from healthcare, manufacturing, and education sectors. Overall, Charlotte seems to provide more diverse job prospects across various industries.
Charlotte is home to renowned healthcare institutions like Atrium Health and Novant Health. Birmingham is a healthcare focus as well, home to the University of Alabama's medical division which provides high-quality healthcare services.
Health (county statistics)
Type
Charlotte
Birmingham
General health status score of residents in this county from 1 (poor) to 5 (excellent)
Charlotte boasts more developed infrastructure, with a modern skyline, sports facilities, museums, and public parks. Birmingham also has decent infrastructure, although not quite as expansive as that in Charlotte. It has a distinct historical charm with artsy neighborhoods and refurbished loft areas.
Infrastructure
Type
Charlotte
Birmingham
Hospitals
37
34
TV stations
16
17
Arenas or stadiums
3
5
Bank branches located here
202
124
Bank institutions located here
26
24
Main business address for public companies
33
31
Nuclear power plants nearby
2
0
Drinking water stations with no reported violations in the past
24
0
Drinking water stations with reported violations in the past
HMDA - Conventional home purchase loans - Applications denied
Year
Charlotte
Birmingham
1999
3,049
834
2000
1,568
835
2001
1,382
699
2002
1,275
548
2003
1,879
670
2004
2,415
928
2005
3,078
1,149
2006
3,864
1,235
2007
3,106
914
2008
1,287
426
2009
617
141
Culture and Food
Culture and food are dynamic in both cities. Charlotte is a melting pot of different cultures, reflected in its diverse food scene, from upscale dining to international cuisine. Birmingham, known as "Food City," has a deep Southwest culinary heritage with classic comfort foods and gourmet dining.
Sports Teams
In terms of sport, Charlotte is home to the Carolina Panthers (NFL) and Charlotte Hornets (NBA). Birmingham does not have major league teams but is home to minor league teams and hosts SEC (Southeastern Conference) games.


 Charlotte, NC
 Birmingham, AL