Central Contra Costa, CA, and Santa Clara, CA, are both vibrant Californian counties that offer different experiences for their residents and visitors. Both regions boast unique attributes, from sunny climates and favorable working conditions to distinct cultures and scenic neighborhoods. In the upcoming analysis, we will compare the two areas across various key indicators, which include crime and safety, weather, cost of living, education, work and economy, infrastructure, and others.
Santa Clara is generally considered safer than Central Contra Costa when it comes to crime rates. According to recent statistics, the crime rate in Santa Clara is lower than the national average. Central Contra Costa has seen a moderate crime rate, slightly higher than Santa Clara, but still below larger metropolitan areas lessening concerns for both residents and tourists. However, it’s always crucial to stay aware and cautious in any location.
Cost of Living
The cost of living in Santa Clara is generally higher than in Central Contra Costa. This is primarily due to the higher housing costs in Santa Clara given its proximity to the Silicon Valley and the resultant high average salaries. Grocery, healthcare, and transportation costs also tend to be higher in Santa Clara compared to Central Contra Costa.
Income Tax
California has a progressive state income tax, which applies to both Santa Clara and Central Contra Costa counties. The rate ranges from 1% to 13.3%, depending on income level. There are no specific city taxes on income.
Property Tax
The average property tax rate in Santa Clara County is 0.76%, slightly lower than the average in Contra Costa County, which is 0.81%. However, due to higher home prices in Santa Clara, homeowners often wind up paying more in property taxes.
Sales Tax
California's state sales tax is consistent across cities, which means that the rate in Santa Clara and Central Contra Costa is the same at 7.25%. However, some cities impose additional local taxes - for example, Santa Clara has an effective sales tax rate of 9.25%, while Concord (in Contra Costa County) has a rate of 9.5%.
Income
Type
Central Contra Costa
Santa Clara
Estimated median household income
$127,452
$155,238
Estimated per capita income
$68,702
$76,123
Cost of living index (U.S. average is 100)
139.1
131.6
If you make $50,000 in Santa Clara, you will have to make $52,850 in Central Contra Costa to maintain the same standard of living.
Geographical Conditions
Geographically, Santa Clara is a flat region located in the southern part of the San Francisco Bay Area. Central Contra Costa, meanwhile, is a mix of flatland and hillside terrain extending eastwards from the inner East Bay.
Geographical information
Type
Central Contra Costa
Santa Clara
Land area
261.3 sq. miles
18.4 sq. miles
Population density
1,863.4 people per sq. mile
6,914.2 people per sq. mile
Relative area comparison
Central Contra Costa, CA Santa Clara, CA
Education
Both regions are home to excellent educational institutions. Santa Clara County is known for its prestigious universities such as Santa Clara University and the University of California, Santa Cruz. Central Contra Costa also has great community colleges and high schools. For families with school-going children, both areas offer good public and private school options.
Santa Clara, being part of Silicon Valley, thrives in the tech industry, with many residents working in this sector. Central Contra Costa, while also having its share of tech companies, is more diverse with healthcare, education, and government sectors also playing significant roles in its economy. Job opportunities and average salaries are generally higher in Santa Clara due to the presence of many tech giants.
Biggest Employers
Santa Clara's biggest employers include tech giants like Intel, Nvidia, and Applied Materials. In Central Contra Costa, Kaiser Permanente, Mt. Diablo Unified School District, and Bank of America are some of the largest employers.
In Central Contra Costa (Contra Costa County), 66.2% voted for Democrats and 31.1% for Republicans in 2012 Presidential Election. In Santa Clara (Santa Clara County), 70.0% voted for Democrats and 27.1% for Republicans.
Elections
Type
Democrats
Republicans
Other
Year
Central Contra Costa
Santa Clara
Central Contra Costa
Santa Clara
Central Contra Costa
Santa Clara
2020
71.8%
72.7%
26.4%
25.2%
1.8%
2.1%
2016
67.5%
72.7%
24.5%
20.6%
8.0%
6.7%
2012
66.2%
70.0%
31.1%
27.1%
2.7%
2.9%
2008
68.0%
69.6%
30.2%
28.6%
1.8%
1.8%
2004
62.6%
64.3%
36.7%
34.8%
0.7%
0.9%
2000
59.0%
60.7%
37.2%
34.4%
3.8%
4.9%
1996
55.7%
56.9%
35.2%
32.2%
9.1%
11.0%
Breakdown of population affiliated with a religious congregation
Type
Adherents
Congregations
Religion
Central Contra Costa
Santa Clara
Central Contra Costa
Santa Clara
CATHOLIC CHURCH
21.8%
25.1%
5.2%
6.0%
SOUTHERN BAPTIST CONVENTION
1.3%
0.9%
10.0%
7.7%
MUSLIM ESTIMATE
1.0%
1.1%
1.4%
1.8%
EPISCOPAL CHURCH
0.5%
0.5%
2.3%
2.3%
EVANGELICAL LUTHERAN CHURCH IN AMERICA
0.5%
0.3%
2.0%
2.3%
SEVENTH DAY ADVENTIST CHURCH
0.3%
0.4%
1.5%
2.6%
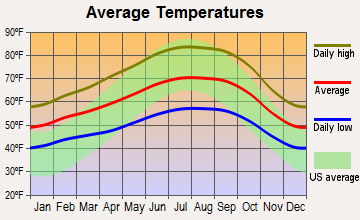
Weather
Both Santa Clara and Central Contra Costa enjoy the typical Mediterranean climate prevalent in California, characterized by mild, wet winters and hot, dry summers. Santa Clara, being closer to the Bay, tends to be a bit cooler and windier than Central Contra Costa. Those who enjoy more heat might prefer the climate in Central Contra Costa, while those who like moderate weather might favor Santa Clara.
Weather and climate
Type
Central Contra Costa
Santa Clara
Temperature - Average
59.1°F
60.7°F
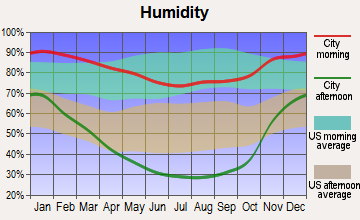
Humidity - Average morning or afternoon humidity
82.2%
79.6%
Humidity - Differences between morning and afternoon humidity
29.3%
32.3%
Humidity - Maximum monthly morning or afternoon humidity
88.1%
87.4%
Humidity - Minimum monthly morning or afternoon humidity
58.8%
55.1%
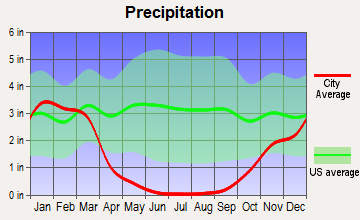
Precipitation - Yearly average
21.8 in
16.4 in
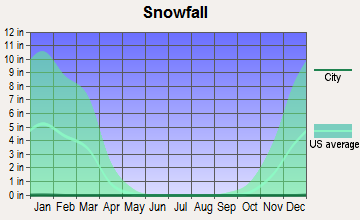
Snowfall - Yearly average
0 in
0 in
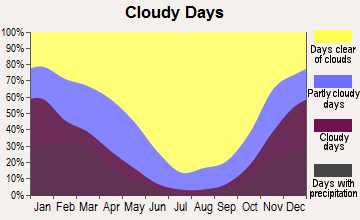
Clouds - Number of days clear of clouds
27.7%
27.1%
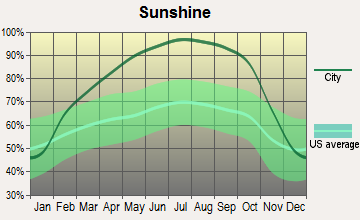
Sunshine amount - Average
73.3%
73.5%
Sunshine amount - Differences during a year
22.4%
22.6%
Sunshine amount - Maximum monthly
77.2%
77.2%
Sunshine amount - Minimum monthly
54.7%
54.6%
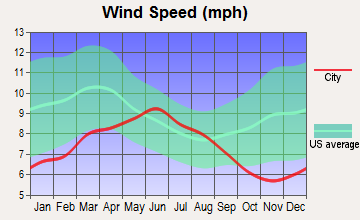
Wind speed - Average
11.1 mph
10.7 mph
Average climate in Central Contra Costa, California
Average climate in Santa Clara, California
Air pollution
Type
AQI
CO
NO2
OZONE
PB
PM25
SO2
Year
Central Contra Costa
Santa Clara
Central Contra Costa
Santa Clara
Central Contra Costa
Santa Clara
Central Contra Costa
Santa Clara
Central Contra Costa
Santa Clara
Central Contra Costa
Santa Clara
Central Contra Costa
Santa Clara
2018
105
96
0.32
0.43
6.9
13.3
22.1
22.9
0.012
0.006
13.3
12.4
0.6
0.2
2017
102
93
0.30
0.43
7.0
13.3
25.9
23.7
0.008
0.004
11.9
9.8
0.7
0.2
2016
86
70
0.28
0.40
6.5
12.5
25.2
22.5
0.005
0.003
6.5
8.6
0.8
0.2
2015
94
85
0.34
0.45
7.6
14.1
25.8
22.5
0.004
0.004
8.8
9.3
0.5
0.3
2014
95
87
0.35
0.38
7.8
13.4
25.2
22.0
0.005
0.004
6.9
8.3
0.5
0.2
2013
93
90
0.34
0.41
9.3
13.2
21.5
21.6
0.004
0.004
7.8
11.2
0.5
0.4
2012
93
75
0.32
0.36
8.5
11.7
25.2
22.5
0.003
0.002
8.3
9.2
0.3
0.6
2011
99
83
0.35
0.38
9.0
13.0
23.0
21.5
0.003
0.002
9.8
11.6
0.6
0.5
2010
93
87
0.31
0.35
8.6
13.4
23.2
21.1
0.014
0.004
8.5
8.6
0.5
0.4
2009
104
90
0.31
0.40
9.5
14.4
23.7
19.3
0.006
0.004
10.3
9.4
0.6
0.3
2008
120
100
0.36
0.45
10.2
16.2
26.1
21.2
0.006
N/A
12.1
12.5
0.8
N/A
2007
104
92
0.36
0.45
10.7
16.1
24.1
19.8
0.006
0.009
9.7
11.0
0.7
N/A
2006
109
100
0.39
0.47
10.9
17.5
26.0
21.5
N/A
N/A
11.1
11.0
0.8
N/A
2005
104
95
0.43
0.65
11.6
18.1
22.7
19.1
N/A
N/A
10.4
11.7
1.0
N/A
2004
112
98
0.46
0.61
12.4
18.0
22.6
20.2
0.004
N/A
11.9
10.0
1.1
N/A
2003
84
87
0.51
0.70
13.4
20.0
23.1
20.1
N/A
N/A
N/A
N/A
0.7
N/A
2002
88
78
0.51
0.64
14.7
19.3
23.3
19.4
0.008
0.006
N/A
N/A
0.9
N/A
2001
90
77
0.56
0.61
15.4
18.5
22.1
17.0
0.008
0.008
N/A
N/A
1.2
N/A
2000
95
65
0.67
0.66
15.9
18.8
20.8
16.1
0.013
0.008
N/A
N/A
1.6
N/A
Natural disasters
Type
Central Contra Costa
Santa Clara
Tornado activity compared to U.S. average
9.4%
9%
Earthquake activity compared to U.S. average
7,786.2%
7,725.2%
Natural disasters compared to U.S. average
18%
19%
Transportation
Both areas are well-served by public transit, but Santa Clara has more diverse options due to its proximity to major hubs like San Jose and Palo Alto. Santa Clara County VTA buses, light rail, Caltrain, and BART services link Santa Clara to the rest of the Bay Area. Central Contra Costa is primarily served by BART and county bus services.
Transport
Type
Central Contra Costa
Santa Clara
Amtrak stations
0
1
Amtrak stations nearby
3
3
FAA registered aircraft
0
167
FAA registered aircraft manufacturers and dealers
0
1
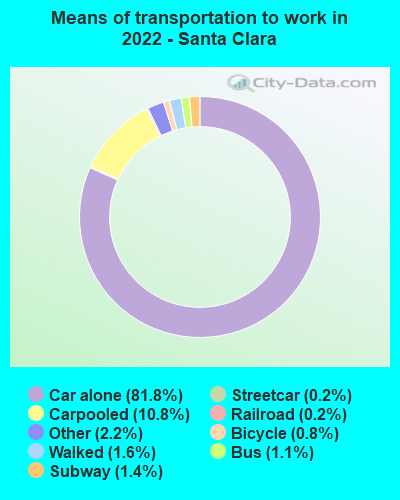
Means of transportation to work
Type
Central Contra Costa
Santa Clara
Bicycle
0.5%
0.3%
Bus
1%
1.1%
Carpooled
9.9%
9.1%
Car alone
72.3%
83.5%
Motorcycle
0.2%
0.1%
Railroad
0.8%
0.5%
Subway
7.7%
0.2%
Walked
1.5%
2.6%
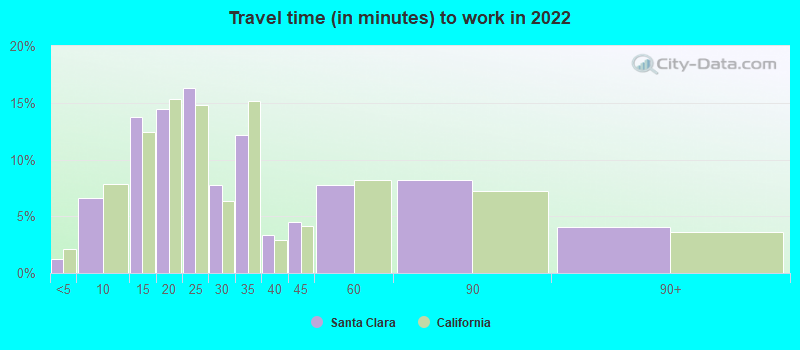
Average travel time to work
Type
Central Contra Costa
Santa Clara
Average
31.8 min
28.8 min
Real Estate
Housing prices in Santa Clara are significantly higher than in Central Contra Costa. Santa Clara's proximity to major tech hubs in Silicon Valley drives its high real estate prices. Central Contra Costa offers more affordable housing options, with a mix of older, established homes, and new developments.
Neighborhoods
Santa Clara boasts upscale neighborhoods favored by tech workers, such as North Santa Clara and Rivermark of Santa Clara. Central Contra Costa offers a more suburban feel with quieter neighborhoods like Lafayette, Orinda, and Moraga.
Houses and residents
Type
Central Contra Costa
Santa Clara
Houses
183,777
52,276
Average household size (people)
2.5
2.6
Houses occupied
179,136 (97.5%)
49,011 (93.8%)
Houses occupied by owners
127,889 (71.4%)
21,129 (43.1%)
Houses occupied by renters
51,247 (28.6%)
27,882 (56.9%)
Median rent asked for vacant for-rent units
$2,527
$1,797
Median price asked for vacant for-sale houses and condos
$1,269,474
$1,979,319
Estimated median house or condo value
Over $1,000,000
Over $1,000,000
Median number of rooms in apartments
4.3
3.4
Median number of rooms in houses and condos
6.5
5.7
Renting percentage
30.3%
54.1%
Housing density (houses/condos per square mile)
703.4
2,842.7
Household income disparities
35.9%
36.2%
Housing units without a mortgage
20,208 (18.2%)
304 (2.1%)
Housing units with both a second mortgage and home equity loan
418 (0.4%)
1,188 (8.2%)
Housing units with a mortgage
90,899 (81.8%)
14,205 (97.9%)
Housing units with a home equity loan
13,612 (12.3%)
314 (2.2%)
Housing units with a second mortgage
13,614 (12.3%)
1,619 (11.2%)
Housing units lacking complete kitchen facilities
0.5%
1.1%
Housing units lacking complete plumbing facilities
Self-employed workers in own not incorporated business
22,217
1,385
State government workers
6,705
1,554
Unpaid family workers
617
70
Industries and Occupations
Santa Clara's dominating industry is technology, with many residents working in software development, IT services, and technical consulting. Central Contra Costa is more diverse, with industries such as healthcare, education, retail trade, and government playing significant roles in its economy.
Santa Clara boasts state-of-the-art healthcare facilities including Santa Clara Valley Medical Center. Central Contra Costa also has reputable healthcare facilities such as John Muir Health, Walnut Creek Medical Center.
Health (county statistics)
Type
Central Contra Costa
Santa Clara
General health status score of residents in this county from 1 (poor) to 5 (excellent)
Santa Clara tends to have a newer and better-maintained infrastructure due to the significant investments by tech companies and the higher city revenue generated in the area. Central Contra Costa also has good infrastructure, but it might not be as modern or well-funded as Santa Clara's.
Infrastructure
Type
Central Contra Costa
Santa Clara
TV stations
24
18
Culture and Food
Santa Clara offers a diverse food scene, some favorite cuisines include Vietnamese, Indian and Mediterranean. The city also hosts several cultural events year-round. Central Contra Costa, on the other hand, has a robust culinary scene with a farm-to-table focus and offers wine country cuisine owing to its proximity to Napa Valley.
Sports Teams
Santa Clara is home to the San Francisco 49ers of the National Football League. On the other hand, Central Contra Costa does not host any major professional sports teams but has numerous youth and amateur sports organizations.
 Central Contra Costa, CA
 Santa Clara, CA