


Relative area comparison
 Bronx, NY
 Washington, DC
Overview
Moving or visiting a new city is a considerable decision that involves multiple factors. Comparing the Bronx, NY, and Washington, DC, gives us key aspects to contemplate. These include elements of crime and safety, weather, cost of living, education, the work and economy, infrastructure, and overall city life. Both cities offer diverse opportunities and experiences, unique to their geographical locations. Understanding the specifics pertinent to each city will help determine which may be the better match for relocation or tourism.

 | Barometer of Urban Scale, Part I... (259 replies) |
| Demographics Thread - 2023 (221 replies) |
| Which US city is most like New York in terms of overall urban feel? (548 replies) |
| America's Top 10 Downtown's (2344 replies) |
| City of Atlanta vs DC Proper Black Demographic Changes (228 replies) |
| Walk Score Top 25 City Ranking for American Cities (68 replies) |
Bronx, NY and
Washington, DC : 213.4 miles
Bronx's population is larger by 107%. The population of Washington has grown by 97,991 people (17.1%) during that time.
| Population | ||
| Type | Bronx | Washington |
|---|---|---|
| Population | 1,383,871 | 670,050 |
| Female / male percentage | 53.5% / 46.5%
|
52.4% / 47.6%
|
In terms of safety, both the Bronx and Washington, DC, have urban crime rates, but their respective neighborhoods can differ significantly. The Bronx, like most of New York City, has seen a decline in crime over the years. Certain neighborhoods in the Bronx have seen improvement, but others, such as Hunts Point, still struggle with crime. Alternatively, Washington, DC, has a comparable crime rate. However, many neighborhoods in DC, are perceived as safe, such as Georgetown and Capitol Hill, while others have higher crime rates.
Both cities are known for their high cost of living compared to the national average. However, the cost of living in Washington, DC, is generally higher than in the Bronx. Housing is particularly costly in DC, with other expenses, such as groceries, healthcare, and utilities, also adding up. While the Bronx is not cheap, it's generally less expensive than Manhattan or some of the wealthier parts of Brooklyn.
Income taxes can also drastically differ. The Bronx, situated in New York state, has a progressive income tax system where rates range from 4 to 8.82%, depending on income. Washington, DC, has a progressive income tax system as well with rates ranging from 4 to 8.95%, also depending on income.
Property tax rates present yet another contrast. The Bronx, as part of New York City, has a property tax rate that averages around 0.90%, but can vary depending on location and the specific value of the property. DC, on the other hand, has a relatively lower property tax rate with most residential properties taxed at a rate of 0.85%.
New York City, including the Bronx, has a combined city and state sales tax rate of 8.875%, which applies to most goods and services. Washington, DC, has a sales tax rate of 6% except for meals in restaurants, alcohol sold for consumption on-premises, and rental cars, which are taxed at 10%.
| Income | ||
| Type | Bronx | Washington |
|---|---|---|
| Estimated median household income | $43,011 | $90,088 |
| Estimated per capita income | $23,354 | $65,808 |
| Cost of living index (U.S. average is 100) | 172.8 | 124.2 |
If you make $50,000 in Washington, you will have to make $69,565 in Bronx to maintain the same standard of living.
The Bronx is the northernmost of New York City's five boroughs. It's bordered by the Harlem River and the East River, providing plenty of waterfront spaces. Washington, DC, on the other hand, is situated along the Potomac River, with a lower altitude and more green areas, including Rock Creek Park and the National Mall.
| Geographical information | ||
| Type | Bronx | Washington |
|---|---|---|
| Land area | 42 sq. miles | 61.4 sq. miles |
| Population density | 32,928 people per sq. mile | 10,912 people per sq. mile |
| Elevation | 120 feet | 18 feet |
Bronx, NY
Washington, DC
In terms of public education, both cities face challenges, but there are notable differences. New York City's public school system, which includes the Bronx, is the largest in the country, and performance varies widely by school and borough. On the other hand, Washington, DC, has long been known for struggling public schools. However, the city has been investing in education reforms that have seen student performance generally improve over the years.
| Education level (25-year-olds and older) | ||
| Type | Bronx | Washington |
|---|---|---|
| Bachelor's degree or higher | 14.6% | 63% |
| Graduate or professional degree | 5.9% | 37.8% |
| High school or higher | 62.3% | 92.8% |
When it comes to economic opportunities, Washington, DC, is a city with a lot of job opportunities, especially in the public sector. Government, education, and health services are the major industries here. New York City, including the Bronx, has a diverse economy with jobs spread across a wide range of industries, including finance, fashion, entertainment, tech, and healthcare.
New York City's biggest employers in the Bronx include Montefiore Medical Center, Bronx Lebanon Hospital, and Albert Einstein College of Medicine. Retail giants such as Macy's and J. C. Penney also have a significant presence. In Washington, DC, the federal government is by far the largest employer, followed by Medstar Health and George Washington University.
In Bronx (Bronx County), 91.9% voted for Democrats and 8.1% for Republicans in 2012 Presidential Election. In Washington (District of Columbia), 90.9% voted for Democrats and 7.3% for Republicans.
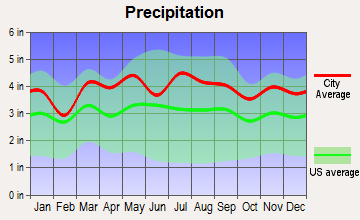
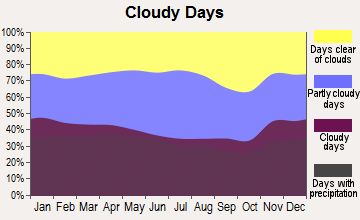
The Bronx experiences the typical New York weather, with cold, potentially snowy winters and hot, humid summers. Spring and fall are moderate, although unpredictable weather can occur. Washington, DC, is similar, but it typically has milder winters and hotter, more humid summers. The city's famous cherry blossoms, which bloom in spring, are a significant tourist attraction.
| Weather and climate | ||
| Type | Bronx | Washington |
|---|---|---|
| Temperature - Average | 54.7°F | 56.4°F |
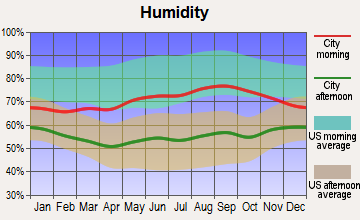
| Humidity - Average morning or afternoon humidity | 67.2% | 68.8% |
| Humidity - Differences between morning and afternoon humidity | 26.4% | 33% |
| Humidity - Maximum monthly morning or afternoon humidity | 75.6% | 81% |
| Humidity - Minimum monthly morning or afternoon humidity | 49.2% | 48% |
| Precipitation - Yearly average | 47 in | 42.7 in |
| Snowfall - Yearly average | 54.5 in | 32.4 in |
| Clouds - Number of days clear of clouds | 16.5% | 15.9% |
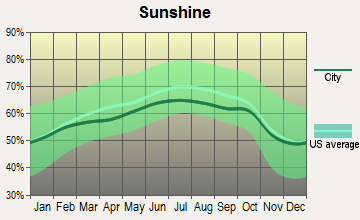
| Sunshine amount - Average | 60.2% | 61.5% |
| Sunshine amount - Differences during a year | 20% | 21% |
| Sunshine amount - Maximum monthly | 64% | 66% |
| Sunshine amount - Minimum monthly | 44% | 45% |
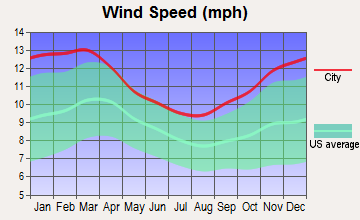
| Wind speed - Average | 10.7 mph | 9.7 mph |
| Natural disasters | ||
| Type | Bronx | Washington |
|---|---|---|
| Tornado activity compared to U.S. average | 58.3% | 110.6% |
| Earthquake activity compared to U.S. average | 31% | 42.9% |
| Natural disasters compared to U.S. average | 14% | 19% |
Both the Bronx and Washington, DC, have comprehensive public transit systems. The New York City subway system extends to the Bronx, providing direct access to Manhattan and other boroughs. Buses and taxis are also readily available. Washington, DC, has the Metro system, which provides subway and bus service throughout the city. Bike sharing and scooters are also popular methods of commuting in DC, although the average commute time is longer compared to the Bronx due to larger distances.
| Transport | ||
| Type | Bronx | Washington |
|---|---|---|
| Amtrak stations | 0 | 1 |
| Amtrak stations nearby | 3 | 3 |
| FAA registered aircraft | 39 | 456 |
| FAA registered aircraft manufacturers and dealers | 0 | 3 |
| Means of transportation to work | ||
| Type | Bronx | Washington |
|---|---|---|
| Bicycle | 0.2% | 2% |
| Bus | 15.6% | 6.3% |
| Carpooled | 9.3% | 7.8% |
| Car alone | 27% | 62.5% |
| Railroad | 2% | 0.3% |
| Streetcar | 0.2% | 10.6% |
| Subway | 34.6% | 1.3% |
| Taxicab | 1.3% | 0.8% |
| Walked | 7.2% | 5.7% |
| Average travel time to work | ||
| Type | Bronx | Washington |
|---|---|---|
| Average | 44.2 min | 39.2 min |
The real estate markets in both cities are robust, but they offer different opportunities. In the Bronx, there's a mix of single-family homes, apartments, and condos, and while prices have been steadily rising, they're still lower than in many other parts of New York City. Washington, DC's real estate is relatively pricier, with the city having a mixture of historical homes, luxury apartments, and condos.
The Bronx is home to diverse neighborhoods each with its unique character. Riverdale is one of the more affluent neighborhoods, while Belmont is known for its mix of cultures and the famous Arthur Avenue, often referred to as the "real Little Italy." Washington DC is also home to varied neighborhoods like Georgetown, known for its historic houses, and Dupont Circle, known for its vibrant city life and art scene.
| Houses and residents | ||
| Type | Bronx | Washington |
|---|---|---|
| Houses | 490,659 | 357,482 |
| Average household size (people) | 2.8 | 2.1 |
| Houses occupied | 463,212 (94.4%) | 319,565 (89.4%) |
| Houses occupied by owners | 90,522 (19.5%) | 132,936 (41.6%) |
| Houses occupied by renters | 372,690 (80.5%) | 186,629 (58.4%) |
| Median rent asked for vacant for-rent units | $1,273 | $2,791 |
| Median price asked for vacant for-sale houses and condos | $708,992 | $996,150 |
| Estimated median house or condo value | $465,000 | $669,900 |
| Median number of rooms in apartments | 3.7 | 3.1 |
| Median number of rooms in houses and condos | 5.1 | 6 |
| Renting percentage | 80.7% | 58% |
| Housing density (houses/condos per square mile) | 11,675 | 5,821.9 |
| Household income disparities | 50.2% | 45.7% |
| Housing units without a mortgage | 12,021 (34%) | 777 (0.8%) |
| Housing units with both a second mortgage and home equity loan | 105 (0.3%) | 8,586 (8.5%) |
| Housing units with a mortgage | 23,339 (66%) | 100,122 (99.2%) |
| Housing units with a home equity loan | 2,053 (5.8%) | 1,057 (1%) |
| Housing units with a second mortgage | 2,159 (6.1%) | 12,793 (12.7%) |
| Housing units lacking complete kitchen facilities | 1.4% | 1.5% |
| Housing units lacking complete plumbing facilities | 1.7% | 1.5% |
The Bronx is a part of the bustling New York City economy with industries like healthcare, retail trade, and educational services leading the way. However, it also has a slightly higher unemployment rate compared to the national average. Washington, DC, on the other hand, is heavily influenced by the federal government's presence, making it a hub for political and related occupations. Professional, scientific, and management services also play a significant role in the city's economy.
Both cities are served by several high-quality healthcare systems. In the Bronx, facilities like Montefiore Medical Center and Bronx Lebanon Hospital provide extensive healthcare services. Similarly, DC residents have access to exceptionally high-quality medical facilities such as George Washington University Hospital and MedStar Washington Hospital Center.
| Health (county statistics) | ||
| Type | Bronx | Washington |
|---|---|---|
| General health status score of residents in this county from 1 (poor) to 5 (excellent) | 3.2 | 3.7 |
| Average weight of females (lbs) | 160 lbs | 160.6 lbs |
| Average weight of males (lbs) | 188.8 lbs | 185.7 lbs |
| Residents visited a dentist within the past year | 67% | 74.9% |
| Residents exercised in the past month | 67.5% | 79.2% |
| Residents keep firearms around their homes | 2.6% | 4% |
| Adult residents drank alcohol in the past 30 days | 73.2% | 81% |
| Residents smoked 100+ cigarettes in their lives | 39.6% | 43.6% |
Infrastructure is a mixed bag in both cities. The Bronx, like much of New York City, struggles with aging infrastructure. However, investments are being made to modernize transport, utilities, and other key areas. In contrast, Washington, DC, also struggles with some aging infrastructure. The city has had issues with power blackouts and water safety in the past. But it also boasts landmarks and government buildings that are well-maintained.
| Infrastructure | ||
| Type | Bronx | Washington |
|---|---|---|
| Hospitals | 57 | 114 |
| TV stations | 30 | 27 |
| Bank branches located here | 118 | 247 |
| Bank institutions located here | 24 | 34 |
| Main business address for public companies | 2 | 30 |
| Drinking water stations with no reported violations in the past | 1 | 5 |
| Drinking water stations with reported violations in the past | 4 | 10 |
The Bronx offers a vibrant cultural scene, with attractions like the Bronx Museum of the Arts and the New York Botanical Garden. It's also noted for its food, with an array of ethnic cuisines, particularly Latin American and Italian. Washington, DC, has a rich cultural life with numerous museums and cultural institutions, such as the Smithsonian Museums and the Kennedy Center. Additionally, DC's food scene is diverse, encompassing anything from high-end dining to multicultural food trucks.
Sports fans will appreciate the variety in both cities. In the Bronx, you have the world-renowned New York Yankees, while in Washington, DC, you can root for the Washington Nationals (MLB), the Washington Wizards (NBA), the Capitals (NHL), and the Washington Football team (NFL).