As two considerably diverse cities in the United States, the Bronx in New York and Oklahoma City in Oklahoma offer uniquely different lifestyles and opportunities. While the Bronx presents a vibrant and bustling urban lifestyle embedded in a multicultural setting, Oklahoma City provides a more relaxed, suburban living marked by Midwestern hospitality. Both cities come with their nuances in terms of crime and safety, cost of living, education, job opportunities, tax laws and demographics, among other factors. This guide provides a comprehensive comparison between the two cities for individuals or families who are considering relocating or visiting these cities.
Safety in both cities varies by neighborhood. In the Bronx, while crime rates have seen a significant decrease over the years, some areas still have higher crime rates than others. On the contrary, Oklahoma City exhibits a relatively moderate crime rate but, similar to the Bronx, certain areas have higher crime rates than others. It's worth noting that it's always necessary to research specific neighborhoods before making a decision about relocation or vacation.
Cost of Living
Cost of living is significantly higher in the Bronx, primarily due to housing costs. For instance, housing, groceries, healthcare, and transportation are all more expensive in the Bronx than in Oklahoma City. However, the high cost of living is somewhat offset by the higher average salary in NYC.
Income Tax
New York State has a progressive income tax system, with rates ranging from 4% to 8.82%. Oklahoma's income tax is also progressive, with rates ranging from 0.5% to 5%.
Property Tax
Property taxes in the Bronx, as part of New York City, are quite high, depending on the assessed value of the property. Oklahoma City, in contrast, has much lower property tax rates.
Sales Tax
NYC has a relatively high sales tax rate at 8.875%, while Oklahoma City has one of the highest sales taxes in the country at 8.63%.
Income
Type
Bronx
Oklahoma City
Estimated median household income
$43,011
$59,214
Estimated per capita income
$23,354
$31,630
Cost of living index (U.S. average is 100)
172.8
85.4
If you make $50,000 in Oklahoma City, you will have to make $101,171 in Bronx to maintain the same standard of living.
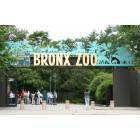
Geographical Conditions
The Bronx, characterized by its vast urban landscape, is marked by the presence of four large parks, including the famous Bronx Zoo. Oklahoma City is largely flat with a few small lakes.
Geographical information
Type
Bronx
Oklahoma City
Land area
42 sq. miles
607 sq. miles
Population density
32,928 people per sq. mile
1,133 people per sq. mile
Elevation
120 feet
1,230 feet
Relative area comparison
Bronx, NY Oklahoma City, OK
Education
Both cities promote educational opportunities with public, private, and charter schools. The Bronx is also home to numerous universities and community colleges, including Fordham and Bronx Community College. Oklahoma City, on the other hand, hosts the University of Oklahoma, among other educational institutions. Generally, both cities are devoted to education, but the choices of institutions might vary significantly.
New York City's economy is robust and diverse with industries like finance, media, entertainment, and healthcare, providing employment opportunities. Conversely, Oklahoma City's economy is reliant on sectors like oil, gas, and public sector jobs, which serve as major employers in the area.
Biggest Employers
The biggest employers in Bronx are Montefiore Medical Center, Bronx-Lebanon Hospital, and Fordham University. On the other hand, the largest employers in Oklahoma City include the federal and state government, Integris Health, and the University of Oklahoma.
In Bronx (Bronx County), 91.9% voted for Democrats and 8.1% for Republicans in 2012 Presidential Election. In Oklahoma City (Oklahoma County), 41.7% voted for Democrats and 58.3% for Republicans.
Elections
Type
Democrats
Republicans
Other
Year
Bronx
Oklahoma City
Bronx
Oklahoma City
Bronx
Oklahoma City
2020
83.7%
48.1%
16.0%
49.2%
0.3%
2.7%
2016
88.6%
41.2%
9.5%
51.7%
2.0%
7.1%
2012
91.9%
41.7%
8.1%
58.3%
0.0%
0.0%
2008
89.0%
41.6%
11.0%
58.4%
0.0%
0.0%
2004
82.9%
35.8%
16.5%
64.2%
0.6%
0.0%
2000
86.5%
36.6%
11.8%
62.3%
1.7%
1.1%
1996
85.8%
36.5%
10.5%
54.7%
3.7%
8.8%
Breakdown of population affiliated with a religious congregation
Type
Adherents
Congregations
Religion
Bronx
Oklahoma City
Bronx
Oklahoma City
CATHOLIC CHURCH
25.5%
8.5%
11.5%
3.0%
MUSLIM ESTIMATE
2.8%
0.3%
3.9%
0.6%
AMERICAN BAPTIST CHURCHES IN THE USA
0.7%
0.3%
4.4%
0.1%
SEVENTH DAY ADVENTIST CHURCH
0.7%
0.4%
6.5%
1.5%
EPISCOPAL CHURCH
0.4%
0.7%
3.7%
1.3%
SOUTHERN BAPTIST CONVENTION
0.2%
20.7%
2.4%
20.0%
LUTHERAN CHURCH
0.1%
0.5%
0.6%
1.0%
INTERNA PENTECO HOLINESS CHURCH
0.0%
0.7%
0.2%
2.9%
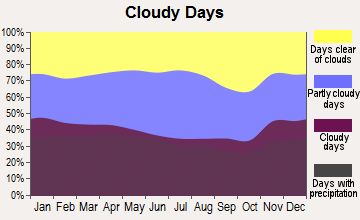
Weather
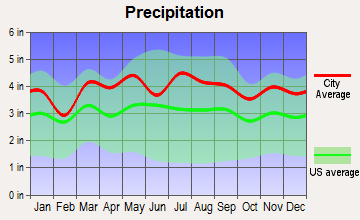
Weather between the two cities is vastly different. The Bronx, like the rest of NYC, experiences typical Northeast weather — hot summers and freezing winters, with precipitation spread fairly evenly throughout the year. Meanwhile, Oklahoma City experiences a more temperate climate with hot summers and mild winters. However, OKC is located in the heart of Tornado Alley, making springtime severe weather a significant consideration.
Weather and climate
Type
Bronx
Oklahoma City
Temperature - Average
54.7°F
60.1°F
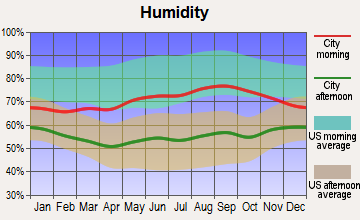
Humidity - Average morning or afternoon humidity
67.2%
73.1%
Humidity - Differences between morning and afternoon humidity
26.4%
35%
Humidity - Maximum monthly morning or afternoon humidity
75.6%
85%
Humidity - Minimum monthly morning or afternoon humidity
49.2%
50%
Precipitation - Yearly average
47 in
35.7 in
Snowfall - Yearly average
54.5 in
17.2 in
Clouds - Number of days clear of clouds
16.5%
23.1%
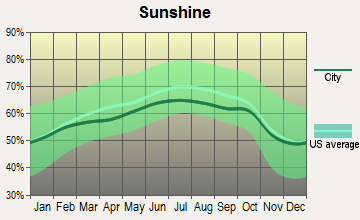
Sunshine amount - Average
60.2%
72.1%
Sunshine amount - Differences during a year
20%
21%
Sunshine amount - Maximum monthly
64%
79%
Sunshine amount - Minimum monthly
44%
58%
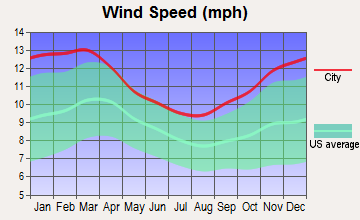
Wind speed - Average
10.7 mph
12.3 mph
Average climate in Bronx, New York
Average climate in Oklahoma City, Oklahoma
Air pollution
Type
AQI
CO
NO2
OZONE
PB
PM10
PM25
SO2
Year
Bronx
Oklahoma City
Bronx
Oklahoma City
Bronx
Oklahoma City
Bronx
Oklahoma City
Bronx
Oklahoma City
Bronx
Oklahoma City
Bronx
Oklahoma City
Bronx
Oklahoma City
2018
102
85
0.31
0.29
15.8
6.6
24.4
31.9
N/A
0.002
N/A
21.3
7.4
9.6
0.6
0.0
2017
100
82
0.04
0.32
15.7
6.7
24.6
33.0
N/A
0.002
N/A
20.7
7.0
8.9
0.6
0.0
2016
98
72
0.30
0.29
16.4
6.6
24.6
31.9
N/A
0.002
N/A
19.4
7.2
8.5
0.8
0.2
2015
105
76
0.28
0.24
18.0
7.0
23.6
31.5
N/A
0.002
N/A
19.1
8.6
7.8
1.4
0.5
2014
99
84
0.32
0.15
18.0
7.1
23.6
32.4
N/A
0.002
N/A
N/A
8.4
8.7
1.7
0.1
2013
103
84
0.39
0.14
18.9
8.6
23.5
32.8
N/A
0.002
N/A
N/A
9.3
9.3
2.1
0.2
2012
104
97
0.44
0.13
18.8
9.4
23.9
34.0
N/A
0.007
N/A
N/A
9.7
7.9
3.1
0.3
2011
113
107
0.46
0.24
20.9
9.9
22.1
36.3
N/A
0.003
N/A
N/A
11.6
9.9
4.5
0.8
2010
113
81
0.53
0.30
20.2
8.8
23.7
31.7
N/A
0.002
N/A
N/A
10.8
9.8
4.7
0.7
2009
107
82
0.53
0.52
22.3
8.1
19.5
31.9
N/A
0.002
N/A
N/A
10.8
10.2
5.4
0.7
2008
114
78
0.53
0.51
23.3
9.8
19.9
31.0
0.013
N/A
N/A
N/A
12.1
N/A
5.9
1.4
2007
122
81
0.60
0.44
24.6
10.2
19.1
29.4
0.016
N/A
N/A
N/A
13.2
N/A
7.0
2.0
2006
120
95
0.50
0.43
25.0
10.1
18.9
33.7
0.018
N/A
N/A
N/A
12.8
N/A
7.0
1.2
2005
115
88
0.60
0.38
27.0
11.6
17.8
31.0
N/A
N/A
N/A
N/A
N/A
N/A
9.3
1.3
2004
109
75
0.62
0.46
25.6
10.5
16.7
28.6
0.030
N/A
N/A
N/A
N/A
N/A
8.8
0.6
2003
110
87
0.75
0.42
27.4
10.9
17.1
30.8
0.022
N/A
26.9
N/A
N/A
N/A
8.9
N/A
2002
124
91
0.67
0.35
27.9
14.3
17.4
29.0
0.008
N/A
25.0
N/A
N/A
N/A
8.6
2.0
2001
126
87
0.66
0.69
30.0
13.1
17.8
31.0
0.020
N/A
22.8
N/A
N/A
N/A
10.0
1.8
2000
115
89
0.68
0.66
29.4
13.4
16.0
29.5
0.022
N/A
22.2
N/A
N/A
N/A
10.2
3.0
Natural disasters
Type
Bronx
Oklahoma City
Tornado activity compared to U.S. average
58.3%
353.4%
Earthquake activity compared to U.S. average
31%
938.9%
Natural disasters compared to U.S. average
14%
43%
Transportation
The Bronx is well-served by public transportation, including subways, buses, and taxis, making it easier to commute without a car. In contrast, Oklahoma City is more car-dependent, though there are bus services and a growing number of bike lanes and trails.
Transport
Type
Bronx
Oklahoma City
Amtrak stations
0
1
Amtrak stations nearby
3
2
FAA registered aircraft
39
0
Means of transportation to work
Type
Bronx
Oklahoma City
Bicycle
0.2%
0.2%
Bus
15.6%
0.3%
Carpooled
9.3%
8.6%
Car alone
27%
87.6%
Railroad
2%
0%
Streetcar
0.2%
0%
Subway
34.6%
0%
Taxicab
1.3%
0.2%
Walked
7.2%
1.4%
Average travel time to work
Type
Bronx
Oklahoma City
Average
44.2 min
25.6 min
Real Estate
The real estate market in the Bronx is extremely competitive with higher prices compared to Oklahoma City. OKC's real estate, by contrast, is much more affordable, providing more value for your dollar whether you're renting or buying.
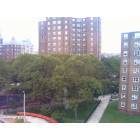
Neighborhoods
The Bronx boasts diverse neighborhoods that reflect its multicultural population. From the Italian enclave of Arthur Avenue to the historic Grand Concourse, there's something for everyone. Oklahoma City's neighborhoods vary from urban districts like Bricktown to suburban areas like Quail Creek.
Houses and residents
Type
Bronx
Oklahoma City
Houses
490,659
302,241
Average household size (people)
2.8
2.5
Houses occupied
463,212 (94.4%)
275,285 (91.1%)
Houses occupied by owners
90,522 (19.5%)
164,470 (59.7%)
Houses occupied by renters
372,690 (80.5%)
110,815 (40.3%)
Median rent asked for vacant for-rent units
$1,273
$1,241
Median price asked for vacant for-sale houses and condos
$708,992
$278,299
Estimated median house or condo value
$465,000
$190,900
Median number of rooms in apartments
3.7
4.3
Median number of rooms in houses and condos
5.1
6.2
Renting percentage
80.7%
40.3%
Housing density (houses/condos per square mile)
11,675
497.9
Household income disparities
50.2%
44.3%
Housing units without a mortgage
12,021 (34%)
1,238 (1.2%)
Housing units with both a second mortgage and home equity loan
105 (0.3%)
4,838 (4.7%)
Housing units with a mortgage
23,339 (66%)
100,798 (98.8%)
Housing units with a home equity loan
2,053 (5.8%)
123 (0.1%)
Housing units with a second mortgage
2,159 (6.1%)
5,921 (5.8%)
Housing units lacking complete kitchen facilities
1.4%
3.1%
Housing units lacking complete plumbing facilities
Self-employed workers in own not incorporated business
16,572
20,964
State government workers
14,515
17,132
Unpaid family workers
1,000
555
Industries and Occupations
Predominant industries in the Bronx include healthcare, retail, education, and social services. On other hand, Oklahoma City's economy is heavily influenced by energy (particularly petroleum), information technology, and health services.
The Bronx is home to several quality health care facilities, but the high demand can sometimes lead to long wait times. Oklahoma City, however, has a strong healthcare system, with renowned facilities such as the OU Medical Center and Integris Health.
Health (county statistics)
Type
Bronx
Oklahoma City
General health status score of residents in this county from 1 (poor) to 5 (excellent)
Infrastructure in the Bronx is generally older but well maintained, with a rich abundance of historic buildings and sites. Meanwhile, Oklahoma City has seen recent growth, leading to new construction and infrastructure improvements, especially in areas like downtown.
Infrastructure
Type
Bronx
Oklahoma City
Hospitals
57
61
TV stations
30
20
Bank branches located here
118
183
Bank institutions located here
24
44
Main business address for public companies
2
15
Drinking water stations with no reported violations in the past
1
4
Drinking water stations with reported violations in the past
4
21
Schools
School facilities
Type
Bronx
Oklahoma City
Private elementary/middle schools
54
19
Private high schools
20
10
Public elementary/middle schools
285
126
Public high schools
155
25
Colleges/Universities
9
22
Culture and Food
Cultural and culinary diversity is a hallmark of the Bronx, with its countless ethnic eateries and rich history. Oklahoma City offers a blend of Western and urban culture, with a particular emphasis on steak and barbecue cuisine.
Sports Teams
The Bronx is home to the legendary New York Yankees, while Oklahoma City is proud of its NBA team, the Oklahoma City Thunder.


 Bronx, NY
 Oklahoma City, OK