The Bronx, New York, and El Paso, Texas, are two cities that, while part of the diverse American fabric, are known for their distinctive features and lived experiences. From safety and climate factors to cost of living and health care, relocating or planning a visit to either city requires a well-rounded understanding of what sets them apart. The following examines and compares key attributes of the Bronx and El Paso in depth.
The Bronx has a crime rate that's higher than the national average, causing safety to be a bit of a concern for both residents and tourists. The presence of law enforcement authorities is visible, but being cautious and informed is critical. In contrast, El Paso is known for its low crime rate and ranks as one of the safest large cities in the United States. The city's robust law enforcement practices contribute to its reputation for safety.
Cost of Living
Living in the Bronx is generally more expensive than living in El Paso due to the cost of housing, utilities, and groceries. El Paso offers a more affordable lifestyle, making it an attractive option for those looking to better balance their cost of living.
Income Tax
New Yorkers are subject to state income tax rates ranging from 4% to 8.82%, whereas Texas, including El Paso, doesn’t impose state income taxes.
Property Tax
Property taxes in the Bronx are typically higher than in El Paso. New York has an average effective rate of 0.88%, whereas Texas has a higher average state rate of 1.69%, but depending on assessed value and homestead exemptions, El Paso residents may still pay less.
Sales Tax
New York City, inclusive of the Bronx, has a combined city and state sales tax rate of 8.875%. El Paso, Texas, however, has a lower combined city and state sales tax rate of 8.25%.
Income
Type
Bronx
El Paso
Estimated median household income
$43,011
$51,241
Estimated per capita income
$23,354
$25,670
Cost of living index (U.S. average is 100)
172.8
82.2
If you make $50,000 in El Paso, you will have to make $105,109 in Bronx to maintain the same standard of living.
Geographical Conditions
The Bronx is located in the northeastern United States, characterized by its coastal, urban geography and is part of the larger Manhattan island. El Paso, on the other hand, is located in far West Texas, featuring a desert landscape with opportunities for hiking and outdoor activities in the nearby Franklin Mountains.
Geographical information
Type
Bronx
El Paso
Land area
42 sq. miles
249.1 sq. miles
Population density
32,928 people per sq. mile
2,723.7 people per sq. mile
Relative area comparison
Bronx, NY El Paso, TX
Education
The Bronx offers a diverse educational landscape, with some of the finest institutions in the country. However, disparities do exist and public schools' performance can vary. El Paso's education system is coming of age, with a focus on improved quality and academic performance.
Both cities have unique economic profiles. The Bronx, being part of New York City, benefits from its diverse and robust economy, including sectors such as health care, education, and retail. El Paso's economy has a strong military presence, thanks to the Fort Bliss Army Base, along with manufacturing and trade sectors.
Biggest Employers
Major employers in the Bronx include Montefiore Medical Center, Bronx-Lebanon Hospital Center, and the Department of Education. In El Paso, some of the biggest employers are Fort Bliss, University Medical Center of El Paso, and the El Paso Independent School District.
In Bronx (Bronx County), 91.9% voted for Democrats and 8.1% for Republicans in 2012 Presidential Election. In El Paso (El Paso County), 65.5% voted for Democrats and 33.2% for Republicans.
Elections
Type
Democrats
Republicans
Other
Year
Bronx
El Paso
Bronx
El Paso
Bronx
El Paso
2020
83.7%
66.8%
16.0%
31.6%
0.3%
1.6%
2016
88.6%
69.1%
9.5%
26.0%
2.0%
4.9%
2012
91.9%
65.5%
8.1%
33.2%
0.0%
1.3%
2008
89.0%
66.0%
11.0%
33.4%
0.0%
0.6%
2004
82.9%
56.2%
16.5%
43.3%
0.6%
0.5%
2000
86.5%
57.9%
11.8%
39.8%
1.7%
2.3%
1996
85.8%
62.3%
10.5%
32.1%
3.7%
5.6%
Breakdown of population affiliated with a religious congregation
Type
Adherents
Congregations
Religion
Bronx
El Paso
Bronx
El Paso
CATHOLIC CHURCH
25.5%
43.2%
11.5%
11.3%
MUSLIM ESTIMATE
2.8%
0.1%
3.9%
0.2%
AMERICAN BAPTIST CHURCHES IN THE USA
0.7%
0.0%
4.4%
0.0%
SEVENTH DAY ADVENTIST CHURCH
0.7%
0.3%
6.5%
1.6%
EPISCOPAL CHURCH
0.4%
0.1%
3.7%
1.0%
SOUTHERN BAPTIST CONVENTION
0.2%
3.3%
2.4%
26.6%
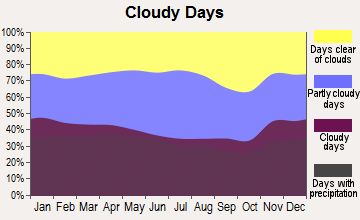
Weather
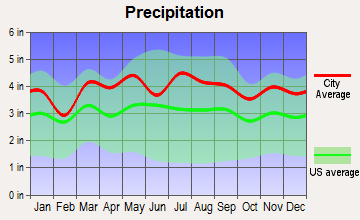
The Bronx exhibits a humid subtropical climate with hot summers and cold winters, attracting a broad spectrum of people who enjoy seasonal variations. El Paso, on the other hand, offers a desert climate with hot summers and mild winters, which might be more suitable for those favoring warmer climates.
Weather and climate
Type
Bronx
El Paso
Temperature - Average
54.7°F
64.6°F
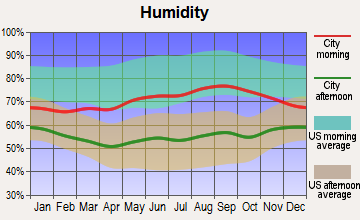
Humidity - Average morning or afternoon humidity
67.2%
42.7%
Humidity - Differences between morning and afternoon humidity
26.4%
42.8%
Humidity - Maximum monthly morning or afternoon humidity
75.6%
59.8%
Humidity - Minimum monthly morning or afternoon humidity
49.2%
17%
Precipitation - Yearly average
47 in
9.4 in
Snowfall - Yearly average
54.5 in
10.7 in
Clouds - Number of days clear of clouds
16.5%
31.8%
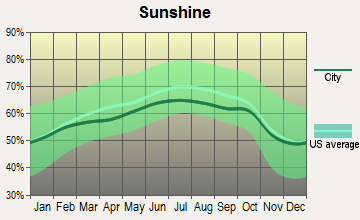
Sunshine amount - Average
60.2%
89.4%
Sunshine amount - Differences during a year
20%
13.9%
Sunshine amount - Maximum monthly
64%
89.3%
Sunshine amount - Minimum monthly
44%
75.4%
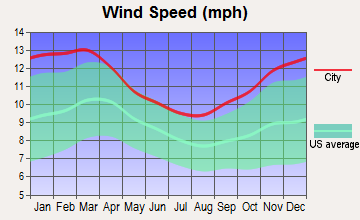
Wind speed - Average
10.7 mph
8.9 mph
Average climate in Bronx, New York
Average climate in El Paso, Texas
Air pollution
Type
AQI
CO
NO2
OZONE
PB
PM10
PM25
SO2
Year
Bronx
El Paso
Bronx
El Paso
Bronx
El Paso
Bronx
El Paso
Bronx
El Paso
Bronx
El Paso
Bronx
El Paso
Bronx
El Paso
2018
102
139
0.31
0.17
15.8
14.0
24.4
32.0
N/A
N/A
N/A
35.7
7.4
9.2
0.6
N/A
2017
100
173
0.04
0.19
15.7
13.0
24.6
30.5
N/A
N/A
N/A
40.4
7.0
9.5
0.6
0.5
2016
98
148
0.30
0.17
16.4
12.6
24.6
30.6
N/A
N/A
N/A
35.2
7.2
9.2
0.8
0.5
2015
105
112
0.28
0.18
18.0
12.7
23.6
30.8
N/A
N/A
N/A
31.2
8.6
8.0
1.4
0.5
2014
99
157
0.32
0.13
18.0
12.8
23.6
30.0
N/A
N/A
N/A
40.3
8.4
9.7
1.7
0.4
2013
103
211
0.39
0.23
18.9
14.1
23.5
30.5
N/A
N/A
N/A
43.9
9.3
10.8
2.1
0.4
2012
104
229
0.44
0.30
18.8
15.9
23.9
31.6
N/A
N/A
N/A
40.2
9.7
11.6
3.1
0.4
2011
113
221
0.46
0.23
20.9
15.9
22.1
31.2
N/A
N/A
N/A
34.7
11.6
11.6
4.5
0.5
2010
113
211
0.53
0.25
20.2
15.3
23.7
29.4
N/A
N/A
N/A
28.8
10.8
7.9
4.7
0.3
2009
107
117
0.53
0.23
22.3
15.4
19.5
29.5
N/A
N/A
N/A
28.6
10.8
8.3
5.4
0.3
2008
114
210
0.53
0.25
23.3
15.2
19.9
30.1
0.013
0.017
N/A
34.6
12.1
9.7
5.9
0.6
2007
122
134
0.60
0.28
24.6
13.9
19.1
30.6
0.016
0.019
N/A
40.5
13.2
8.4
7.0
0.4
2006
120
241
0.50
0.37
25.0
14.3
18.9
30.6
0.018
0.018
N/A
55.0
12.8
11.1
7.0
0.3
2005
115
159
0.60
0.43
27.0
13.1
17.8
29.6
N/A
0.013
N/A
44.5
N/A
9.6
9.3
0.6
2004
109
183
0.62
0.38
25.6
13.5
16.7
29.2
0.030
0.020
N/A
47.3
N/A
8.2
8.8
0.4
2003
110
278
0.75
0.46
27.4
15.5
17.1
29.5
0.022
0.039
26.9
60.4
N/A
10.8
8.9
0.6
2002
124
203
0.67
0.43
27.9
16.4
17.4
30.5
0.008
0.034
25.0
53.3
N/A
11.0
8.6
0.4
2001
126
139
0.66
0.51
30.0
15.5
17.8
28.7
0.020
0.046
22.8
N/A
N/A
9.8
10.0
0.7
2000
115
145
0.68
0.67
29.4
17.8
16.0
27.8
0.022
0.072
22.2
N/A
N/A
9.1
10.2
1.0
Natural disasters
Type
Bronx
El Paso
Tornado activity compared to U.S. average
58.3%
4.2%
Earthquake activity compared to U.S. average
31%
524.4%
Natural disasters compared to U.S. average
14%
11%
Transportation
The Bronx has an extensive public transportation network provided by the Metropolitan Transportation Authority, including subways and buses. El Paso relies on Sun Metro's bus routes, the El Paso Streetcar system, and an increasing interest in bike commuting and rideshare services.
Transport
Type
Bronx
El Paso
Amtrak stations
0
1
Amtrak stations nearby
3
1
FAA registered aircraft
39
331
FAA registered aircraft manufacturers and dealers
0
6
Means of transportation to work
Type
Bronx
El Paso
Bicycle
0.2%
0.3%
Bus
15.6%
1.3%
Carpooled
9.3%
11.2%
Car alone
27%
83.4%
Motorcycle
0%
0.2%
Railroad
2%
0%
Streetcar
0.2%
0%
Subway
34.6%
0%
Taxicab
1.3%
0.1%
Walked
7.2%
1.6%
Average travel time to work
Type
Bronx
El Paso
Average
44.2 min
25.1 min
Real Estate
Real estate prices in the Bronx are considerably higher than El Paso due to its urban position, with limited space for expansion. El Paso's real estate industry, conversely, offers affordable housing options, making home ownership more attainable for the average person.
Neighborhoods
The Bronx is rich in diverse neighborhoods, each holding its unique culture and identity. Notable ones include Riverdale, Fordham, and Belmont. El Paso too has vibrant neighborhoods like Sunset Heights, Kern Place, and Mission Hills, each with its unique southwestern charm.
Houses and residents
Type
Bronx
El Paso
Houses
490,659
261,779
Average household size (people)
2.8
3
Houses occupied
463,212 (94.4%)
242,529 (92.6%)
Houses occupied by owners
90,522 (19.5%)
147,788 (60.9%)
Houses occupied by renters
372,690 (80.5%)
94,741 (39.1%)
Median rent asked for vacant for-rent units
$1,273
$570.82
Median price asked for vacant for-sale houses and condos
$708,992
$227,007
Estimated median house or condo value
$465,000
$152,800
Median number of rooms in apartments
3.7
4.3
Median number of rooms in houses and condos
5.1
6.2
Renting percentage
80.7%
39.6%
Housing density (houses/condos per square mile)
11,675
1,051
Household income disparities
50.2%
46.6%
Housing units without a mortgage
12,021 (34%)
1,889 (2.2%)
Housing units with both a second mortgage and home equity loan
105 (0.3%)
2,956 (3.4%)
Housing units with a mortgage
23,339 (66%)
84,973 (97.8%)
Housing units with a home equity loan
2,053 (5.8%)
250 (0.3%)
Housing units with a second mortgage
2,159 (6.1%)
3,635 (4.2%)
Housing units lacking complete kitchen facilities
1.4%
2%
Housing units lacking complete plumbing facilities
Self-employed workers in own not incorporated business
16,572
19,650
State government workers
14,515
12,525
Unpaid family workers
1,000
901
Industries and Occupations
The main industries contributing to the Bronx's economy are healthcare, education, and retail, employing a significant portion of the borough's population. In El Paso, however, the economy is largely driven by military, trade, and manufacturing sectors.
Both cities offer extensive health care systems. The Bronx boasts several top-ranked hospitals, including Montefiore Medical Center and Jacobi Medical Center. El Paso also hosts a collection of highly rated hospitals, like the University Medical Center of El Paso, and William Beaumont Army Medical Center.
Health (county statistics)
Type
Bronx
El Paso
General health status score of residents in this county from 1 (poor) to 5 (excellent)
The Bronx is well-equipped with established infrastructure, characterized by old and new architecture, thoughtfully designed public spaces, and an effective transit system. El Paso also has a solidly developed infrastructure, with an emphasis on newer construction and public transportation.
Infrastructure
Type
Bronx
El Paso
Hospitals
57
41
TV stations
30
10
Bank branches located here
118
89
Bank institutions located here
24
19
Main business address for public companies
2
7
Drinking water stations with no reported violations in the past
1
0
Drinking water stations with reported violations in the past
4
10
Schools
School facilities
Type
Bronx
El Paso
Private elementary/middle schools
54
22
Private high schools
20
16
Public elementary/middle schools
285
174
Public high schools
155
53
Colleges/Universities
9
18
Culture and Food
The Bronx is a melting pot of cultures, known for its diverse food scene, art, and music, together creating a rich and vibrant environment. El Paso’s culture is a blend of Mexican and American influences, evident in its food, music, festivals, and arts scene.
Sports Teams
The Bronx is home to the iconic New York Yankees in baseball. El Paso hosts the El Paso Chihuahuas, a minor league baseball team, along with UTEP's various college sports teams.


 Bronx, NY
 El Paso, TX