Boston, MA, and Yonkers, NY, both belong to prominent US regions, New England and the Tri-State Area respectively, offering unique experiences to residents and tourists. These culturally rich cities vary significantly in aspects like weather, cost of living, education, health care and more. Boston's booming tech industry, prestigious universities, and robust sporting culture contrast with Yonkers' relative cost-effectiveness, suburban feel, and close proximity to Manhattan. This comprehensive comparison addresses key aspects for prospective movers and tourists.
Distance between
Boston, MA and
Yonkers, NY : 172.1 miles
Boston's population is larger by 213%. Its population has grown by 65,635 people (11.1%) since 2000. The population of Yonkers has grown by 13,444 people (6.9%) during that time.
When it comes to safety, both cities have regions with both high and low crime rates, a common characteristic of urban areas. Statistically, Boston has a higher crime rate than Yonkers, but this may be due to its larger population. Yonkers is seen as generally safer, with its crime rate being lower than the national average. However, like any city, both have safe and less safe neighborhoods.
City-data.com crime index counts serious crimes and violent crime more heavily. It adjusts for the number of visitors and daily workers commuting into cities. (higher means more crime, U.S. average = 301.1)
City-data.com crime index counts serious crimes and violent crime more heavily. It adjusts for the number of visitors and daily workers commuting into cities. (higher means more crime, U.S. average = 301.1)
Sex Offenders
According to our data, there are 338 registered sex offenders living in Boston and 122 registered sex offenders living in . The ratio of residents to sex offenders in Boston is 1,991 to 1; the ratio in Yonkers is 1,646 to 1. The number of registered sex offenders compared to the number of residents in Boston is near to than in Yonkers.
Cost of Living
Boston is generally more expensive than Yonkers in terms of cost of living. This applies to housing, groceries, utilities, and transportation. While Yonkers isn't cheap by national standards due to its proximity to New York City, Boston's high cost of living is driven by its booming tech sector and prestigious universities, pushing housing costs particularly high.
Income Tax
Both Massachusetts and New York have progressive income tax systems. Massachusetts has a flat state tax rate of 5%, while New York's state tax ranges from 4% to 8.82%, with Yonkers also imposing a local tax of 16.75%.
Property Tax
Property tax varies in both cities. Boston’s residential tax rate for is slightly lower than Yonkers'. Yonkers, despite lower housing costs, has comparatively high property taxes, which can be a significant consideration for potential homeowners.
Sales Tax
Massachusetts has a relatively moderate state sales tax rate of 6.25%, with no additional city sales tax in Boston. However, Yonkers, in line with whole New York State, has a higher state sales tax rate of 4%, plus city sales tax of about 4.5%, totaling 8.875%.
Income
Type
Boston
Yonkers
Estimated median household income
$79,283
$66,395
Estimated per capita income
$50,337
$37,977
Cost of living index (U.S. average is 100)
143.8
152.2
If you make $50,000 in Boston, you will have to make $52,921 in Yonkers to maintain the same standard of living.
Geographical Conditions
Boston is on the northeastern coast with proximity to luxury Cape Cod beaches and New Hampshire's ski resorts. Yonkers, on the Hudson River just above Manhattan, offers water views, hillside homes, riverfront parks and is close to upstate New York's recreational opportunities.
Boston is internationally renowned for its higher education, with world-class institutions like Harvard University and MIT. While Yonkers doesn't have such high-profile schools, it's a short commute from NYC's excellent universities. In terms of public education, Yonkers has struggled historically but has seen improvement, while Boston’s public schools, though variable, have been highly rated overall.
Economically, Boston relies on industries like healthcare and social assistance, professional, scientific, and technical services, and education. By contrast, Yonkers' economy is diverse, with retail trade, healthcare, and manufacturing sectors providing significant employment. As a career destination, Boston may offer more opportunities in tech and academia, whereas Yonkers provides proximity to the diverse New York City job market.
Biggest Employers
Boston's largest employers include Massachusetts General Hospital, Brigham and Women's Hospital, Boston University, and Liberty Mutual. In Yonkers, the largest employers are the Yonkers Public Schools, Empire City Casino, and St. Joseph’s Medical Center.
There were 53 building permits issued in Boston in 2012 (20 more than in 2011) compared to 12 building permits issued in Yonkers in 2012 (5 more than in 2011).
In Boston (Suffolk County), 77.4% voted for Democrats and 20.8% for Republicans in 2012 Presidential Election. In Yonkers (Westchester County), 62.1% voted for Democrats and 36.9% for Republicans.
Elections
Type
Democrats
Republicans
Other
Year
Boston
Yonkers
Boston
Yonkers
Boston
Yonkers
2020
80.6%
67.8%
17.5%
31.4%
1.9%
0.8%
2016
78.5%
65.0%
16.1%
31.2%
5.4%
3.8%
2012
77.4%
62.1%
20.8%
36.9%
1.8%
0.9%
2008
76.9%
63.7%
21.2%
36.0%
1.8%
0.3%
2004
75.9%
58.2%
22.8%
40.4%
1.3%
1.4%
2000
71.5%
58.9%
20.5%
37.6%
8.0%
3.5%
1996
73.0%
56.9%
19.9%
35.9%
7.0%
7.2%
Breakdown of population affiliated with a religious congregation
Type
Adherents
Congregations
Religion
Boston
Yonkers
Boston
Yonkers
CATHOLIC CHURCH
46.1%
45.9%
12.4%
15.3%
AMERICAN BAPTIST CHURCHES IN THE USA
1.2%
0.6%
8.9%
3.4%
MUSLIM ESTIMATE
1.1%
1.4%
2.4%
1.5%
EPISCOPAL CHURCH
1.0%
1.5%
4.7%
7.5%
SEVENTH DAY ADVENTIST CHURCH
0.7%
0.4%
4.0%
3.5%
SOUTHERN BAPTIST CONVENTION
0.6%
0.1%
6.9%
2.0%
EVANGELICAL LUTHERAN CHURCH IN AMERICA
0.0%
0.5%
0.7%
2.5%
REFORMED CHURCH IN AMERICA
0.0%
0.3%
0.0%
1.7%
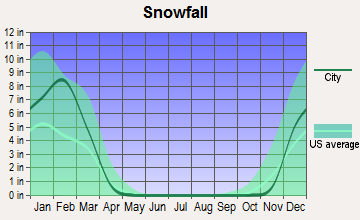
Weather
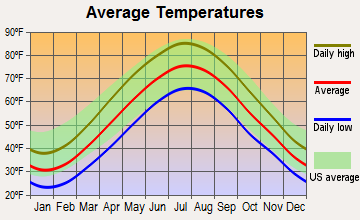
Boston has a typical New England climate, with warm, humid summers and chilly, snowy winters. Nor'easters can bring significant snowfall. Yonkers, being slightly more south, generally has milder winters and hotter summers. For those fond of experiencing all four seasons, either city would be suitable, though Yonkers tends to have slightly milder weather overall.
Weather and climate
Type
Boston
Yonkers
Temperature - Average
50.6°F
53.5°F
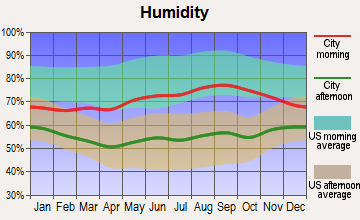
Humidity - Average morning or afternoon humidity
69.9%
67.4%
Humidity - Differences between morning and afternoon humidity
23.1%
26.9%
Humidity - Maximum monthly morning or afternoon humidity
78%
75.9%
Humidity - Minimum monthly morning or afternoon humidity
55%
49%
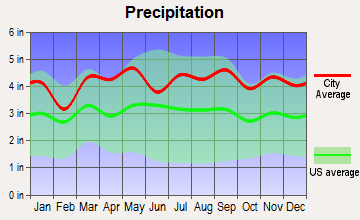
Precipitation - Yearly average
46.3 in
50.1 in
Snowfall - Yearly average
88.3 in
54.9 in
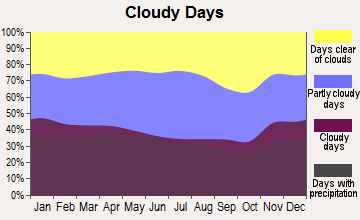
Clouds - Number of days clear of clouds
16.4%
16.7%
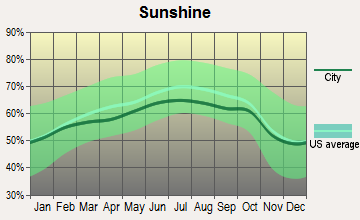
Sunshine amount - Average
63.7%
60.2%
Sunshine amount - Differences during a year
20%
20%
Sunshine amount - Maximum monthly
68%
64%
Sunshine amount - Minimum monthly
48%
44%
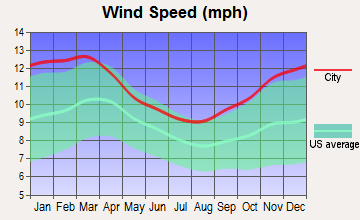
Wind speed - Average
12.5 mph
10 mph
Average climate in Boston, Massachusetts
Average climate in Yonkers, New York
Air pollution
Type
AQI
CO
NO2
OZONE
PB
PM10
PM25
SO2
Year
Boston
Yonkers
Boston
Yonkers
Boston
Yonkers
Boston
Yonkers
Yonkers
Yonkers
Boston
Yonkers
Boston
Yonkers
2018
76
102
0.24
0.30
12.3
16.1
26.1
24.6
N/A
N/A
N/A
N/A
9.2
7.5
0.5
0.6
2017
83
97
0.26
0.10
12.5
16.1
26.4
24.8
N/A
N/A
N/A
N/A
8.9
7.2
0.6
0.5
2016
75
97
0.27
0.28
14.1
16.8
24.4
24.7
N/A
N/A
N/A
N/A
7.4
7.5
0.5
0.7
2015
81
105
0.30
0.29
15.7
18.1
23.4
23.9
N/A
N/A
N/A
N/A
8.9
8.7
0.8
1.3
2014
76
96
0.30
0.33
14.0
18.3
24.5
23.7
N/A
N/A
N/A
N/A
9.3
8.2
1.2
1.6
2013
86
103
0.30
0.39
13.5
18.8
26.2
23.8
N/A
N/A
N/A
N/A
9.8
8.9
1.3
1.9
2012
89
102
0.29
0.43
11.8
18.6
23.5
24.2
N/A
N/A
N/A
N/A
9.5
8.9
1.4
2.8
2011
87
107
0.30
0.45
14.8
20.8
24.2
22.6
N/A
N/A
N/A
N/A
10.5
10.9
1.6
4.1
2010
92
113
0.26
0.48
13.8
19.3
25.0
24.0
N/A
N/A
N/A
N/A
10.0
10.3
2.3
3.7
2009
86
102
0.32
0.50
15.3
21.4
23.5
19.7
N/A
N/A
N/A
N/A
9.7
10.4
2.4
4.5
2008
96
114
0.26
0.51
16.6
22.5
22.9
20.4
0.013
N/A
N/A
N/A
12.4
11.7
3.8
5.0
2007
124
120
0.28
0.58
18.5
24.2
19.9
19.7
0.016
N/A
N/A
N/A
13.9
12.8
4.0
6.0
2006
103
115
0.38
0.53
15.8
23.9
20.9
19.7
0.018
N/A
N/A
N/A
12.5
12.8
3.5
6.1
2005
115
112
0.28
0.62
17.0
26.1
22.1
18.8
N/A
N/A
N/A
N/A
12.7
N/A
4.3
8.1
2004
104
99
0.26
0.63
15.6
25.0
22.5
17.6
0.030
N/A
N/A
N/A
13.7
N/A
4.6
7.9
2003
116
106
0.55
0.74
20.1
26.5
22.4
18.1
0.025
N/A
26.9
N/A
14.5
N/A
5.2
8.0
2002
130
122
0.35
0.68
19.8
26.7
21.8
18.9
N/A
N/A
25.4
N/A
13.5
N/A
5.0
7.6
2001
112
123
0.44
0.69
19.9
28.9
20.7
19.4
N/A
N/A
23.6
N/A
13.6
N/A
5.9
8.9
2000
88
111
0.57
0.71
18.8
29.2
19.2
17.1
N/A
N/A
22.2
N/A
10.0
N/A
5.6
8.4
Natural disasters
Type
Boston
Yonkers
Tornado activity compared to U.S. average
55.3%
60.2%
Earthquake activity compared to U.S. average
26.6%
31.2%
Natural disasters compared to U.S. average
33%
26%
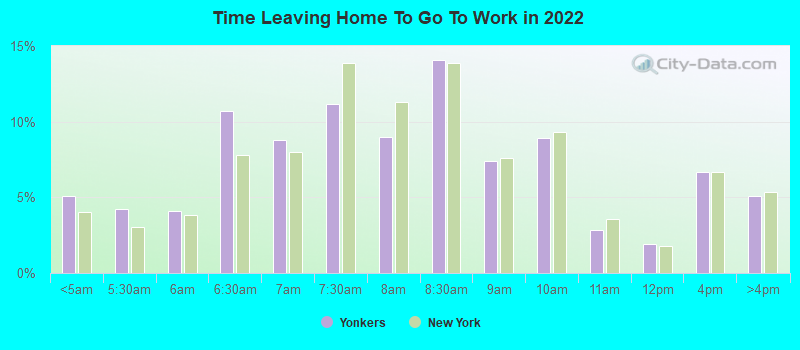
Transportation
Boston's Massachusetts Bay Transportation Authority (MBTA), which includes subway, bus, and ferry routes, is often faster than driving. Yonkers, while bus-reliant, has Metro-North Railroad service into Manhattan. Its proximity to NYC makes it a desirable location for commuters.
Transport
Type
Boston
Yonkers
Amtrak stations
3
1
Amtrak stations nearby
3
3
FAA registered aircraft
224
17
FAA registered aircraft manufacturers and dealers
4
0
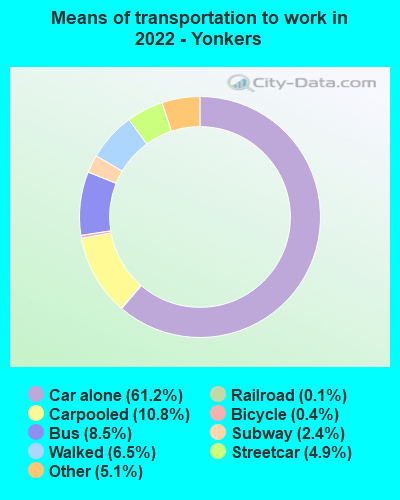
Means of transportation to work
Type
Boston
Yonkers
Bicycle
1.7%
0.1%
Bus
7.1%
13.9%
Carpooled
6.8%
12.2%
Car alone
54.7%
60.3%
Ferryboat
0.2%
0%
Railroad
0.5%
6.2%
Streetcar
13.5%
2.5%
Subway
3.2%
2.5%
Taxicab
0.4%
0.9%
Walked
10%
4.4%
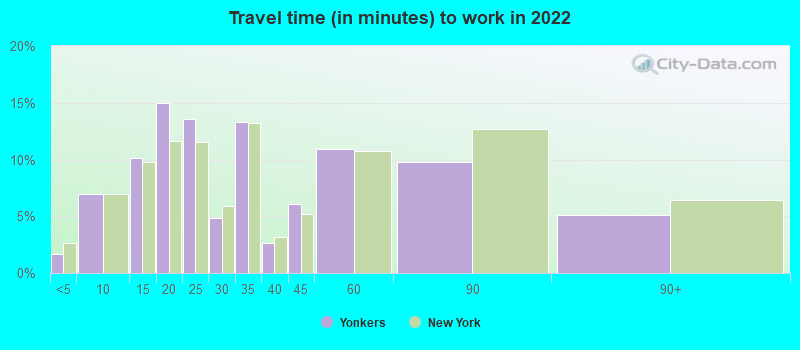
Average travel time to work
Type
Boston
Yonkers
Average
38.6 min
33.9 min
Other means
26.1 min
27.4 min
Public transportation
38.6 min
52 min
Private vehicle occupancy
Type
Boston
Yonkers
Average
1.2
1.2
Drove alone
87.1%
85.9%
In 2 person carpool
10.1%
10.4%
In 3 person carpool
1.7%
1.4%
In 4 person carpool
0.4%
1.1%
In 5-6 person carpool
0.2%
1.1%
In 7+ person carpool
0.5%
0.1%
How many people usually rode to work in the car, truck or van.
Real Estate
Boston's real estate market is competitively high, influenced by its educational and tech sectors. Single-family homes in some of Boston’s preferred neighborhoods can exceed $1m. Meanwhile, Yonkers offers a slightly more affordable market, with a more suburban feel, but prices have been rising due to NYC’s spillover effect.
Neighborhoods
Boston's neighborhoods like Back Bay and Beacon Hill are celebrated for their historic charm, while South Boston is known for its vibrant community. On the other hand, Yonkers boasts neighborhoods such as Park Hill with beautiful views of the Hudson River and Ludlow Park known for its peaceful environment.
Houses and residents
Type
Boston
Yonkers
Houses
307,025
83,368
Average household size (people)
2.3
2.6
Median year apartment built
1957
1964
Length of stay in the house since moving in
14.6 years
16.2 years
Houses occupied
271,941 (88.6%)
81,397 (97.6%)
Houses occupied by owners
94,497 (34.7%)
40,385 (49.6%)
Houses occupied by renters
177,444 (65.3%)
41,012 (50.4%)
Median rent asked for vacant for-rent units
$2,632
$746.05
Median monthly housing costs
$1,883
$1,515
Median price asked for vacant for-sale houses and condos
$1,040,328
$214,056
Estimated median house or condo value
$659,700
$424,100
Median numbers of rooms
4.3
4.5
Median number of rooms in apartments
3.9
3.8
Median number of rooms in houses and condos
5.4
5.5
Median house price - detached houses
$683,896
$633,111
Median house price - in 2-unit structures
$639,493
$422,890
Median house price - in 3-to-4-unit structures
$745,440
$362,555
Median house price - in 5 or more unit structures
$986,433
$246,208
Median house price - Townhouses or other attached units
Over $1,000,000
$360,577
Median house price - All housing units
$793,380
$455,533
Median house age
73
62
Renting percentage
66.1%
53.9%
Housing density (houses/condos per square mile)
6,340.1
4,611.9
House value disparities
23.5%
31%
Household income disparities
48.2%
48.5%
Median household income for houses/condes with a mortgage
$138,364
$129,663
Median household income for apartments without a mortgage
$97,179
$72,991
Housing units without a mortgage
1,250 (1.8%)
759 (3.3%)
Housing units with both a second mortgage and home equity loan
7,686 (11.2%)
2,672 (11.7%)
Housing units with a mortgage
67,144 (98.2%)
21,988 (96.7%)
Housing units with a home equity loan
218 (0.3%)
118 (0.5%)
Housing units with a second mortgage
9,540 (13.9%)
3,163 (13.9%)
House/condo owner moved in on average (years ago)
12
17
House/condo renter moved in on average (years ago)
3
5
Housing units lacking complete kitchen facilities
1.4%
0.9%
Housing units lacking complete plumbing facilities
0.7%
1.3%
Housing units in structures
Housing units in structures
Boston
Yonkers
One, detached
12.0%
24.7%
One, attached
6.4%
6.3%
Two
11.9%
10.0%
3 or 4
24.1%
10.0%
5 to 9
11.2%
5.1%
10 to 19
7.2%
6.1%
20 to 49
8.0%
10.3%
50 or more
19.0%
27.3%
Mobile homes
0.1%
0.1%
Median real estate property taxes paid for housing units
Self-employed workers in own not incorporated business
11,605
5,405
State government workers
12,810
4,428
Unpaid family workers
303
337
Industries and Occupations
A hub for biotechnology, Boston is home to many professionals in scientific, educational, and healthcare roles. Yonkers, while smaller, has a diverse workforce in sectors such as retail, health care, and food services, largely serving the nearby New York City market.
Boston is known for some of the best healthcare facilities in the world like Massachusetts General and Brigham and Women's Hospital. Yonkers, in the shadow of NYC's outstanding hospitals, is home to St. Joseph’s Medical Center and close to Manhattan's top-ranked medical institutions.
Health (county statistics)
Type
Boston
Yonkers
General health status score of residents in this county from 1 (poor) to 5 (excellent)
Boston's historic foundation means some infrastructure is older, but it also boasts a network of subway lines, roads, and airports. Yonkers, while lacking a subway, has train service to NYC and several major highways. Both cities are investing in infrastructure upgrades, making them more appealing places to live.
Infrastructure
Type
Boston
Yonkers
Hospitals
22
7
TV stations
22
30
Bank branches located here
146
52
Bank institutions located here
37
16
Main business address for public companies
60
4
Drinking water stations with no reported violations in the past
2
0
Drinking water stations with reported violations in the past
HMDA - Conventional home purchase loans - Applications denied
Year
Boston
Yonkers
1999
1,237
379
2000
1,140
529
2001
947
366
2002
975
362
2003
1,536
470
2004
2,273
649
2005
3,225
799
2006
3,567
999
2007
2,652
748
2008
1,372
472
2009
910
271
Culture and Food
Boston offers a rich mix of American history, academic culture, and food scene with famous clam chowder and lobster rolls. Yonkers, being close to NYC, is culturally diverse and has a great restaurant scene offering cuisines from around the world thanks to its diverse population.
Sports Teams
Boston is home to notable sports franchises such as the Red Sox (MLB), Bruins (NHL), Celtics (NBA), and the New England Patriots (NFL), in nearby Foxborough. Yankee fans will feel at home in Yonkers, just north of the Bronx, with Madison Square Garden's Knicks (NBA), Rangers (NHL), and the New York Giants and Jets (NFL) being in the Greater New York area.


 Boston, MA
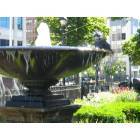
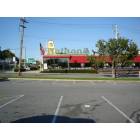
 Yonkers, NY