Boston, MA, and Worcester, MA are two vibrant cities in Massachusetts but with distinct characteristics that appeal to different groups of people. Boston, being one of the oldest cities in the United States, is renowned for its rich history, diverse culture, education, and sports. On the other hand, Worcester, the second-largest city in New England, boasts a strong sense of community, affordability, and approachability that makes it a favorite for families and those seeking a less hectic city life. This comprehensive comparison will elaborate on crime and safety, weather, cost of living, education, economy, infrastructure, taxes, culture, sports, geographical conditions, and health care.
Distance between
Boston, MA and
Worcester, MA : 36.7 miles
Boston's population is larger by 218%. Its population has grown by 65,635 people (11.1%) since 2000. The population of Worcester has grown by 33,270 people (19.3%) during that time.
Boston's crime rates are typically higher than Worcester's, given its larger population and urban environment. However, like any city, crime varies by neighborhood. It's necessary to research individual neighborhood safety levels in both cities prior to considering a move. That said, both cities have dedicated police forces working tirelessly to reduce crime and ensure safety.
City-data.com crime index counts serious crimes and violent crime more heavily. It adjusts for the number of visitors and daily workers commuting into cities. (higher means more crime, U.S. average = 301.1)
City-data.com crime index counts serious crimes and violent crime more heavily. It adjusts for the number of visitors and daily workers commuting into cities. (higher means more crime, U.S. average = 301.1)
Sex Offenders
According to our data, there are 338 registered sex offenders living in Boston and 242 registered sex offenders living in . The ratio of residents to sex offenders in Boston is 1,991 to 1; the ratio in Worcester is 762 to 1. The number of registered sex offenders compared to the number of residents is a lot smaller in Boston than in Worcester.
Cost of Living
Boston is considerably more expensive to live in than Worcester. This includes expenses such as housing, grocery, and health. The cost of living in Boston is high compared to the national average. In contrast, Worcester is an affordable city, with a cost of living slightly below the national average.
Income Tax
Again, being in the same state, both cities share a flat rate state income tax of 5.0%.
Property Tax
Boston has a lower property tax rate compared to Worcester. Therefore, despite higher property values in Boston, the property tax isn't necessarily higher than in Worcester.
Sales Tax
Both cities have the same state sales tax of 6.25%, as they are both located in Massachusetts.
Income
Type
Boston
Worcester
Estimated median household income
$79,283
$63,194
Estimated per capita income
$50,337
$32,772
Cost of living index (U.S. average is 100)
143.8
128.3
If you make $50,000 in Worcester, you will have to make $56,041 in Boston to maintain the same standard of living.
Geographical Conditions
Boston is a coastal city, offering beautiful waterfront views and activities. Worcester, located in central Massachusetts, is known for its rolling hills and beautiful parks.
Boston is known globally for its excellence in education. It is the home to renowned universities like Harvard and MIT. Worcester also boasts quality education with colleges like the Worcester Polytechnic Institute. However, Boston’s reputation in education tends to overshadow Worcester’s.
Boston's economy is robust, with strong sectors in education, healthcare, finance, and technology. Worcester's economy is also steadily growing with health care and education being the dominant industries. Both cities provide ample job opportunities, but Boston offers a lot more variety.
Biggest Employers
Boston's biggest employer is Brigham and Women's Hospital and Massachusetts General Hospital, while in Worcester, UMass Memorial Health Care tops the list.
There were 53 building permits issued in Boston in 2012 (20 more than in 2011) compared to 66 building permits issued in Worcester in 2012 (2 more than in 2011).
In Boston (Suffolk County), 77.4% voted for Democrats and 20.8% for Republicans in 2012 Presidential Election. In Worcester (Worcester County), 53.7% voted for Democrats and 44.3% for Republicans.
Elections
Type
Democrats
Republicans
Other
Year
Boston
Worcester
Boston
Worcester
Boston
Worcester
2020
80.6%
57.6%
17.5%
39.7%
1.9%
2.7%
2016
78.5%
51.0%
16.1%
40.5%
5.4%
8.5%
2012
77.4%
53.7%
20.8%
44.3%
1.8%
2.0%
2008
76.9%
55.8%
21.2%
42.0%
1.8%
2.2%
2004
75.9%
56.6%
22.8%
42.5%
1.3%
0.9%
2000
71.5%
56.2%
20.5%
36.9%
8.0%
6.9%
1996
73.0%
58.3%
19.9%
29.8%
7.0%
11.9%
Breakdown of population affiliated with a religious congregation
Type
Adherents
Congregations
Religion
Boston
Worcester
Boston
Worcester
CATHOLIC CHURCH
46.1%
38.4%
12.4%
20.1%
AMERICAN BAPTIST CHURCHES IN THE USA
1.2%
0.7%
8.9%
4.6%
MUSLIM ESTIMATE
1.1%
0.1%
2.4%
0.3%
EPISCOPAL CHURCH
1.0%
1.2%
4.7%
4.8%
SEVENTH DAY ADVENTIST CHURCH
0.7%
0.8%
4.0%
4.6%
SOUTHERN BAPTIST CONVENTION
0.6%
0.2%
6.9%
3.3%
EVANGELICAL LUTHERAN CHURCH IN AMERICA
0.0%
0.8%
0.7%
2.2%
Weather
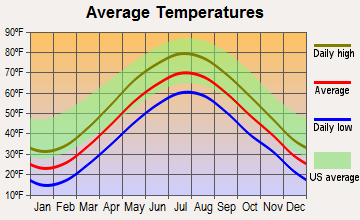
Weather in both cities is typically New England weather. Winters can be harsh, and summers can be hot and humid. However, Boston, located on the coast, often experiences more mild climate compared to Worcester that is a bit more centrally located and might experience slightly more extreme weather conditions.
Weather and climate
Type
Boston
Worcester
Temperature - Average
50.6°F
47.1°F
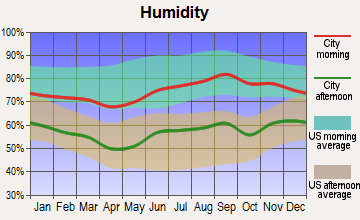
Humidity - Average morning or afternoon humidity
69.9%
71.5%
Humidity - Differences between morning and afternoon humidity
23.1%
32%
Humidity - Maximum monthly morning or afternoon humidity
78%
81%
Humidity - Minimum monthly morning or afternoon humidity
55%
49.1%
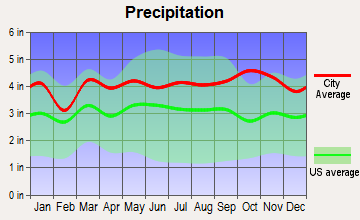
Precipitation - Yearly average
46.3 in
48.9 in
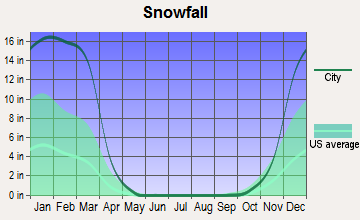
Snowfall - Yearly average
88.3 in
133.4 in
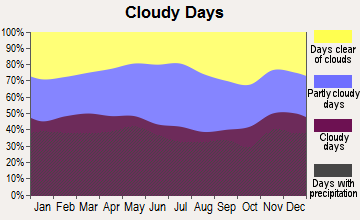
Clouds - Number of days clear of clouds
16.4%
15.2%
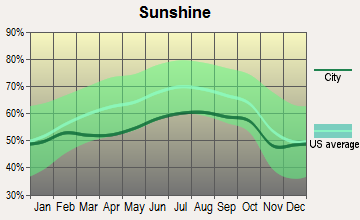
Sunshine amount - Average
63.7%
63%
Sunshine amount - Differences during a year
20%
18.5%
Sunshine amount - Maximum monthly
68%
66.3%
Sunshine amount - Minimum monthly
48%
47.8%
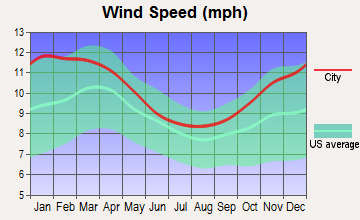
Wind speed - Average
12.5 mph
11 mph
Average climate in Boston, Massachusetts
Average climate in Worcester, Massachusetts
Air pollution
Type
AQI
CO
NO2
OZONE
PM25
SO2
Year
Boston
Worcester
Boston
Worcester
Boston
Worcester
Boston
Worcester
Boston
Worcester
Boston
Worcester
2018
76
71
0.24
0.28
12.3
11.2
26.1
31.5
9.2
6.8
0.5
0.6
2017
83
69
0.26
0.28
12.5
11.5
26.4
32.3
8.9
5.5
0.6
0.8
2016
75
73
0.27
0.25
14.1
12.2
24.4
33.6
7.4
6.2
0.5
0.7
2015
81
68
0.30
0.26
15.7
13.4
23.4
32.6
8.9
7.0
0.8
0.5
2014
76
71
0.30
0.32
14.0
13.1
24.5
33.2
9.3
7.7
1.2
1.5
2013
86
82
0.30
0.39
13.5
11.8
26.2
34.5
9.8
8.3
1.3
2.7
2012
89
84
0.29
0.51
11.8
12.8
23.5
37.5
9.5
7.7
1.4
3.2
2011
87
82
0.30
0.46
14.8
17.4
24.2
34.8
10.5
9.8
1.6
2.7
2010
92
88
0.26
0.50
13.8
13.9
25.0
37.4
10.0
9.9
2.3
2.1
2009
86
85
0.32
0.53
15.3
14.4
23.5
N/A
9.7
8.3
2.4
1.1
2008
96
94
0.26
0.54
16.6
14.9
22.9
38.5
12.4
8.0
3.8
2.6
2007
124
115
0.28
0.52
18.5
15.7
19.9
N/A
13.9
9.0
4.0
3.4
2006
103
98
0.38
0.53
15.8
15.2
20.9
38.7
12.5
8.8
3.5
2.8
2005
115
101
0.28
0.55
17.0
14.9
22.1
N/A
12.7
10.0
4.3
4.6
2004
104
92
0.26
0.41
15.6
15.8
22.5
N/A
13.7
11.6
4.6
2.6
2003
116
82
0.55
0.51
20.1
15.6
22.4
N/A
14.5
N/A
5.2
N/A
2002
130
87
0.35
0.52
19.8
17.4
21.8
39.0
13.5
N/A
5.0
N/A
2001
112
98
0.44
0.57
19.9
20.0
20.7
32.6
13.6
N/A
5.9
N/A
2000
88
76
0.57
0.52
18.8
18.6
19.2
31.2
10.0
N/A
5.6
N/A
Natural disasters
Type
Boston
Worcester
Tornado activity compared to U.S. average
55.3%
79.8%
Earthquake activity compared to U.S. average
26.6%
28.4%
Natural disasters compared to U.S. average
33%
27%
Transportation
Boston boasts a more comprehensive public transport system, known as the MBTA, that includes buses, ferries, and the subway system. Worcester has a bus system operated by the WRTA, but it's less extensive. Commute times are generally shorter in Worcester than in Boston.
Transport
Type
Boston
Worcester
Amtrak stations
3
0
Amtrak stations nearby
3
2
FAA registered aircraft
224
21
FAA registered aircraft manufacturers and dealers
4
9
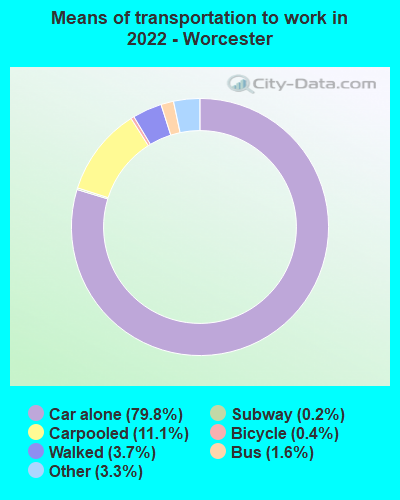
Means of transportation to work
Type
Boston
Worcester
Bicycle
1.7%
0.4%
Bus
7.1%
1.3%
Carpooled
6.8%
9.8%
Car alone
54.7%
81.3%
Ferryboat
0.2%
0%
Railroad
0.5%
0.4%
Streetcar
13.5%
0%
Subway
3.2%
0.1%
Taxicab
0.4%
0.4%
Walked
10%
4.6%
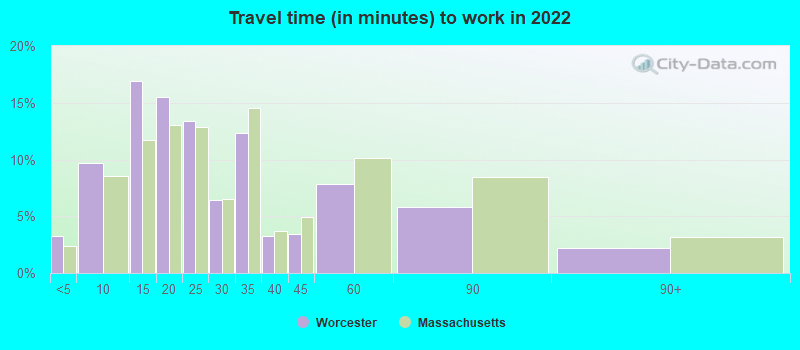
Average travel time to work
Type
Boston
Worcester
Average
38.6 min
26.5 min
Other means
26.1 min
23.3 min
Public transportation
38.6 min
34 min
Private vehicle occupancy
Type
Boston
Worcester
Average
1.2
1.2
Drove alone
87.1%
85.3%
In 2 person carpool
10.1%
11.9%
In 3 person carpool
1.7%
1.6%
In 4 person carpool
0.4%
0.6%
In 5-6 person carpool
0.2%
0.3%
In 7+ person carpool
0.5%
0.2%
How many people usually rode to work in the car, truck or van.
Real Estate
Boston’s real estate is comparatively expensive, reflecting the high demand for housing in the thriving city. Worcester's real estate is more affordable, making it an attractive option for those looking to buy property in Massachusetts but cannot afford Boston prices.
Neighborhoods
Boston features diverse neighborhoods that cater to different lifestyles, from the bustling downtown area to the peaceful suburbs. Worcester also offers a variety of neighborhoods, from urban to suburban, but on a smaller scale.
Houses and residents
Type
Boston
Worcester
Houses
307,025
82,375
Average household size (people)
2.3
2.5
Median year apartment built
1957
1960
Length of stay in the house since moving in
14.6 years
15.8 years
Houses occupied
271,941 (88.6%)
76,065 (92.3%)
Houses occupied by owners
94,497 (34.7%)
32,714 (43%)
Houses occupied by renters
177,444 (65.3%)
43,351 (57%)
Median rent asked for vacant for-rent units
$2,632
$1,034
Median monthly housing costs
$1,883
$1,314
Median price asked for vacant for-sale houses and condos
$1,040,328
$425,443
Estimated median house or condo value
$659,700
$317,800
Median numbers of rooms
4.3
5.1
Median number of rooms in apartments
3.9
4.3
Median number of rooms in houses and condos
5.4
6.1
Median house price - detached houses
$683,896
$338,239
Median house price - in 2-unit structures
$639,493
$252,487
Median house price - in 3-to-4-unit structures
$745,440
$352,758
Median house price - in 5 or more unit structures
$986,433
$213,457
Median house price - Townhouses or other attached units
Over $1,000,000
$290,622
Median house price - All housing units
$793,380
$317,463
Median house age
73
67
Renting percentage
66.1%
55.5%
Housing density (houses/condos per square mile)
6,340.1
2,193.1
House value disparities
23.5%
25.3%
Household income disparities
48.2%
46.9%
Median household income for houses/condes with a mortgage
$138,364
$102,992
Median household income for apartments without a mortgage
$97,179
$78,632
Housing units without a mortgage
1,250 (1.8%)
687 (3%)
Housing units with both a second mortgage and home equity loan
7,686 (11.2%)
2,013 (8.8%)
Housing units with a mortgage
67,144 (98.2%)
22,130 (97%)
Housing units with a home equity loan
218 (0.3%)
289 (1.3%)
Housing units with a second mortgage
9,540 (13.9%)
2,828 (12.4%)
House/condo owner moved in on average (years ago)
12
15
House/condo renter moved in on average (years ago)
3
3
Housing units lacking complete kitchen facilities
1.4%
1.6%
Housing units lacking complete plumbing facilities
0.7%
1.1%
Housing units in structures
Housing units in structures
Boston
Worcester
One, detached
12.0%
32.1%
One, attached
6.4%
6.4%
Two
11.9%
7.9%
3 or 4
24.1%
25.1%
5 to 9
11.2%
8.6%
10 to 19
7.2%
5.4%
20 to 49
8.0%
4.4%
50 or more
19.0%
10.0%
Mobile homes
0.1%
0.1%
Median real estate property taxes paid for housing units
Self-employed workers in own not incorporated business
11,605
5,036
State government workers
12,810
5,706
Unpaid family workers
303
42
Industries and Occupations
Boston is known for its robust healthcare, education, finance, tech, and biotech industries. Worcester's economy, on the other hand, is primarily centered around healthcare and education, with a fair share of manufacturing jobs.
Both Boston and Worcester have excellent healthcare systems. Boston is renowned worldwide for its healthcare offerings, with some of the best hospitals in the world. Worcester also offers quality health services, with the UMass Memorial Medical Center being a prominent provider.
Health (county statistics)
Type
Boston
Worcester
General health status score of residents in this county from 1 (poor) to 5 (excellent)
Boston's infrastructure is more developed than Worcester's. It offers numerous amenities, entertainment venues, and historical sites. Worcester, while smaller, also provides various amenities, including parks, restaurants, and cultural attractions, but on a smaller scale.
Infrastructure
Type
Boston
Worcester
Hospitals
22
14
TV stations
22
24
Arenas or stadiums
3
2
Bank branches located here
146
47
Bank institutions located here
37
12
Main business address for public companies
60
2
Drinking water stations with no reported violations in the past
2
0
Drinking water stations with reported violations in the past
HMDA - Conventional home purchase loans - Applications denied
Year
Boston
Worcester
1999
1,237
262
2000
1,140
328
2001
947
237
2002
975
312
2003
1,536
469
2004
2,273
822
2005
3,225
1,210
2006
3,567
1,134
2007
2,652
721
2008
1,372
375
2009
910
274
Culture and Food
Boston’s rich history and diverse population have created a vibrant cultural scene and diverse food options. Worcester, often called the "heart of the Commonwealth," also presents a diverse culture and thriving food scene, albeit on a smaller scale.
Sports Teams
Boston is home to several professional sports teams including the Boston Red Sox, Boston Celtics, New England Patriots, and Boston Bruins. Worcester doesn't have any major league sports teams but does have minor league teams and college sports.


 Boston, MA
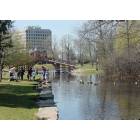
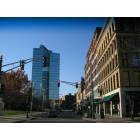
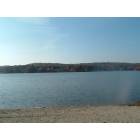
 Worcester, MA