### Overview
Comparing Boston, Massachusetts, and Rochester, New York, takes into account a broad variety of factors that contribute to the quality of life. While both cities have historical roots, each offers a unique experience in terms of crime rates, weather conditions, cost of living, education, labor market, infrastructure, industries, real estate, and more. The comparison below aims to provide a deep dive into these aspects and more, presenting a comprehensive picture to those considering a move or just a visit to either city.
### Crime/Safety
Boston is considered safer than Rochester based on crime statistics, with a higher crime rate in Rochester. Boston has pursued successful community policing strategies, reducing violent crime rates. In contrast, Rochester struggles with higher crime rates, though the city's measures to implement community-centered solutions show promise for the future.
### Weather
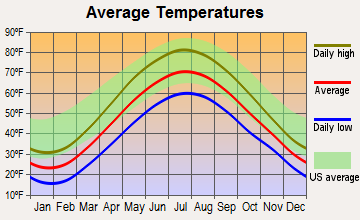
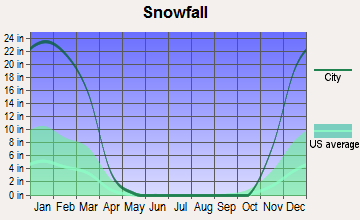
Boston experiences a humid continental climate, meaning summers are typically warm and humid, while winters are cold, snowy, and windy. Its coastal location can lead to significant snowfall. Conversely, Rochester experiences a similar climate but has one of the highest snowfall rates among major U.S. cities, making winters particularly challenging.
### Cost of Living
Boston has a higher cost of living compared to Rochester. Everyday expenses like groceries, housing, and healthcare are notably costlier in Boston. Individuals looking for more affordable living costs might find Rochester an attractive choice.
### Education
Boston boasts world-class educational institutions, including Harvard and MIT. The city's education sector is a significant contributor to its economy. Rochester, though smaller, is renowned in education, particularly through the University of Rochester and the Rochester Institute of Technology.
### Work and Economy
Boston's economy is robust, driven by sectors such as education, healthcare, finance, and technology. Rochester's economy, however, has transitioned from a manufacturing base to a service-oriented economy, featuring significant healthcare and education sectors.
### Infrastructure
Boston's infrastructure is well developed, featuring historic and modern architecture, with a wide range of public facilities. In Rochester, the infrastructure has been upgraded to support the evolving needs of its population, though it has seen a more gradual development compared to Boston.
### Industries and Occupations
Boston's top industries include education, healthcare, finance, and technology, with professionals in these fields often finding a wealth of opportunities. In Rochester, healthcare and education dominate, but emerging sectors include optics and photonics technology.
### Biggest Employers
In Boston, the biggest employers are Massachusetts General Hospital, Brigham and Women's Hospital, and Boston University. In Rochester, the largest employers include the University of Rochester and Rochester Regional Health.
### Real-Estate
Boston's real estate market is considerably pricier, with median home prices significantly higher than national averages. Rochester's real estate is much more affordable, offering great opportunities for homeownership for first-time buyers.
### Neighborhoods
Boston has a mix of historic and modern neighborhoods, each with their unique charm. Beacon Hill and Back Bay present a historic atmosphere, while Seaport offers modern amenities. Rochester's neighborhoods such as Park Avenue and East Avenue offer a blend of vintage and modern homes.
### Transportation/Public Transit/Commuting
Boston offers several public transportation options, including the MBTA system, ferries, and bike-sharing schemes. Rochester's public transit is primarily bus-based, though initiatives to improve public transportation options have been launched.
### City/State Sales Tax
The overall sales tax rate in Boston, MA, is slightly higher than in Rochester, NY. Massachusetts has a sales tax rate of 6.25%, while New York's state sales tax rate is 4%, although additional local taxes can bring the total to 8.5%.
### City/State Income Tax
The state income tax in Massachusetts is at a flat rate of 5%, whereas New York has a progressive income tax system, ranging from 4% to 8.82%. This means Boston is potentially a more appealing choice for high-earners.
### City/State Property Tax
Boston's property tax rates are generally lower than those in Rochester. Boston's rates currently stand at 0.88% while Rochester's rates are around 3.75%.
### Culture/Food
Boston's cultural life is rich, featuring historic sites, and its food scene is famous for seafood, particularly clam chowder and lobster. Meanwhile, Rochester has a strong arts culture and is known for its unique "Garbage Plate."
### Sports Teams
Boston is known for its sports teams, including the Red Sox (MLB), the Celtics (NBA), and the Bruins (NHL), and the New England Patriots (NFL). Rochester offers minor league sports, with popular teams like the Red Wings (baseball) and the Amerks (hockey).
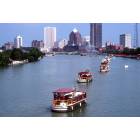
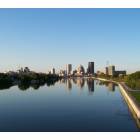
### Geographical Conditions
While both cities are near water, Boston's coastal locale significantly shapes its geographical context. Rochester is situated on the southern shore of Lake Ontario, with the Genesee River adding to its scenic lakeside aesthetic.
### Health Care
Boston is a nationally recognized leader in healthcare, with numerous world-renowned hospitals. On the other hand, Rochester offers quality healthcare services, with strong providers like the University of Rochester Medical Center.
### Summary
Boston and Rochester each offer unique advantages and downsides. Boston stands out with its educational institutions, robust economy, and rich cultural life but comes with a high cost of living. On the other hand, Rochester's affordability, strong education sector, and burgeoning technology industry might appeal to those seeking lower living costs without sacrificing key amenities. It can be concluded that the choice between Boston and Rochester depends largely on individual priorities, including professional opportunities, budget constraints, and lifestyle preferences.
Distance between
Boston, MA and
Rochester, NY : 335.9 miles
Boston's population is larger by 211%. Its population has grown by 65,635 people (11.1%) since 2000. The population of Rochester has decreased by 9,167 people (4.2%) during that time.
City-data.com crime index counts serious crimes and violent crime more heavily. It adjusts for the number of visitors and daily workers commuting into cities. (higher means more crime, U.S. average = 301.1)
City-data.com crime index counts serious crimes and violent crime more heavily. It adjusts for the number of visitors and daily workers commuting into cities. (higher means more crime, U.S. average = 301.1)
Sex Offenders
According to our data, there are 338 registered sex offenders living in Boston and 982 registered sex offenders living in . The ratio of residents to sex offenders in Boston is 1,991 to 1; the ratio in Rochester is 213 to 1. The number of registered sex offenders compared to the number of residents is a lot smaller in Boston than in Rochester.
Income
Type
Boston
Rochester
Estimated median household income
$79,283
$41,980
Estimated per capita income
$50,337
$26,950
Cost of living index (U.S. average is 100)
143.8
102.1
If you make $50,000 in Rochester, you will have to make $70,421 in Boston to maintain the same standard of living.
There were 53 building permits issued in Boston in 2012 (20 more than in 2011) compared to 45 building permits issued in Rochester in 2012 (1 less than in 2011).
In Boston (Suffolk County), 77.4% voted for Democrats and 20.8% for Republicans in 2012 Presidential Election. In Rochester (Monroe County), 58.2% voted for Democrats and 40.1% for Republicans.
Elections
Type
Democrats
Republicans
Other
Year
Boston
Rochester
Boston
Rochester
Boston
Rochester
2020
80.6%
59.5%
17.5%
38.4%
1.9%
2.2%
2016
78.5%
54.3%
16.1%
39.3%
5.4%
6.5%
2012
77.4%
58.2%
20.8%
40.1%
1.8%
1.7%
2008
76.9%
58.4%
21.2%
40.6%
1.8%
1.0%
2004
75.9%
50.7%
22.8%
47.8%
1.3%
1.5%
2000
71.5%
51.0%
20.5%
44.5%
8.0%
4.5%
1996
73.0%
53.2%
19.9%
37.3%
7.0%
9.5%
Breakdown of population affiliated with a religious congregation
Type
Adherents
Congregations
Religion
Boston
Rochester
Boston
Rochester
CATHOLIC CHURCH
46.1%
25.7%
12.4%
11.2%
AMERICAN BAPTIST CHURCHES IN THE USA
1.2%
1.6%
8.9%
5.1%
MUSLIM ESTIMATE
1.1%
1.2%
2.4%
1.1%
EPISCOPAL CHURCH
1.0%
0.7%
4.7%
3.5%
SEVENTH DAY ADVENTIST CHURCH
0.7%
0.2%
4.0%
1.4%
SOUTHERN BAPTIST CONVENTION
0.6%
0.1%
6.9%
2.1%
LUTHERAN CHURCH
0.1%
1.0%
0.4%
1.9%
EVANGELICAL LUTHERAN CHURCH IN AMERICA
0.0%
1.1%
0.7%
3.3%
Weather and climate
Type
Boston
Rochester
Temperature - Average
50.6°F
47.6°F
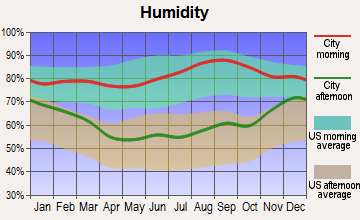
Humidity - Average morning or afternoon humidity
69.9%
76.5%
Humidity - Differences between morning and afternoon humidity
23.1%
34%
Humidity - Maximum monthly morning or afternoon humidity
78%
87%
Humidity - Minimum monthly morning or afternoon humidity
55%
53%
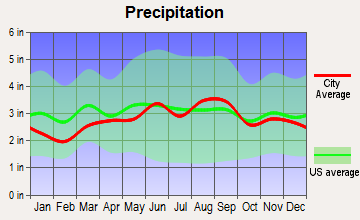
Precipitation - Yearly average
46.3 in
33.7 in
Snowfall - Yearly average
88.3 in
178.7 in
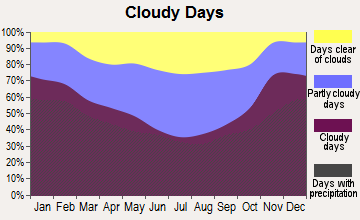
Clouds - Number of days clear of clouds
16.4%
10.2%
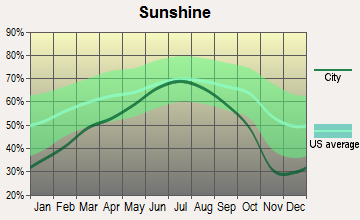
Sunshine amount - Average
63.7%
52.1%
Sunshine amount - Differences during a year
20%
43%
Sunshine amount - Maximum monthly
68%
67%
Sunshine amount - Minimum monthly
48%
24%
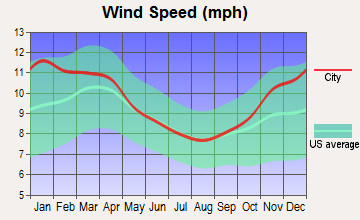
Wind speed - Average
12.5 mph
9.7 mph
Average climate in Boston, Massachusetts
Average climate in Rochester, New York
Air pollution
Type
AQI
CO
NO2
OZONE
PM25
SO2
Year
Boston
Rochester
Boston
Rochester
Boston
Rochester
Boston
Rochester
Boston
Rochester
Boston
Rochester
2018
76
65
0.24
0.24
12.3
N/A
26.1
27.4
9.2
6.1
0.5
0.2
2017
83
67
0.26
0.23
12.5
N/A
26.4
29.3
8.9
6.2
0.6
0.5
2016
75
67
0.27
0.21
14.1
N/A
24.4
28.1
7.4
6.1
0.5
0.7
2015
81
65
0.30
0.21
15.7
N/A
23.4
26.4
8.9
7.1
0.8
0.8
2014
76
62
0.30
0.20
14.0
N/A
24.5
26.8
9.3
6.8
1.2
1.0
2013
86
64
0.30
0.20
13.5
N/A
26.2
27.5
9.8
7.7
1.3
0.9
2012
89
73
0.29
0.21
11.8
N/A
23.5
27.9
9.5
6.8
1.4
1.0
2011
87
67
0.30
0.19
14.8
8.1
24.2
27.2
10.5
6.8
1.6
1.1
2010
92
74
0.26
0.43
13.8
N/A
25.0
27.7
10.0
7.3
2.3
2.2
2009
86
64
0.32
0.42
15.3
N/A
23.5
24.4
9.7
6.9
2.4
2.5
2008
96
83
0.26
0.38
16.6
N/A
22.9
26.6
12.4
8.5
3.8
2.9
2007
124
86
0.28
0.42
18.5
N/A
19.9
25.6
13.9
9.2
4.0
4.1
2006
103
58
0.38
0.49
15.8
N/A
20.9
23.6
12.5
N/A
3.5
4.2
2005
115
67
0.28
0.46
17.0
N/A
22.1
23.5
12.7
N/A
4.3
4.2
2004
104
43
0.26
0.48
15.6
N/A
22.5
21.6
13.7
N/A
4.6
5.1
2003
116
66
0.55
0.49
20.1
N/A
22.4
24.9
14.5
N/A
5.2
5.4
2002
130
84
0.35
0.43
19.8
N/A
21.8
27.7
13.5
N/A
5.0
5.2
2001
112
70
0.44
0.42
19.9
N/A
20.7
25.7
13.6
N/A
5.9
7.6
2000
88
62
0.57
0.42
18.8
N/A
19.2
23.3
10.0
N/A
5.6
5.7
Natural disasters
Type
Boston
Rochester
Tornado activity compared to U.S. average
55.3%
17.1%
Earthquake activity compared to U.S. average
26.6%
31.8%
Natural disasters compared to U.S. average
33%
17%
Transport
Type
Boston
Rochester
Amtrak stations
3
1
Amtrak stations nearby
3
1
FAA registered aircraft
224
151
FAA registered aircraft manufacturers and dealers
4
1
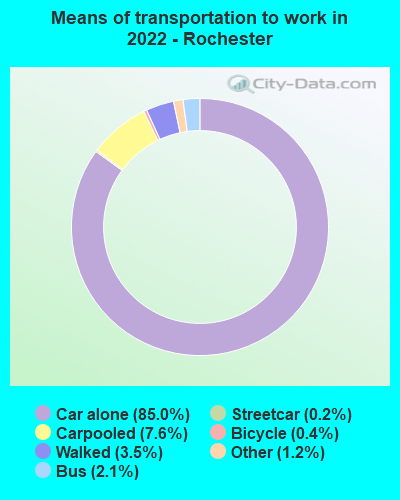
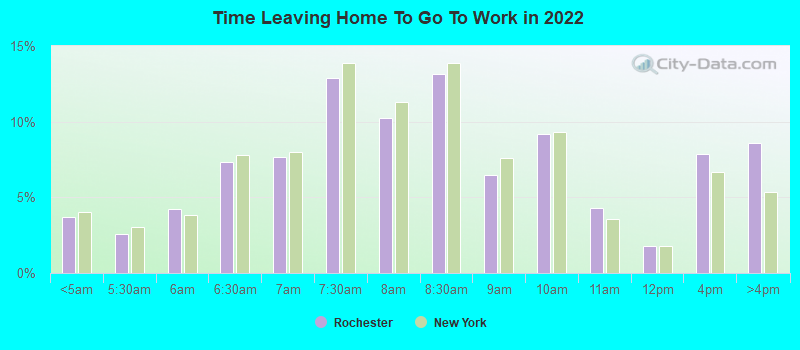
Means of transportation to work
Type
Boston
Rochester
Bicycle
1.7%
0.7%
Bus
7.1%
2.9%
Carpooled
6.8%
10%
Car alone
54.7%
81.8%
Ferryboat
0.2%
0%
Motorcycle
0.1%
0.1%
Railroad
0.5%
0%
Streetcar
13.5%
0.2%
Subway
3.2%
0%
Taxicab
0.4%
0.3%
Walked
10%
2.8%
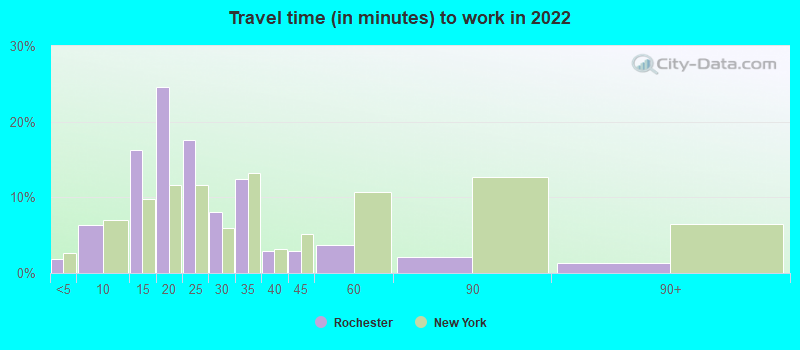
Average travel time to work
Type
Boston
Rochester
Average
38.6 min
22.3 min
Other means
26.1 min
18.9 min
Public transportation
38.6 min
38.9 min
Private vehicle occupancy
Type
Boston
Rochester
Average
1.2
1.2
Drove alone
87.1%
85.7%
In 2 person carpool
10.1%
11%
In 3 person carpool
1.7%
1.5%
In 4 person carpool
0.4%
1.2%
In 5-6 person carpool
0.2%
0.4%
In 7+ person carpool
0.5%
0.2%
How many people usually rode to work in the car, truck or van.
Houses and residents
Type
Boston
Rochester
Houses
307,025
103,333
Average household size (people)
2.3
2.3
Median year apartment built
1957
1945
Length of stay in the house since moving in
14.6 years
15.3 years
Houses occupied
271,941 (88.6%)
93,263 (90.3%)
Houses occupied by owners
94,497 (34.7%)
38,125 (40.9%)
Houses occupied by renters
177,444 (65.3%)
55,138 (59.1%)
Median rent asked for vacant for-rent units
$2,632
$630.70
Median monthly housing costs
$1,883
$881
Median price asked for vacant for-sale houses and condos
$1,040,328
$160,052
Estimated median house or condo value
$659,700
$109,700
Median numbers of rooms
4.3
5.2
Median number of rooms in apartments
3.9
4.1
Median number of rooms in houses and condos
5.4
6.3
Median house price - detached houses
$683,896
$130,415
Median house price - in 2-unit structures
$639,493
$173,805
Median house price - in 3-to-4-unit structures
$745,440
$340,804
Median house price - in 5 or more unit structures
$986,433
$428,520
Median house price - mobile homes
$117,668
$28,854
Median house price - Townhouses or other attached units
Over $1,000,000
$183,602
Median house price - All housing units
$793,380
$148,505
Median house age
73
2,021
Renting percentage
66.1%
62.3%
Housing density (houses/condos per square mile)
6,340.1
2,883.6
House value disparities
23.5%
40.7%
Household income disparities
48.2%
48.9%
Median household income for houses/condes with a mortgage
$138,364
$69,171
Median household income for apartments without a mortgage
$97,179
$52,361
Housing units without a mortgage
1,250 (1.8%)
1,391 (5.4%)
Housing units with both a second mortgage and home equity loan
7,686 (11.2%)
3,040 (11.8%)
Housing units with a mortgage
67,144 (98.2%)
24,344 (94.6%)
Housing units with a home equity loan
218 (0.3%)
99 (0.4%)
Housing units with a second mortgage
9,540 (13.9%)
3,389 (13.2%)
House/condo owner moved in on average (years ago)
12
15
House/condo renter moved in on average (years ago)
3
3
Housing units lacking complete kitchen facilities
1.4%
1.8%
Housing units lacking complete plumbing facilities
0.7%
1.1%
Housing units in structures
Housing units in structures
Boston
Rochester
One, detached
12.0%
47.7%
One, attached
6.4%
5.8%
Two
11.9%
17.4%
3 or 4
24.1%
8.0%
5 to 9
11.2%
5.0%
10 to 19
7.2%
2.7%
20 to 49
8.0%
4.4%
50 or more
19.0%
8.7%
Mobile homes
0.1%
0.3%
Median real estate property taxes paid for housing units


 Boston, MA
 Rochester, NY