Baltimore, MD, and Arlington, VA, both offer unique living experiences shaped by their diverse cultures, economies, and systems. Baltimore, known for its rich history and vibrant harbor, presents an eclectic mix of neighborhoods and a city feel, while Arlington, with its proximity to Washington D.C., offers a more suburban lifestyle. This comparison will take a detailed look into crime and safety, weather, cost of living, and much more, to give a comprehensive view of what each location has to offer to residents and tourists alike.
Distance between
Baltimore, MD and
Arlington, VA : 39.6 miles
Baltimore's population is larger by 148%. Its population has decreased by 74,656 people (11.5%) since 2000. The population of Arlington has grown by 43,512 people (23.0%) during that time.
Baltimore's crime rate is higher than the national average, with a significant number of property and violent crimes. The city has been implementing various strategies to combat this, including police reforms and community outreach programs. On the other hand, Arlington boasts a low crime rate, ranking as one of the safest cities in the country. The areas around Arlington are typically very safe, making it appealing for families and individuals seeking a secure environment.
Cost of Living
The overall cost of living in Arlington is higher than Baltimore. Everything from housing to groceries tends to be more expensive in Arlington. However, this is balanced by the higher average income in Arlington compared to Baltimore. By comparison, Baltimore offers a more affordable lifestyle, especially in terms of housing, which is significantly lower than Arlington's.
Income Tax
Baltimore residents are taxed at state level with rates ranging from 2% to 5.75%, plus a Baltimore city tax rate of 3.2%. In Arlington, Virginia's state income tax rates range from 2% to 5.75% with no additional local income taxes.
Property Tax
In Baltimore, the property tax rate is quite high compared to the national average. However, various tax credit programs are available for city residents. Arlington's property taxes are comparatively lower but the actual tax bill could be higher due to area's high property values.
Sales Tax
Baltimore has a 6% state sales tax rate with no additional city sales tax. Arlington, in contrast, has a combined state and local sales tax rate of 6% as well, with a 5% state sales tax rate and additional 1% county sales tax.
Income
Type
Baltimore
Arlington
Estimated median household income
$54,652
$125,651
Estimated per capita income
$35,091
$80,996
Cost of living index (U.S. average is 100)
105.7
171.8
If you make $50,000 in Baltimore, you will have to make $81,268 in Arlington to maintain the same standard of living.
Geographical Conditions
Baltimore, located by the Chesapeake Bay, offers scenic water views and easy access to boating and water activities. Arlington, on the other hand, has more of a suburban landscape with its hilly topography and numerous parks.
Baltimore offers a diversity of educational options, with over 200 public and charter schools, and a number of renowned private schools. It also hosts world-class institutions like Johns Hopkins University. Arlington's education system is rated among the best in the country, with high graduation rates. It offers top-rated public schools, and is in proximity to several higher education institutions including Georgetown University and George Washington University.
Baltimore has a diverse economy based on sectors such as health care, education, and high-tech industry. The job growth, however, is slow compared to national averages. Arlington has a strong job market with fast growth rate, boasting a high concentration of public sector jobs due to its proximity to Washington D.C., alongside jobs in education, health care and technical services.
Biggest Employers
Baltimore's biggest employers include Johns Hopkins Hospital and Johns Hopkins University, followed by the government. In Arlington, top employers include the Department of Defense, Department of Homeland Security, and various consulting firms.
In Baltimore (Baltimore city), 87.4% voted for Democrats and 11.1% for Republicans in 2012 Presidential Election. In Arlington (Arlington County), 69.3% voted for Democrats and 29.4% for Republicans.
Elections
Type
Democrats
Republicans
Other
Year
Baltimore
Arlington
Baltimore
Arlington
Baltimore
Arlington
2020
87.5%
80.6%
10.7%
17.1%
1.8%
2.3%
2016
84.8%
75.8%
10.5%
16.6%
4.6%
7.5%
2012
87.4%
69.3%
11.1%
29.4%
1.4%
1.3%
2008
87.6%
71.8%
11.7%
27.2%
0.6%
1.0%
2004
82.5%
67.6%
17.1%
31.3%
0.5%
1.1%
2000
82.9%
60.4%
14.2%
34.3%
2.9%
5.3%
1996
79.3%
60.5%
15.5%
34.6%
5.1%
4.9%
Breakdown of population affiliated with a religious congregation
Type
Adherents
Congregations
Religion
Baltimore
Arlington
Baltimore
Arlington
CATHOLIC CHURCH
11.0%
14.6%
8.2%
6.2%
EPISCOPAL CHURCH
1.6%
2.0%
4.0%
8.0%
AMERICAN BAPTIST CHURCHES IN THE USA
1.4%
0.5%
2.2%
2.7%
SOUTHERN BAPTIST CONVENTION
1.4%
1.3%
7.3%
16.8%
EVANGELICAL LUTHERAN CHURCH IN AMERICA
1.0%
0.6%
4.3%
2.7%
MUSLIM ESTIMATE
0.6%
1.7%
1.5%
0.9%
SEVENTH DAY ADVENTIST CHURCH
0.5%
0.1%
1.5%
1.8%
LUTHERAN CHURCH
0.4%
0.3%
1.8%
0.9%
Weather
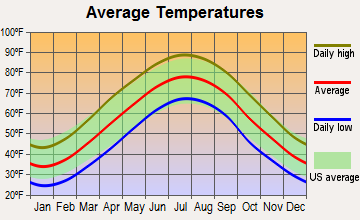
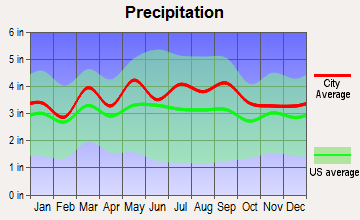
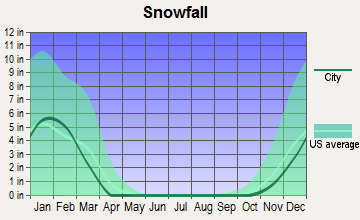
Both Baltimore and Arlington experience a humid subtropical climate. Residents and visitors enjoy four distinct seasons, including hot, humid summers, and moderate to somewhat chilly winters. Both cities get about the same amount of rainfall annually but Arlington tends to have slighter milder temperatures throughout the year due to its proximity to the coast.
Weather and climate
Type
Baltimore
Arlington
Temperature - Average
54.5°F
56.6°F
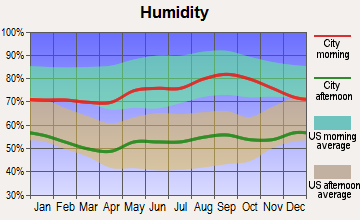
Humidity - Average morning or afternoon humidity
70.4%
68.8%
Humidity - Differences between morning and afternoon humidity
36%
33%
Humidity - Maximum monthly morning or afternoon humidity
84%
81%
Humidity - Minimum monthly morning or afternoon humidity
48%
48%
Precipitation - Yearly average
42.9 in
43.4 in
Snowfall - Yearly average
39.6 in
32.4 in
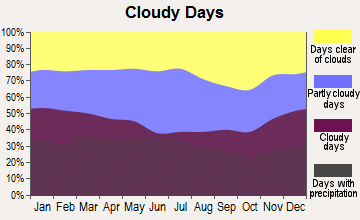
Clouds - Number of days clear of clouds
17.5%
15.9%
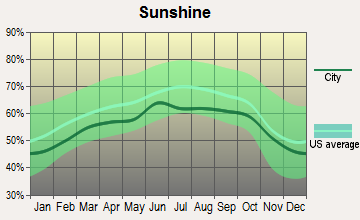
Sunshine amount - Average
60.3%
61.5%
Sunshine amount - Differences during a year
16%
21%
Sunshine amount - Maximum monthly
63%
66%
Sunshine amount - Minimum monthly
47%
45%
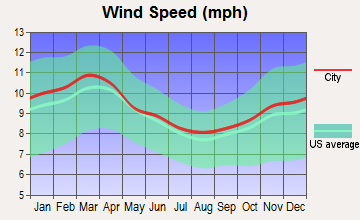
Wind speed - Average
7.9 mph
9.7 mph
Average climate in Baltimore, Maryland
Average climate in Arlington, Virginia
Air pollution
Type
AQI
CO
NO2
OZONE
PB
PM10
PM25
SO2
Year
Baltimore
Arlington
Baltimore
Arlington
Baltimore
Arlington
Baltimore
Arlington
Arlington
Baltimore
Arlington
Baltimore
Arlington
Baltimore
Arlington
2018
89
88
0.23
0.30
11.8
9.1
28.3
26.2
N/A
N/A
N/A
16.4
7.9
8.4
0.1
0.7
2017
89
84
0.25
0.25
12.1
9.5
27.7
27.7
N/A
N/A
N/A
16.5
8.2
9.0
0.2
0.7
2016
102
98
0.26
0.25
13.0
10.6
28.3
27.5
0.002
N/A
N/A
17.2
7.7
8.7
0.3
0.8
2015
89
91
0.28
0.34
12.4
10.9
28.3
26.7
0.002
N/A
N/A
17.0
9.5
9.5
0.4
1.1
2014
82
85
0.25
0.27
11.8
10.9
25.7
26.2
0.002
N/A
N/A
17.1
10.9
9.3
0.6
1.0
2013
86
90
0.22
0.33
10.7
10.9
25.6
26.6
0.002
N/A
N/A
17.3
9.6
10.1
0.5
0.8
2012
98
104
0.24
0.33
11.3
11.7
25.0
27.9
0.002
N/A
N/A
N/A
11.2
10.9
0.5
1.0
2011
101
105
0.24
0.18
12.5
12.3
25.1
28.4
0.002
N/A
N/A
N/A
12.1
11.0
0.8
1.5
2010
110
114
0.24
0.23
13.1
12.9
26.9
29.8
0.003
N/A
N/A
N/A
12.2
9.7
1.0
2.5
2009
84
90
0.23
0.24
12.2
12.7
23.5
24.7
0.002
N/A
N/A
N/A
10.4
8.1
1.4
2.7
2008
96
103
0.25
0.23
13.6
13.3
21.6
25.8
0.003
N/A
N/A
N/A
12.8
8.9
1.8
4.3
2007
107
113
0.21
0.28
13.8
15.6
23.2
27.7
0.004
N/A
N/A
N/A
14.0
10.4
2.5
4.5
2006
112
114
N/A
0.49
12.0
17.7
24.6
25.9
0.004
N/A
N/A
N/A
14.7
10.9
N/A
4.3
2005
111
105
N/A
0.30
14.3
21.0
26.3
23.6
0.006
N/A
23.0
N/A
17.1
11.7
N/A
5.7
2004
108
114
N/A
0.22
15.3
21.6
28.0
23.5
0.004
N/A
23.1
N/A
16.3
11.3
N/A
5.9
2003
110
108
N/A
0.36
17.8
26.0
22.4
21.7
N/A
N/A
N/A
N/A
13.9
12.2
N/A
6.1
2002
119
131
N/A
0.48
17.4
21.8
19.4
25.9
N/A
N/A
N/A
N/A
16.3
N/A
5.8
6.0
2001
104
111
N/A
0.43
18.2
22.1
23.9
24.1
0.017
N/A
N/A
N/A
N/A
N/A
6.0
7.2
2000
101
110
N/A
0.50
17.0
22.7
22.4
20.2
N/A
N/A
N/A
N/A
N/A
N/A
6.3
10.1
Natural disasters
Type
Baltimore
Arlington
Tornado activity compared to U.S. average
117.8%
110%
Earthquake activity compared to U.S. average
40.6%
43.5%
Natural disasters compared to U.S. average
0%
14%
Transportation
Baltimore has a variety of public transit options including buses, light rail, and the MARC train for commuting to other cities. However, traffic congestion can be a concern. Arlington is served by the Washington Metro, multiple bus services, and bike lanes, making it convenient for commuting around the D.C. area.
Transport
Type
Baltimore
Arlington
Amtrak stations
2
0
Amtrak stations nearby
2
3
FAA registered aircraft
136
103
FAA registered aircraft manufacturers and dealers
2
5
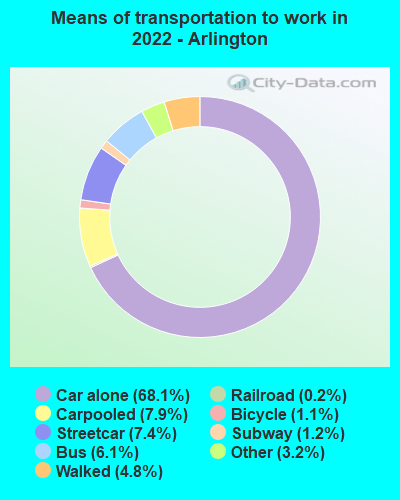
Means of transportation to work
Type
Baltimore
Arlington
Bicycle
0.4%
0.8%
Bus
6.2%
3.6%
Carpooled
7.3%
6.5%
Car alone
77.2%
71.3%
Motorcycle
0%
0.1%
Railroad
0.3%
0.4%
Streetcar
1.2%
7.8%
Subway
0.2%
1.1%
Taxicab
0.7%
0.4%
Walked
4.5%
6%
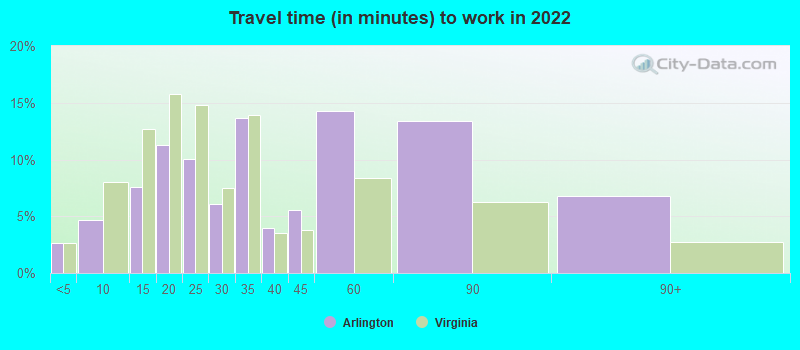
Average travel time to work
Type
Baltimore
Arlington
Average
32.3 min
34.8 min
Other means
26.3 min
25.7 min
Public transportation
46.8 min
36.7 min
Private vehicle occupancy
Type
Baltimore
Arlington
Average
1.1
1.1
Drove alone
90.7%
92.8%
In 2 person carpool
7.5%
6.3%
In 3 person carpool
1%
0.8%
In 4 person carpool
0.4%
0.1%
In 5-6 person carpool
0.3%
0%
In 7+ person carpool
0.2%
0%
How many people usually rode to work in the car, truck or van.
Real Estate
The real estate market in Baltimore offers diverse options, from historic homes to modern apartments, with relatively lower prices than Arlington. By comparison, Arlington's real estate market is competitive, characterized by high-rise condos and single-family homes with higher pricing influenced by its proximity to Washington D.C.
Neighborhoods
Baltimore is known for its historic districts including Fells Point and Mount Vernon, as well as trendy areas like Canton and Hampden. Arlington offers a mix of residential and commercial neighborhoods such as Rosslyn and Crystal City, recognized for their walkability and convenience.
Houses and residents
Type
Baltimore
Arlington
Houses
293,487
119,446
Average household size (people)
2.4
2.1
Median year apartment built
1959
1983
Median year house/condo built
1944
1959
Length of stay in the house since moving in
15.7 years
12.7 years
Houses occupied
254,370 (86.7%)
108,396 (90.7%)
Houses occupied by owners
123,249 (48.5%)
47,577 (43.9%)
Houses occupied by renters
131,121 (51.5%)
60,819 (56.1%)
Median rent asked for vacant for-rent units
$1,254
$3,620
Median monthly housing costs
$1,196
$2,164
Median price asked for vacant for-sale houses and condos
$207,303
$891,291
Estimated median house or condo value
$193,100
$779,400
Median numbers of rooms
5.6
4.1
Median number of rooms in apartments
4.2
3.3
Median number of rooms in houses and condos
6.5
6.7
Median house price - detached houses
$321,473
Over $1,000,000
Median house price - in 2-unit structures
$218,934
$648,538
Median house price - in 3-to-4-unit structures
$142,945
$442,578
Median house price - in 5 or more unit structures
$257,173
$566,559
Median house price - Townhouses or other attached units
$210,096
$703,291
Median house price - All housing units
$246,241
$877,770
Median house age
72
47
Renting percentage
52.3%
56.7%
Housing density (houses/condos per square mile)
3,632.1
4,617.2
House value disparities
38.5%
24.9%
Household income disparities
49.4%
37.5%
Median household income for houses/condes with a mortgage
$85,990
$201,635
Median household income for apartments without a mortgage
$53,334
$133,857
Housing units without a mortgage
2,415 (2.8%)
596 (1.6%)
Housing units with both a second mortgage and home equity loan
5,740 (6.6%)
3,235 (8.9%)
Housing units with a mortgage
84,578 (97.2%)
35,674 (98.4%)
Housing units with a home equity loan
579 (0.7%)
101 (0.3%)
Housing units with a second mortgage
8,544 (9.8%)
4,221 (11.6%)
House/condo owner moved in on average (years ago)
14
10
House/condo renter moved in on average (years ago)
3
1
Housing units lacking complete kitchen facilities
6%
0.7%
Housing units lacking complete plumbing facilities
5.1%
0.2%
Housing units in structures
Housing units in structures
Baltimore
Arlington
One, detached
16.4%
25.1%
One, attached
49.5%
9.6%
Two
4.5%
0.8%
3 or 4
4.9%
3.5%
5 to 9
5.5%
5.2%
10 to 19
4.8%
5.0%
20 to 49
2.8%
4.6%
50 or more
11.4%
46.1%
Mobile homes
0.2%
0.2%
Boats, RVs, vans, etc.
0.1%
0.0%
Median real estate property taxes paid for housing units
Self-employed workers in own not incorporated business
12,671
6,119
State government workers
20,410
1,820
Unpaid family workers
356
32
Industries and Occupations
In Baltimore, the top industries include healthcare, education, and technical services, employing a large portion of the city's workforce. Arlington's economy is heavily influenced by the federal government with a large portion of residents working in public administration. Other key industries include professional, scientific, technical services, and education.
Baltimore is a major healthcare hub, home to world-renowned hospitals like Johns Hopkins Hospital and University of Maryland Medical Center. Arlington's healthcare system is also top-notch with Virginia Hospital Center being a top-rated facility, and close proximity to nationally recognized hospitals in the D.C. area.
Baltimore offers a blend of historic and modern infrastructure. It faces challenges related to aging infrastructure, but ongoing development projects aim to revitalize the city. Arlington, known for its well-planned urban villages, has a modern infrastructure with ongoing projects to improve public spaces, transportation, and sustainability.
Infrastructure
Type
Baltimore
Arlington
Hospitals
45
6
TV stations
19
25
Bank branches located here
215
82
Bank institutions located here
44
25
Main business address for public companies
27
17
Drinking water stations with no reported violations in the past
13
0
Drinking water stations with reported violations in the past
HMDA - Conventional home purchase loans - Applications denied
Year
Baltimore
Arlington
1999
2,486
226
2000
2,058
196
2001
1,371
164
2002
1,111
146
2003
1,526
288
2004
2,929
461
2005
4,981
589
2006
5,533
563
2007
3,592
412
2008
1,111
272
2009
381
173
Culture and Food
Baltimore's unique culture is deeply rooted in its history and reflected in its distinct culinary scene, arts, and music festivals. It is known for its crab cakes and seafood dishes. Arlington offers a blend of culture and food, with a range of restaurants serving cuisine from around the world, well-known for its vibrant nightlife and culinary diversity.
Sports Teams
Baltimore is home to major sports teams, including the Baltimore Orioles (MLB) and Baltimore Ravens (NFL). While Arlington does not host any major league sports teams, the proximity to Washington D.C. allows residents easy access to teams like the Washington Nationals (MLB), Washington Wizards (NBA), and Washington Capitals (NHL).


 Baltimore, MD
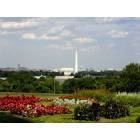
 Arlington, VA