Austin, Texas, the state's capital and the Live Music Capital of the World, is a vibrant metropolitan city known for its strong economy, cultural diversity, and warm weather. In contrast, Perris Valley, California is a more laid-back suburban environment known for outdoor activities and mild climate. This comparison of the two cities examines their differences and similarities across various factors, such as safety, cost of living, and quality of life, offering insights to prospective residents and tourists.
Austin, TX, generally enjoys a safer reputation compared to other major U.S. cities. However, as is typical with large cities, crime rates can vary significantly by neighborhood. Perris Valley, CA, on the other hand, has a somewhat higher crime rate compared to the national average, though efforts are continuously made to improve safety. Tourists and potential residents should research specific neighborhoods for more accurate crime data.
Cost of Living
The cost of living in Austin is lower compared to Perris Valley. While housing costs are rising in Austin, they are still more affordable than in Perris Valley and much of California. Restaurant prices, groceries, and other living expenses are comparatively cheaper in Austin as well.
Income Tax
Texas does not impose any state income tax, offering a distinct financial advantage to Austin residents. Conversely, California does levy a state income tax, which ranges from 1% to 13.3% based on income.
Property Tax
The property tax rate in Texas is high, with Austin having an average rate of 1.83%. In contrast, California has a lower property tax rate, with Perris Valley having an average rate of 1.16%.
Sales Tax
Texas has no state income tax, and Austin has a sales tax rate of 8.25%. California has one of the highest state sales taxes in the U.S. at 7.25%, and Perris Valley has an additional local sales tax, bringing the total to 7.75%.
Income
Type
Austin
Perris Valley
Estimated median household income
$79,542
$71,187
Estimated per capita income
$53,937
$27,699
Cost of living index (U.S. average is 100)
96.4
85.6
If you make $50,000 in Perris Valley, you will have to make $56,308 in Austin to maintain the same standard of living.
Geographical Conditions
Both cities are surrounded by beautiful landscapes. Austin is in Central Texas Hill Country, with numerous lakes and parks. Perris Valley is nestled in Southern California, surrounded by hills, and is close to the Pacific Ocean.
Geographical information
Type
Austin
Perris Valley
Land area
251.5 sq. miles
276.5 sq. miles
Population density
3,833.4 people per sq. mile
689.3 people per sq. mile
Relative area comparison
Austin, TX Perris Valley, CA
Education
Both cities are served by quality school districts. Austin is known for its well-rated schools and is home to the University of Texas, a top-ranking public university. Perris Valley, although smaller, maintains satisfactory education standards, with several good schools and community colleges.
Austin's robust economy is fueled by industries such as technology, pharmaceuticals, and entertainment. Perris Valley's economy, however, is smaller and centers around sectors like logistics, retail, and manufacturing. Job growth is spearheading in both cities, with Austin seeing a faster rate.
Biggest Employers
In Austin, major employers include Dell, the University of Texas, and the State of Texas. Perris Valley's largest employers include Ross Stores distribution center and the Perris Union High School District.
In Austin (Travis County), 60.2% voted for Democrats and 36.2% for Republicans in 2012 Presidential Election. In Perris Valley (Riverside County), 49.6% voted for Democrats and 48.0% for Republicans.
Elections
Type
Democrats
Republicans
Other
Year
Austin
Perris Valley
Austin
Perris Valley
Austin
Perris Valley
2020
71.7%
53.0%
26.5%
45.0%
1.8%
2.0%
2016
65.8%
49.7%
27.2%
44.4%
7.0%
5.9%
2012
60.2%
49.6%
36.2%
48.0%
3.6%
2.4%
2008
63.8%
50.4%
34.4%
48.1%
1.8%
1.5%
2004
56.1%
41.3%
42.1%
58.2%
1.8%
0.6%
2000
41.7%
45.0%
47.0%
51.6%
11.3%
3.4%
1996
52.4%
43.0%
40.0%
45.6%
7.7%
11.3%
Breakdown of population affiliated with a religious congregation
Type
Adherents
Congregations
Religion
Austin
Perris Valley
Austin
Perris Valley
CATHOLIC CHURCH
17.3%
27.5%
4.5%
4.5%
SOUTHERN BAPTIST CONVENTION
8.0%
1.2%
22.8%
11.2%
EPISCOPAL CHURCH
1.4%
0.2%
2.8%
1.4%
MUSLIM ESTIMATE
1.2%
0.5%
0.7%
0.7%
EVANGELICAL LUTHERAN CHURCH IN AMERICA
1.0%
0.3%
2.5%
1.5%
LUTHERAN CHURCH
0.9%
0.3%
2.1%
1.8%
SEVENTH DAY ADVENTIST CHURCH
0.2%
0.9%
1.0%
3.4%
Weather
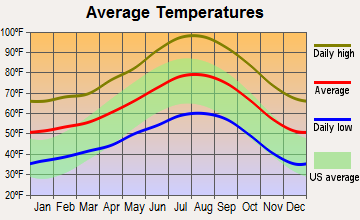
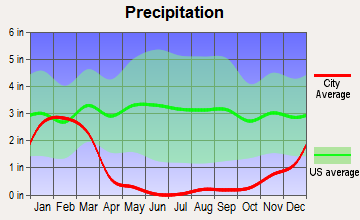
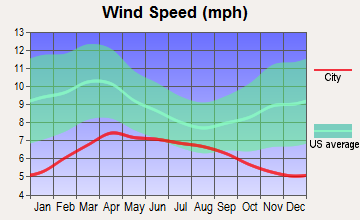
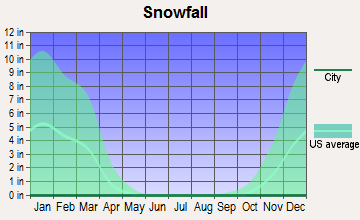
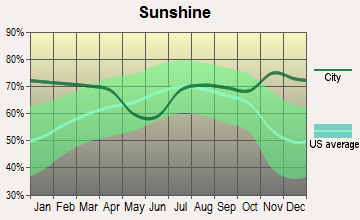
Those who love warm weather will appreciate both cities. Austin has a humid subtropical climate with long, hot summers and short, mild winters. It also experiences frequent thunderstorms. Perris Valley provides a more Mediterranean climate with warm summers and mild winters. Although it gets less rainfall, it has stronger seasonal winds.
Weather and climate
Type
Austin
Perris Valley
Temperature - Average
68.5°F
64.1°F
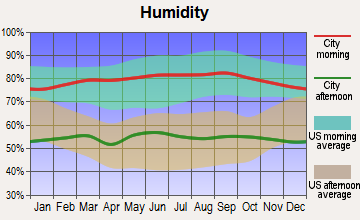
Humidity - Average morning or afternoon humidity
75.2%
68%
Humidity - Differences between morning and afternoon humidity
40%
22.4%
Humidity - Maximum monthly morning or afternoon humidity
89%
75.1%
Humidity - Minimum monthly morning or afternoon humidity
49%
52.7%
Precipitation - Yearly average
33.7 in
11.5 in
Snowfall - Yearly average
1.4 in
0 in
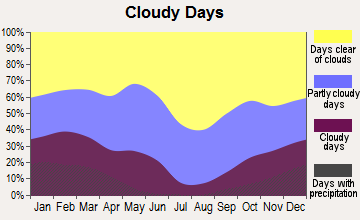
Clouds - Number of days clear of clouds
19.3%
27.1%
Sunshine amount - Average
63.3%
77.6%
Sunshine amount - Differences during a year
22%
20.5%
Sunshine amount - Maximum monthly
72%
82%
Sunshine amount - Minimum monthly
50%
61.5%
Wind speed - Average
7.2 mph
5 mph
Average climate in Austin, Texas
Average climate in Perris Valley, California
Air pollution
Type
AQI
CO
NO2
OZONE
PB
PM10
PM25
SO2
Year
Austin
Perris Valley
Austin
Perris Valley
Austin
Perris Valley
Austin
Perris Valley
Perris Valley
Perris Valley
Austin
Perris Valley
Austin
Perris Valley
2018
76
154
N/A
0.28
4.9
9.3
26.7
33.0
0.006
N/A
27.9
N/A
8.7
8.9
0.2
0.5
2017
76
146
N/A
0.28
4.6
8.7
29.7
33.0
0.004
N/A
28.9
N/A
8.3
11.4
0.3
0.3
2016
71
143
N/A
0.25
4.2
8.9
29.5
31.6
0.006
N/A
27.6
N/A
8.2
11.0
0.2
0.2
2015
78
145
N/A
0.22
4.4
9.0
28.9
31.6
0.004
N/A
25.5
N/A
8.6
11.6
0.3
0.3
2014
74
148
N/A
0.24
5.2
10.5
28.3
32.6
0.006
N/A
31.9
N/A
8.7
13.6
0.5
0.3
2013
78
150
0.09
0.24
5.5
10.8
29.5
32.4
0.006
N/A
30.8
N/A
8.6
11.7
0.5
0.2
2012
86
145
0.13
0.23
5.5
11.3
30.1
31.4
0.007
N/A
28.3
N/A
8.6
12.1
N/A
0.2
2011
83
149
0.11
0.26
2.6
11.7
33.0
31.0
0.006
N/A
30.1
N/A
9.1
13.2
N/A
0.3
2010
77
146
0.05
0.29
3.2
12.3
29.4
31.4
0.008
N/A
27.8
N/A
8.8
13.3
N/A
1.3
2009
76
151
0.05
0.26
2.6
14.3
29.7
31.3
0.010
N/A
30.8
N/A
9.0
13.8
N/A
1.6
2008
81
155
0.12
0.34
3.2
14.9
30.7
32.3
0.011
N/A
40.0
N/A
9.7
12.0
N/A
0.9
2007
82
125
0.12
0.41
3.1
15.6
27.1
31.8
0.013
N/A
N/A
N/A
9.8
N/A
N/A
1.5
2006
89
126
0.14
0.37
3.8
16.2
31.3
30.9
0.007
N/A
N/A
N/A
10.0
N/A
0.2
1.3
2005
92
129
0.15
0.35
4.4
15.7
29.0
25.4
0.012
N/A
N/A
N/A
10.7
N/A
0.2
3.4
2004
74
137
0.16
0.42
3.3
15.5
26.8
30.2
0.013
N/A
N/A
N/A
N/A
N/A
N/A
3.4
2003
85
140
0.26
0.57
4.2
18.3
28.9
31.9
0.020
N/A
N/A
N/A
N/A
N/A
0.1
2.2
2002
83
138
0.33
0.57
3.9
18.3
27.2
33.2
0.015
N/A
N/A
N/A
N/A
N/A
N/A
0.1
2001
83
145
0.31
0.79
4.2
19.2
25.5
32.5
0.052
N/A
N/A
N/A
N/A
N/A
N/A
0.8
2000
86
157
0.28
0.83
4.7
18.4
27.8
28.8
0.033
N/A
N/A
N/A
N/A
N/A
N/A
1.1
Natural disasters
Type
Austin
Perris Valley
Tornado activity compared to U.S. average
137.9%
16.2%
Earthquake activity compared to U.S. average
80.4%
7,175.7%
Natural disasters compared to U.S. average
29%
46%
Transportation
Austin has multiple transportation options, including buses, light rail, bike sharing, and ride-sharing services. Traffic can be heavy due to the city's growth. Perris Valley, while not as congested, relies heavily on car transportation, with limited public transit options.
Transport
Type
Austin
Perris Valley
Amtrak stations
1
0
Amtrak stations nearby
1
3
FAA registered aircraft
911
0
FAA registered aircraft manufacturers and dealers
21
0
Means of transportation to work
Type
Austin
Perris Valley
Bicycle
0.8%
0.3%
Bus
1.5%
1%
Carpooled
7.9%
18%
Car alone
85.9%
73.6%
Motorcycle
0.3%
0.1%
Railroad
0%
0.2%
Taxicab
0.1%
0.1%
Walked
2%
1.4%
Average travel time to work
Type
Austin
Perris Valley
Average
29.9 min
37 min
Real Estate
Austin’s real estate market is competitive due to the city's rapid growth, with the median home price higher than the national average. In Perris Valley, home prices are more expensive due to the generally high California real estate market, but the growth is moderate.
Neighborhoods
In Austin, neighborhoods range from the historic and scenic areas like Hyde Park to cosmopolitan areas like Downtown Austin. Perris Valley offers suburban neighborhoods and is surrounded by stunning geographical features.
Houses and residents
Type
Austin
Perris Valley
Houses
469,156
51,323
Average household size (people)
2.4
3.4
Houses occupied
449,399 (95.8%)
46,991 (91.6%)
Houses occupied by owners
196,458 (43.7%)
36,693 (78.1%)
Houses occupied by renters
252,941 (56.3%)
10,298 (21.9%)
Median rent asked for vacant for-rent units
$1,286
$1,322
Median price asked for vacant for-sale houses and condos
$549,769
$464,486
Estimated median house or condo value
$482,900
$376,802
Median number of rooms in apartments
3.4
5.7
Median number of rooms in houses and condos
6
6.2
Renting percentage
54.9%
27.2%
Housing density (houses/condos per square mile)
1,865.3
185.6
Household income disparities
44.8%
42.4%
Housing units without a mortgage
1,799 (1.3%)
6,227 (22.3%)
Housing units with both a second mortgage and home equity loan
6,421 (4.8%)
116 (0.4%)
Housing units with a mortgage
132,628 (98.7%)
21,647 (77.7%)
Housing units with a home equity loan
206 (0.2%)
962 (3.5%)
Housing units with a second mortgage
8,515 (6.3%)
3,573 (12.8%)
Housing units lacking complete kitchen facilities
0.9%
1.1%
Housing units lacking complete plumbing facilities
Self-employed workers in own not incorporated business
38,777
4,282
State government workers
46,229
1,900
Unpaid family workers
102
195
Industries and Occupations
In Austin, the top industries include technology (nicknamed "Silicon Hills"), music, film, and pharmaceuticals. In Perris Valley, logistics and manufacturing dominate due to its location near major transportation routes.
Austin carries a higher ranking in healthcare due to an abundance of quality hospitals and specialists. Perris Valley provides solid health services but has fewer hospitals and clinics than Austin.
Health (county statistics)
Type
Austin
Perris Valley
General health status score of residents in this county from 1 (poor) to 5 (excellent)
Austin boasts better infrastructure, thanks to the availability of amenities that come with being a larger city. Perris Valley, while not as well-endowed, provides a decent level of public services and facilities.
Infrastructure
Type
Austin
Perris Valley
TV stations
20
4
Culture and Food
Austin's cultural scene is renowned, boasting live music, festivals, and diverse cuisine. Barbecue and Tex-Mex are local favorites. Perris Valley offers a blend of Californian and Mexican cuisines. The city also hosts several cultural and community events throughout the year.
Sports Teams
Austin has one major professional sports team, Austin FC in the MLS, but the city is a hotbed for college sports, especially the Texas Longhorns. Perris Valley doesn't have any professional sports teams, but Los Angeles teams attract many area fans.
 Austin, TX
 Perris Valley, CA