Given the unique attributes of their locales, Austin, TX and Montgomery, AL present distinct living experiences. Austin is widely known for its vibrant tech industry, music scenes, and progressive culture, while Montgomery is steeped in rich history and southern charm. These distinctions define the two cities in terms of safety, economy, education, and infrastructure among others. To provide a comprehensive comparison, various aspects of both cities will be considered.
Distance between
Austin, TX and
Montgomery, AL : 691.2 miles
Austin's population is larger by 385%. Its population has grown by 307,615 people (46.9%) since 2000. The population of Montgomery has decreased by 2,903 people (1.4%) during that time.
While Austin offers a relatively low property crime rate, its violent crime rates are close to the national average. The city's safer neighborhoods such as Windsor Road and West Lake Hills are coveted for this reason. Montgomery, on the contrary, has higher violent and property crime rates compared to the national average. Its safer neighborhoods comprise Forest Park and Bell Road.
City-data.com crime index counts serious crimes and violent crime more heavily. It adjusts for the number of visitors and daily workers commuting into cities. (higher means more crime, U.S. average = 301.1)
City-data.com crime index counts serious crimes and violent crime more heavily. It adjusts for the number of visitors and daily workers commuting into cities. (higher means more crime, U.S. average = 301.1)
Sex Offenders
According to our data, there are 1,398 registered sex offenders living in Austin and 481 registered sex offenders living in . The ratio of residents to sex offenders in Austin is 678 to 1; the ratio in Montgomery is 421 to 1. The number of registered sex offenders compared to the number of residents is a smaller in Austin than in Montgomery.
Cost of Living
The cost of living in Austin is significantly higher than Montgomery. Key factors for this include housing, utilities, and transportation costs. While Montgomery is more affordable, with lower housing prices and overall living costs, Austin's higher costs reflect its economic prosperity and attraction for young professionals.
Income Tax
Austin benefits from having no state income tax in Texas. In contrast, Alabama imposes a state income tax, which affects residents in Montgomery.
Property Tax
Austin's property taxes are higher due to the robust property market and high property values. Montgomery, with its lower property values, has lower property taxes.
Sales Tax
Texas doesn't impose state sales tax on necessities like groceries and medicine, while Alabama does. This makes Austin a more favorable city for those concerned about sales tax.
Income
Type
Austin
Montgomery
Estimated median household income
$79,542
$46,957
Estimated per capita income
$53,937
$27,253
Cost of living index (U.S. average is 100)
96.4
84.6
If you make $50,000 in Montgomery, you will have to make $56,974 in Austin to maintain the same standard of living.
Geographical Conditions
Austin is located in Central Texas and is surrounded by lakes and rolling hills. Montgomery is based on the Coastal Plain and is characterized by its gentle topography and proximity to the Alabama River.
Austin boasts of excellent public and private schools and houses the well-known University of Texas. In contrast, Montgomery has struggled with their public school system but it's home to renowned universities like Alabama State University and Faulkner University.
Austin's economy is thriving, with booming sectors like technology, healthcare, and education. Montgomery, on the contrary, has a slower economy with sectors like government, manufacturing, and retail making significant contributions.
Biggest Employers
Austin's biggest employers feature tech companies like Dell, IBM and Apple. In Montgomery, the State of Alabama, Maxwell-Gunter Air Force Base, and Hyundai Motor Manufacturing are the largest employers.
There were 4,180 building permits issued in Austin in 2012 (2467 more than in 2011) compared to 261 building permits issued in Montgomery in 2012 (87 more than in 2011).
In Austin (Travis County), 60.2% voted for Democrats and 36.2% for Republicans in 2012 Presidential Election. In Montgomery (Montgomery County), 62.0% voted for Democrats and 37.7% for Republicans.
Elections
Type
Democrats
Republicans
Other
Year
Austin
Montgomery
Austin
Montgomery
Austin
Montgomery
2020
71.7%
65.1%
26.5%
33.6%
1.8%
1.3%
2016
65.8%
61.4%
27.2%
35.5%
7.0%
3.1%
2012
60.2%
62.0%
36.2%
37.7%
3.6%
0.3%
2008
63.8%
59.7%
34.4%
40.3%
1.8%
0.0%
2004
56.1%
50.6%
42.1%
49.4%
1.8%
0.0%
2000
41.7%
50.4%
47.0%
48.4%
11.3%
1.2%
1996
52.4%
48.7%
40.0%
48.0%
7.7%
3.3%
Breakdown of population affiliated with a religious congregation
Type
Adherents
Congregations
Religion
Austin
Montgomery
Austin
Montgomery
CATHOLIC CHURCH
17.3%
4.1%
4.5%
2.5%
SOUTHERN BAPTIST CONVENTION
8.0%
18.8%
22.8%
15.3%
EPISCOPAL CHURCH
1.4%
1.2%
2.8%
1.7%
MUSLIM ESTIMATE
1.2%
0.4%
0.7%
0.8%
EVANGELICAL LUTHERAN CHURCH IN AMERICA
1.0%
0.1%
2.5%
0.3%
LUTHERAN CHURCH
0.9%
0.2%
2.1%
0.6%
PRESBYTERIAN CHURCH IN AMERICA
0.2%
1.2%
0.6%
2.0%
SEVENTH DAY ADVENTIST CHURCH
0.2%
0.9%
1.0%
1.4%
AMERICAN BAPTIST CHURCHES IN THE USA
0.1%
2.2%
0.1%
0.6%
Weather
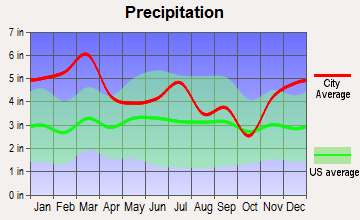
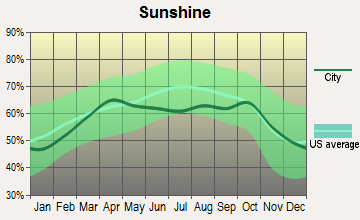
Austin enjoys a temperate climate with over 2,600 hours of sunshine annually. It has long, hot summers and short, mild winters. Montgomery, in contrast, sees more rainfall annually, and temperatures tend to be more moderate but the summers are almost just as hot.
Weather and climate
Type
Austin
Montgomery
Temperature - Average
68.5°F
64.8°F
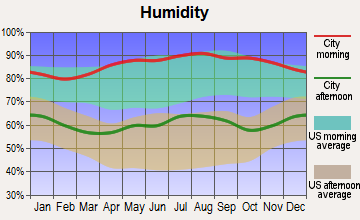
Humidity - Average morning or afternoon humidity
75.2%
76.7%
Humidity - Differences between morning and afternoon humidity
40%
40%
Humidity - Maximum monthly morning or afternoon humidity
89%
91%
Humidity - Minimum monthly morning or afternoon humidity
49%
51%
Precipitation - Yearly average
33.7 in
52.5 in
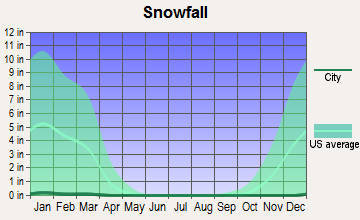
Snowfall - Yearly average
1.4 in
0.8 in
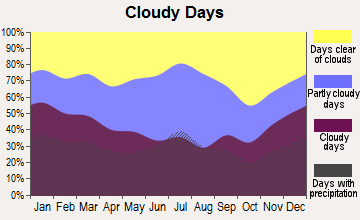
Clouds - Number of days clear of clouds
19.3%
17.9%
Sunshine amount - Average
63.3%
63.1%
Sunshine amount - Differences during a year
22%
17%
Sunshine amount - Maximum monthly
72%
64%
Sunshine amount - Minimum monthly
50%
47%
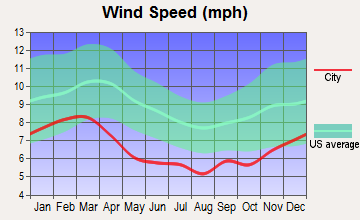
Wind speed - Average
7.2 mph
6.4 mph
Average climate in Austin, Texas
Average climate in Montgomery, Alabama
Air pollution
Type
AQI
CO
NO2
OZONE
PM25
SO2
Year
Austin
Montgomery
Austin
Austin
Austin
Montgomery
Austin
Montgomery
Austin
2018
76
75
N/A
N/A
4.9
N/A
26.7
26.3
8.7
13.8
0.2
N/A
2017
76
89
N/A
N/A
4.6
N/A
29.7
27.8
8.3
11.7
0.3
N/A
2016
71
75
N/A
N/A
4.2
N/A
29.5
29.6
8.2
8.8
0.2
N/A
2015
78
76
N/A
N/A
4.4
N/A
28.9
26.8
8.6
10.6
0.3
N/A
2014
74
55
N/A
N/A
5.2
N/A
28.3
28.2
8.7
N/A
0.5
N/A
2013
78
53
0.09
N/A
5.5
N/A
29.5
27.2
8.6
N/A
0.5
N/A
2012
86
63
0.13
N/A
5.5
N/A
30.1
29.7
8.6
N/A
N/A
N/A
2011
83
67
0.11
N/A
2.6
N/A
33.0
31.2
9.1
N/A
N/A
N/A
2010
77
84
0.05
N/A
3.2
N/A
29.4
31.2
8.8
12.5
N/A
N/A
2009
76
68
0.05
N/A
2.6
N/A
29.7
27.1
9.0
10.5
N/A
N/A
2008
81
79
0.12
N/A
3.2
N/A
30.7
30.4
9.7
N/A
N/A
N/A
2007
82
90
0.12
N/A
3.1
N/A
27.1
34.0
9.8
N/A
N/A
N/A
2006
89
73
0.14
N/A
3.8
N/A
31.3
31.4
10.0
N/A
0.2
N/A
2005
92
71
0.15
N/A
4.4
N/A
29.0
28.0
10.7
N/A
0.2
N/A
2004
74
62
0.16
N/A
3.3
N/A
26.8
26.0
N/A
N/A
N/A
N/A
2003
85
67
0.26
N/A
4.2
N/A
28.9
25.4
N/A
N/A
0.1
N/A
2002
83
78
0.33
N/A
3.9
N/A
27.2
28.6
N/A
N/A
N/A
N/A
2001
83
94
0.31
N/A
4.2
N/A
25.5
28.3
N/A
N/A
N/A
N/A
2000
86
108
0.28
N/A
4.7
N/A
27.8
35.9
N/A
N/A
N/A
N/A
Natural disasters
Type
Austin
Montgomery
Tornado activity compared to U.S. average
137.9%
144.5%
Earthquake activity compared to U.S. average
80.4%
166.1%
Natural disasters compared to U.S. average
29%
15%
Transportation
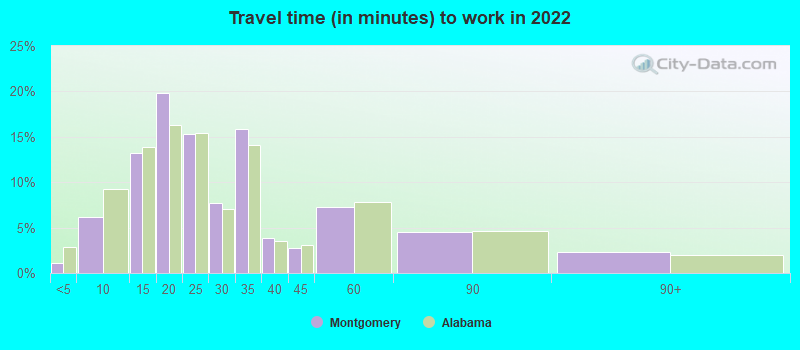
Both cities provide public transportation services, but Austin's system is more extensive. For commuters, traffic can be a challenge in Austin while Montgomery is known for shorter commuting times and less traffic.
Transport
Type
Austin
Montgomery
Amtrak stations
1
1
Amtrak stations nearby
1
1
FAA registered aircraft
911
168
FAA registered aircraft manufacturers and dealers
21
9
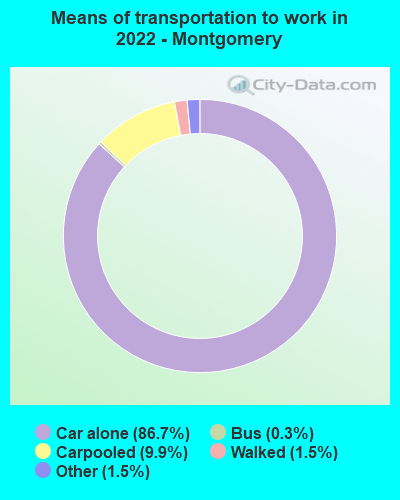
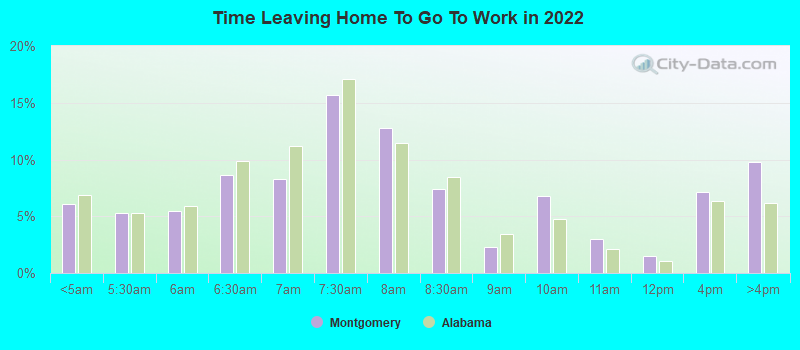
Means of transportation to work
Type
Austin
Montgomery
Bicycle
0.8%
0.1%
Bus
1.5%
0.3%
Carpooled
7.9%
8.1%
Car alone
85.9%
89.9%
Motorcycle
0.3%
0.1%
Taxicab
0.1%
0.2%
Walked
2%
1.1%
Average travel time to work
Type
Austin
Montgomery
Average
29.9 min
26.5 min
Other means
22.7 min
19.9 min
Public transportation
37.9 min
31.7 min
Private vehicle occupancy
Type
Austin
Montgomery
Average
1.1
1.1
Drove alone
91.2%
90.3%
In 2 person carpool
6.3%
7.7%
In 3 person carpool
1.7%
1.1%
In 4 person carpool
0.6%
0.4%
In 5-6 person carpool
0.1%
0.1%
In 7+ person carpool
0.2%
0.3%
How many people usually rode to work in the car, truck or van.
Real Estate
Austin's real-estate market is currently booming, with high property values and rents. Montgomery's property values are comparatively lower, leading to more affordable housing options.
Neighborhoods
From hip and vibrant neighborhoods like Downtown and South Congress in Austin to quiet and historic Cloverdale in Montgomery, both cities offer a variety of neighborhoods to fit different lifestyles.
Houses and residents
Type
Austin
Montgomery
Houses
469,156
93,055
Average household size (people)
2.4
2.4
Median year apartment built
1997
1981
Median year house/condo built
1988
1979
Length of stay in the house since moving in
12.1 years
14.9 years
Houses occupied
449,399 (95.8%)
81,529 (87.6%)
Houses occupied by owners
196,458 (43.7%)
45,969 (56.4%)
Houses occupied by renters
252,941 (56.3%)
35,560 (43.6%)
Median rent asked for vacant for-rent units
$1,286
$1,021
Median monthly housing costs
$1,521
$926
Median price asked for vacant for-sale houses and condos
$549,769
$177,602
Estimated median house or condo value
$482,900
$136,800
Median numbers of rooms
4.4
5.7
Median number of rooms in apartments
3.4
4.4
Median number of rooms in houses and condos
6
6.7
Median house price - detached houses
$595,996
$182,881
Median house price - in 2-unit structures
$393,984
$83,037
Median house price - in 3-to-4-unit structures
$262,826
$87,195
Median house price - in 5 or more unit structures
$576,111
$55,784
Median house price - mobile homes
$56,102
$154,829
Median house price - Townhouses or other attached units
$459,657
$110,664
Median house price - All housing units
$571,154
$179,453
Median house age
28
43
Renting percentage
54.9%
41.1%
Housing density (houses/condos per square mile)
1,865.3
598.9
House value disparities
28.4%
41.3%
Household income disparities
44.8%
46.9%
Median household income for houses/condes with a mortgage
$141,177
$69,253
Median household income for apartments without a mortgage
$86,430
$43,782
Housing units without a mortgage
1,799 (1.3%)
462 (1.6%)
Housing units with both a second mortgage and home equity loan
6,421 (4.8%)
1,755 (6.1%)
Housing units with a mortgage
132,628 (98.7%)
28,109 (98.4%)
Housing units with a home equity loan
206 (0.2%)
309 (1.1%)
Housing units with a second mortgage
8,515 (6.3%)
2,440 (8.5%)
House/condo owner moved in on average (years ago)
9
14
House/condo renter moved in on average (years ago)
1
1
Housing units lacking complete kitchen facilities
0.9%
4%
Housing units lacking complete plumbing facilities
0.6%
3.7%
Housing units in structures
Housing units in structures
Austin
Montgomery
One, detached
43.1%
70.2%
One, attached
5.2%
3.4%
Two
2.4%
0.9%
3 or 4
4.1%
4.3%
5 to 9
7.2%
8.7%
10 to 19
11.0%
7.0%
20 to 49
8.9%
1.1%
50 or more
17.2%
2.0%
Mobile homes
1.0%
2.4%
Median real estate property taxes paid for housing units
Self-employed workers in own not incorporated business
38,777
4,332
State government workers
46,229
6,387
Unpaid family workers
102
0
Industries and Occupations
Austin's leading industries include tech, entertainment, and healthcare. In Montgomery, government, healthcare, and manufacturing dominate the job market.
Austin has access to high-quality healthcare with renowned hospitals like the Ascension Seton and St. David's. Montgomery stands tall with quality healthcare facilities like the Jackson Hospital and Baptist Medical Center South.
Health (county statistics)
Type
Austin
Montgomery
General health status score of residents in this county from 1 (poor) to 5 (excellent)
Austin is well-designed with good road networks and is nationally recognized for its innovative urban planning. Montgomery has a less developed infrastructure, but has witnessed improvements recently with initiatives to refurbish historical structures and develop new urban spaces.
Infrastructure
Type
Austin
Montgomery
Hospitals
65
14
TV stations
20
11
Arenas or stadiums
2
2
Bank branches located here
264
69
Bank institutions located here
43
18
Main business address for public companies
44
3
Drinking water stations with no reported violations in the past
46
3
Drinking water stations with reported violations in the past
HMDA - Conventional home purchase loans - Applications denied
Year
Austin
Montgomery
1999
4,733
1,463
2000
2,950
832
2001
2,038
509
2002
1,772
393
2003
2,213
393
2004
2,458
529
2005
3,121
779
2006
3,367
694
2007
2,560
538
2008
1,747
243
2009
1,067
100
Culture and Food
Austin is known for being the “Live Music Capital of the World,” and offers an eclectic food scene featuring famous Texas barbecue. Montgomery holds a vital place in America’s civil rights history and indulges in traditional southern cuisine.
Sports Teams
Austin is home to the University of Texas Longhorns and the recent addition of an MLS soccer team, Austin FC. Montgomery hosts the Biscuits, a minor league baseball team, and supports college sports teams from Alabama State and Auburn University.


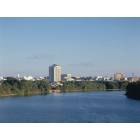
 Austin, TX
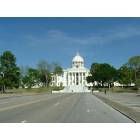
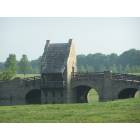
 Montgomery, AL