Austin, TX and Fremont, CA are both dynamic cities with robust economies and diverse populations. While Austin is known for its vibrant tech scene, live music, and lower cost of living, Fremont shines for its proximity to Silicon Valley, educational standards and relative safety. Both cities offer unique lifestyle and opportunities, and the choice between the two would largely depend on personal preferences.
Distance between
Austin, TX and
Fremont, CA : 1,471.7 miles
Austin's population is larger by 324%. Its population has grown by 307,615 people (46.9%) since 2000. The population of Fremont has grown by 24,101 people (11.8%) during that time.
Both Austin and Fremont are relatively safe cities, however, data from the FBI's 2020 report shows that Fremont tends to have a lower crime rate compared to Austin. Austin has been making notable strides toward enhancing safety and crime prevention but Fremont's overall safety rating remains higher. Both cities have effective police departments that diligently work towards maintaining public safety.
City-data.com crime index counts serious crimes and violent crime more heavily. It adjusts for the number of visitors and daily workers commuting into cities. (higher means more crime, U.S. average = 301.1)
City-data.com crime index counts serious crimes and violent crime more heavily. It adjusts for the number of visitors and daily workers commuting into cities. (higher means more crime, U.S. average = 301.1)
Sex Offenders
According to our data, there are 1,398 registered sex offenders living in Austin and 106 registered sex offenders living in . The ratio of residents to sex offenders in Austin is 678 to 1; the ratio in Fremont is 2,199 to 1. The number of registered sex offenders compared to the number of residents is much larger in Austin than that in Fremont.
Cost of Living
The cost of living in Austin is generally lower than in Fremont. Everything from housing, groceries, and healthcare is cheaper in Austin. On the other hand, although Fremont is costly, high average salaries, particularly within the tech industry, can balance out living costs.
Income Tax
There's no personal income tax in Texas, which can be a huge benefit for residents of Austin. California, on the other hand, has progressive income tax, making living in Fremont more expensive in terms of tax liability.
Property Tax
Texas has one of the highest property tax rates in the U.S., making Austin's property tax quite high despite lower home prices. Conversely, Fremont in California has lower property tax rates, but high home values.
Sales Tax
Sales tax is higher in Fremont with a rate of 9.75% compared to Austin's 8.25%. Both rates are set by the combination of state, county, city, and special district rates.
Income
Type
Austin
Fremont
Estimated median household income
$79,542
$155,968
Estimated per capita income
$53,937
$64,320
Cost of living index (U.S. average is 100)
96.4
124.5
If you make $50,000 in Austin, you will have to make $64,575 in Fremont to maintain the same standard of living.
Geographical Conditions
Both cities offer beautiful landscapes. Austin is known for its hill country, rivers, and lakes. Fremont features rolling hills, the Bay, and a milder climate. Both cities are ideal for active outdoor enthusiasts.
Fremont excels in terms of education. It is home to top-ranked public schools and its proximity to renowned universities like Stanford and UC Berkeley is a draw for many. Austin, with the University of Texas being its centerpiece, also values education but overall educational attainment tends to be higher in Fremont.
Both cities have strong economies. Austin's economy is diverse with sectors like technology, pharmaceutical, and music thriving. Meanwhile, Fremont is interconnected with Silicon Valley's tech economy, with many residents working in the tech industry. Both cities have low unemployment rates and high job growth.
Biggest Employers
In Austin, the largest employers include the State of Texas, the University of Texas, and Dell. For Fremont, the Tesla Factory is an important employer with other notable entities being Western Digital, Lam Research, and Synnex.
There were 4,180 building permits issued in Austin in 2012 (2467 more than in 2011) compared to 141 building permits issued in Fremont in 2012 (14 more than in 2011).
In Austin (Travis County), 60.2% voted for Democrats and 36.2% for Republicans in 2012 Presidential Election. In Fremont (Alameda County), 78.9% voted for Democrats and 18.2% for Republicans.
Elections
Type
Democrats
Republicans
Other
Year
Austin
Fremont
Austin
Fremont
Austin
Fremont
2020
71.7%
79.8%
26.5%
17.6%
1.8%
2.6%
2016
65.8%
78.2%
27.2%
14.6%
7.0%
7.2%
2012
60.2%
78.9%
36.2%
18.2%
3.6%
3.0%
2008
63.8%
78.8%
34.4%
19.3%
1.8%
2.0%
2004
56.1%
75.5%
42.1%
23.4%
1.8%
1.1%
2000
41.7%
69.6%
47.0%
24.2%
11.3%
6.2%
1996
52.4%
65.8%
40.0%
23.1%
7.7%
11.2%
Breakdown of population affiliated with a religious congregation
Type
Adherents
Congregations
Religion
Austin
Fremont
Austin
Fremont
CATHOLIC CHURCH
17.3%
15.3%
4.5%
4.9%
SOUTHERN BAPTIST CONVENTION
8.0%
1.5%
22.8%
10.9%
EPISCOPAL CHURCH
1.4%
0.3%
2.8%
1.7%
MUSLIM ESTIMATE
1.2%
2.0%
0.7%
2.5%
EVANGELICAL LUTHERAN CHURCH IN AMERICA
1.0%
0.3%
2.5%
2.3%
LUTHERAN CHURCH
0.9%
0.3%
2.1%
1.6%
AMERICAN BAPTIST CHURCHES IN THE USA
0.1%
0.5%
0.1%
2.5%
Weather
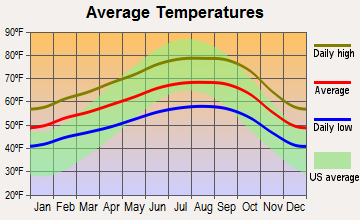
Weather in the two cities is starkly different. Austin experiences humid subtropical climate, with mild winters and hot, humid summers, whereas Fremont, benefits from California's Mediterranean climate, characterized by mild, wet winters and warm, dry summers. Despite their climatic differences, both cities offer an ample amount of sunny days which can appeal to outdoor enthusiasts.
Weather and climate
Type
Austin
Fremont
Temperature - Average
68.5°F
60°F
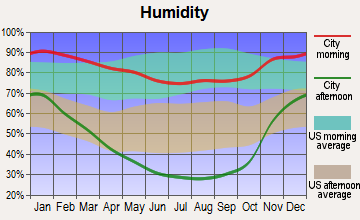
Humidity - Average morning or afternoon humidity
75.2%
81.4%
Humidity - Differences between morning and afternoon humidity
40%
29.9%
Humidity - Maximum monthly morning or afternoon humidity
89%
87.6%
Humidity - Minimum monthly morning or afternoon humidity
49%
57.7%
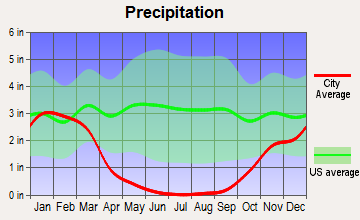
Precipitation - Yearly average
33.7 in
14.9 in
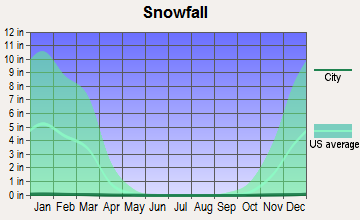
Snowfall - Yearly average
1.4 in
0 in
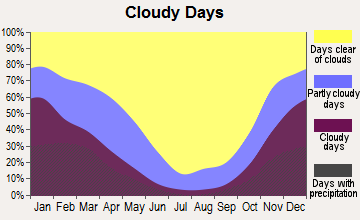
Clouds - Number of days clear of clouds
19.3%
27%
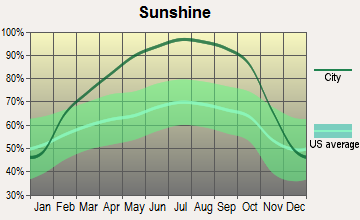
Sunshine amount - Average
63.3%
73.2%
Sunshine amount - Differences during a year
22%
22.3%
Sunshine amount - Maximum monthly
72%
77.1%
Sunshine amount - Minimum monthly
50%
54.8%
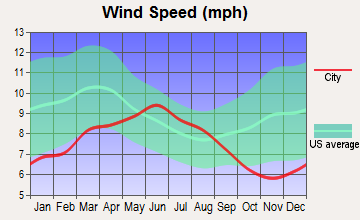
Wind speed - Average
7.2 mph
11 mph
Average climate in Austin, Texas
Average climate in Fremont, California
Air pollution
Type
AQI
CO
NO2
OZONE
PB
PM25
SO2
Year
Austin
Fremont
Austin
Fremont
Austin
Fremont
Austin
Fremont
Fremont
Austin
Fremont
Austin
Fremont
2018
76
101
N/A
0.47
4.9
12.5
26.7
25.7
0.006
N/A
8.7
12.3
0.2
0.3
2017
76
101
N/A
0.45
4.6
11.9
29.7
25.0
0.004
N/A
8.3
9.8
0.3
0.3
2016
71
94
N/A
0.41
4.2
11.0
29.5
24.2
0.003
N/A
8.2
8.2
0.2
0.4
2015
78
96
N/A
0.45
4.4
12.5
28.9
24.1
0.004
N/A
8.6
8.4
0.3
0.4
2014
74
93
N/A
0.40
5.2
12.2
28.3
23.4
0.004
N/A
8.7
8.0
0.5
0.3
2013
78
98
0.09
0.41
5.5
12.3
29.5
21.7
0.004
N/A
8.6
10.4
0.5
0.4
2012
86
85
0.13
0.38
5.5
10.9
30.1
22.9
0.002
N/A
8.6
8.3
N/A
0.7
2011
83
93
0.11
0.39
2.6
12.0
33.0
22.7
0.002
N/A
9.1
10.0
N/A
0.7
2010
77
92
0.05
0.38
3.2
12.2
29.4
19.9
0.002
N/A
8.8
8.7
N/A
0.5
2009
76
98
0.05
0.38
2.6
13.0
29.7
20.3
0.004
N/A
9.0
9.6
N/A
0.6
2008
81
112
0.12
0.44
3.2
14.0
30.7
21.4
N/A
N/A
9.7
10.8
N/A
N/A
2007
82
102
0.12
0.44
3.1
14.2
27.1
20.7
0.007
N/A
9.8
9.8
N/A
N/A
2006
89
109
0.14
0.51
3.8
15.3
31.3
21.6
N/A
N/A
10.0
10.5
0.2
N/A
2005
92
104
0.15
0.46
4.4
15.4
29.0
19.7
N/A
N/A
10.7
11.5
0.2
N/A
2004
74
109
0.16
0.39
3.3
15.1
26.8
20.5
N/A
N/A
N/A
10.9
N/A
N/A
2003
85
90
0.26
0.44
4.2
17.0
28.9
21.3
N/A
N/A
N/A
N/A
0.1
N/A
2002
83
90
0.33
0.54
3.9
19.3
27.2
20.5
0.005
N/A
N/A
N/A
N/A
1.6
2001
83
87
0.31
0.54
4.2
19.4
25.5
19.6
0.005
N/A
N/A
N/A
N/A
N/A
2000
86
89
0.28
0.56
4.7
19.6
27.8
18.1
0.005
N/A
N/A
N/A
N/A
N/A
Natural disasters
Type
Austin
Fremont
Tornado activity compared to U.S. average
137.9%
9.5%
Earthquake activity compared to U.S. average
80.4%
7,767.1%
Natural disasters compared to U.S. average
29%
20%
Transportation
Austin's public transit is reliable but the city is also very car-centric. Fremont, on the other hand, benefits from the Bay Area's extensive BART and bus systems. However, both cities are dealing with traffic congestion due to population growth.
Transport
Type
Austin
Fremont
Amtrak stations
1
1
Amtrak stations nearby
1
3
FAA registered aircraft
911
54
FAA registered aircraft manufacturers and dealers
21
2
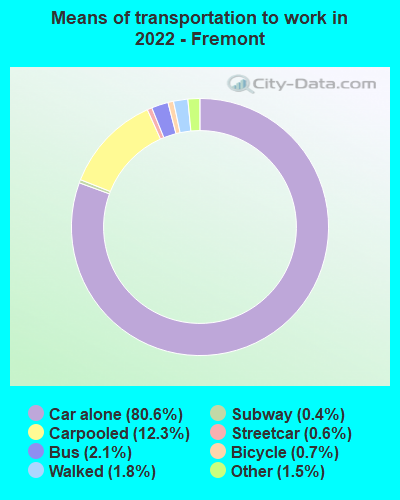
Means of transportation to work
Type
Austin
Fremont
Bicycle
0.8%
1.5%
Bus
1.5%
3.6%
Carpooled
7.9%
11.2%
Car alone
85.9%
79.7%
Motorcycle
0.3%
0.3%
Railroad
0%
0.7%
Streetcar
0%
0.3%
Subway
0%
0.6%
Taxicab
0.1%
0.1%
Walked
2%
1%
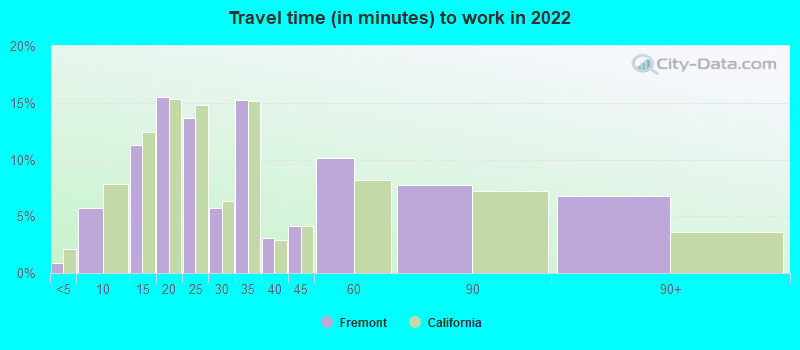
Average travel time to work
Type
Austin
Fremont
Average
29.9 min
35.4 min
Other means
22.7 min
32.3 min
Public transportation
37.9 min
59.1 min
Private vehicle occupancy
Type
Austin
Fremont
Average
1.1
1.1
Drove alone
91.2%
91.7%
In 2 person carpool
6.3%
6.4%
In 3 person carpool
1.7%
1.9%
In 4 person carpool
0.6%
0%
In 7+ person carpool
0.2%
0%
How many people usually rode to work in the car, truck or van.
Real Estate
The real estate market in Austin is less costly and more favorable to buyers than in Fremont. The median home price in Austin is significantly lower than that in Fremont. However, Fremont's housing market has seen consistent growth in value over the years.
Neighborhoods
Both Austin and Fremont offer diverse neighborhoods. In Austin, neighborhoods like Barton Hills and Hyde Park are sought after for their unique charm. Fremont's Mission San Jose and Niles districts draw residents for their good schools and historic environments.
Houses and residents
Type
Austin
Fremont
Houses
469,156
79,480
Average household size (people)
2.4
3
Median year apartment built
1997
1982
Median year house/condo built
1988
1976
Length of stay in the house since moving in
12.1 years
14.3 years
Houses occupied
449,399 (95.8%)
75,716 (95.3%)
Houses occupied by owners
196,458 (43.7%)
46,436 (61.3%)
Houses occupied by renters
252,941 (56.3%)
29,280 (38.7%)
Median rent asked for vacant for-rent units
$1,286
$3,296
Median monthly housing costs
$1,521
$2,624
Median price asked for vacant for-sale houses and condos
$549,769
$1,442,729
Estimated median house or condo value
$482,900
Over $1,000,000
Median numbers of rooms
4.4
4.9
Median number of rooms in apartments
3.4
3.4
Median number of rooms in houses and condos
6
5.9
Median house price - detached houses
$595,996
Over $1,000,000
Median house price - in 2-unit structures
$393,984
$768,136
Median house price - in 3-to-4-unit structures
$262,826
$760,811
Median house price - in 5 or more unit structures
$576,111
$629,984
Median house price - mobile homes
$56,102
$188,169
Median house price - Townhouses or other attached units
$459,657
$938,095
Median house price - All housing units
$571,154
Over $1,000,000
Median house age
28
42
Renting percentage
54.9%
37.4%
Housing density (houses/condos per square mile)
1,865.3
1,036.4
House value disparities
28.4%
17.4%
Household income disparities
44.8%
33.8%
Median household income for houses/condes with a mortgage
$141,177
$217,141
Median household income for apartments without a mortgage
$86,430
$105,634
Housing units without a mortgage
1,799 (1.3%)
500 (1.5%)
Housing units with both a second mortgage and home equity loan
6,421 (4.8%)
2,014 (6.2%)
Housing units with a mortgage
132,628 (98.7%)
32,079 (98.5%)
Housing units with a home equity loan
206 (0.2%)
169 (0.5%)
Housing units with a second mortgage
8,515 (6.3%)
2,762 (8.5%)
House/condo owner moved in on average (years ago)
9
12
House/condo renter moved in on average (years ago)
1
1
Housing units lacking complete kitchen facilities
0.9%
1.3%
Housing units lacking complete plumbing facilities
0.6%
0.3%
Housing units in structures
Housing units in structures
Austin
Fremont
One, detached
43.1%
55.0%
One, attached
5.2%
15.7%
Two
2.4%
0.7%
3 or 4
4.1%
2.3%
5 to 9
7.2%
3.5%
10 to 19
11.0%
2.7%
20 to 49
8.9%
3.5%
50 or more
17.2%
15.0%
Mobile homes
1.0%
1.6%
Boats, RVs, vans, etc.
0.0%
0.1%
Median real estate property taxes paid for housing units
Self-employed workers in own not incorporated business
38,777
5,630
State government workers
46,229
2,311
Unpaid family workers
102
0
Industries and Occupations
Fremont is tied heavily to the tech industry. Many residents are employed in computer and mathematical occupations. Austin, known as 'Silicon Hills', also thrives on its tech sector, but it has a diverse job market with education, health services, and government as leading sectors.
Both Austin and Fremont have top-notch healthcare facilities. Austin boasts the Dell Seton Medical Center and St. David's medical facilities. Fremont is home to the highly regarded Washington Hospital and Kaiser Permanente.
Health (county statistics)
Type
Austin
Fremont
General health status score of residents in this county from 1 (poor) to 5 (excellent)
Austin's infrastructure has been rapidly developing to keep up with its population growth. On the other hand, as part of the Bay Area, Fremont boasts well-developed infrastructure. Both cities have well-maintained roads, public utilities, and are investing in green infrastructure.
Infrastructure
Type
Austin
Fremont
Hospitals
65
7
TV stations
20
24
Bank branches located here
264
45
Bank institutions located here
43
20
Main business address for public companies
44
35
Drinking water stations with no reported violations in the past
46
3
Drinking water stations with reported violations in the past
HMDA - Conventional home purchase loans - Applications denied
Year
Austin
Fremont
1999
4,733
898
2000
2,950
511
2001
2,038
341
2002
1,772
384
2003
2,213
859
2004
2,458
1,298
2005
3,121
1,454
2006
3,367
1,462
2007
2,560
941
2008
1,747
565
2009
1,067
363
Culture and Food
Austin boasts a unique culture with its tagline, “Keep Austin Weird”. It’s a hub for live music and known for Tex-Mex and barbecue. Fremont offers a diverse cuisine scene due to its multicultural population, from authentic Indian to Vietnamese and beyond.
Sports Teams
Austin has recently welcomed MLS team, Austin FC. It's also home to the Texas Longhorns college teams. Fremont doesn't have its own pro teams, but is close to San Francisco and Oakland teams, including the 49ers, Giants, Warriors, and the A’s.


 Austin, TX
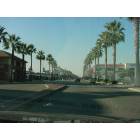
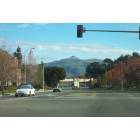
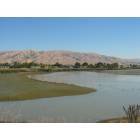
 Fremont, CA