Austin, TX and Buffalo, NY offer distinctive and diverse living experiences, presenting several factors that may appeal or deter people planning to relocate or visit. Notably, these cities differ significantly in weather, cost of living, tax rates, and cultural perspectives. Both cities, nonetheless, also have a few comparable traits in the context of sports teams, education, and employment opportunities. Let's delve deeper into these aspects:
Distance between
Austin, TX and
Buffalo, NY : 1,357.1 miles
Austin's population is larger by 248%. Its population has grown by 307,615 people (46.9%) since 2000. The population of Buffalo has decreased by 15,841 people (5.4%) during that time.
Austin, Texas, generally has a higher crime rate than Buffalo, New York. However, it's essential to note that crime levels can fluctuate significantly between different neighborhoods within a city. Buffalo, on the other hand, has been experiencing a decrease in crime rates in recent years. Safety-wise, both cities encourage community policing, have active neighborhood watch programs, and involve residents in crime prevention efforts.
City-data.com crime index counts serious crimes and violent crime more heavily. It adjusts for the number of visitors and daily workers commuting into cities. (higher means more crime, U.S. average = 301.1)
City-data.com crime index counts serious crimes and violent crime more heavily. It adjusts for the number of visitors and daily workers commuting into cities. (higher means more crime, U.S. average = 301.1)
Sex Offenders
According to our data, there are 1,398 registered sex offenders living in Austin and 712 registered sex offenders living in . The ratio of residents to sex offenders in Austin is 678 to 1; the ratio in Buffalo is 361 to 1. The number of registered sex offenders compared to the number of residents is a smaller in Austin than in Buffalo.
Cost of Living
Austin has a reputation for having a higher cost of living compared to Buffalo. Prices for food, housing, gas, and other commodities are generally higher in Austin. However, higher salaries and below-average unemployment rates in Texas' capital can help mitigate these costs. Contrarily, Buffalo offers an affordable lifestyle, falling below the national average in terms of the cost of living.
Income Tax
Texas, including Austin, doesn't have a state income tax, meaning you'd take home more of your paycheck compared to New York. However, Buffalo residents are subject to New York State income tax, where rates range from 4% on the low end to 8.82% on the high end.
Property Tax
While Austin doesn't have state income tax, it does have high property taxes typically averaging at 1.83%. On the other hand, Buffalo also features relatively high property taxes, with rates averaging around 2.53%.
Sales Tax
In Austin, the total sales tax rate is 8.25%, while in Buffalo, it's 8.75%. This combination of county, city, and state taxes makes Buffalo slightly more expensive when it comes to sales tax than Austin.
Income
Type
Austin
Buffalo
Estimated median household income
$79,542
$40,669
Estimated per capita income
$53,937
$27,269
Cost of living index (U.S. average is 100)
96.4
101.9
If you make $50,000 in Austin, you will have to make $52,853 in Buffalo to maintain the same standard of living.
Geographical Conditions
Austin, located in Central Texas, is characterized by hilly landscapes, beautiful bodies of water, and rich flora. Buffalo, located in Western New York, is near water as well, with Lake Erie and Niagara Falls close by.
Both cities boast a strong education system. Austin is a hub for higher learning institutions with the esteemed University of Texas located there. Buffalo is equally prestigious in the field of education, with the University at Buffalo leading the realm of higher education in this area. Both cities have public and private schools with good ratings for those considering family life.
Austin is an economic powerhouse, home to a thriving tech industry, which earns it the nickname "Silicon Hills." It has just over 5% unemployment rate. Buffalo has a diversified economy with a focus on healthcare, education, and financial services. Its unemployment rate hovers around 6.5% as of 2020.
Biggest Employers
Austin's biggest employers include Dell Technologies, IBM, and the University of Texas at Austin. Buffalo's largest employers, in contrast, are the State of New York, Kaleida Health, and the University at Buffalo.
There were 4,180 building permits issued in Austin in 2012 (2467 more than in 2011) compared to 35 building permits issued in Buffalo in 2012 (29 more than in 2011).
In Austin (Travis County), 60.2% voted for Democrats and 36.2% for Republicans in 2012 Presidential Election. In Buffalo (Erie County), 57.4% voted for Democrats and 41.0% for Republicans.
Elections
Type
Democrats
Republicans
Other
Year
Austin
Buffalo
Austin
Buffalo
Austin
Buffalo
2020
71.7%
56.3%
26.5%
41.6%
1.8%
2.1%
2016
65.8%
51.0%
27.2%
44.5%
7.0%
4.5%
2012
60.2%
57.4%
36.2%
41.0%
3.6%
1.6%
2008
63.8%
58.2%
34.4%
40.6%
1.8%
1.3%
2004
56.1%
56.5%
42.1%
41.5%
1.8%
1.9%
2000
41.7%
56.7%
47.0%
37.8%
11.3%
5.5%
1996
52.4%
54.7%
40.0%
32.3%
7.7%
13.0%
Breakdown of population affiliated with a religious congregation
Type
Adherents
Congregations
Religion
Austin
Buffalo
Austin
Buffalo
CATHOLIC CHURCH
17.3%
38.4%
4.5%
15.8%
SOUTHERN BAPTIST CONVENTION
8.0%
0.2%
22.8%
2.5%
EPISCOPAL CHURCH
1.4%
0.8%
2.8%
4.4%
MUSLIM ESTIMATE
1.2%
1.8%
0.7%
1.9%
EVANGELICAL LUTHERAN CHURCH IN AMERICA
1.0%
1.7%
2.5%
4.9%
LUTHERAN CHURCH
0.9%
0.9%
2.1%
3.3%
AMERICAN BAPTIST CHURCHES IN THE USA
0.1%
0.8%
0.1%
3.6%
Weather
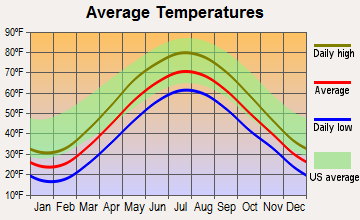
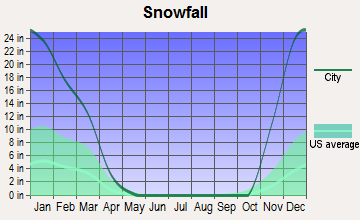
When it comes to weather, Austin offers a warm, humid climate with mild winters and hot, extended summers. Conversely, Buffalo, known as the "City of Good Neighbors", has a cooler climate characterized by harsh winters and pleasantly warm summers. This city is also known for its significant snowfall, a feature that could either be a draw or a deterrent based on individual preference.
Weather and climate
Type
Austin
Buffalo
Temperature - Average
68.5°F
47.7°F
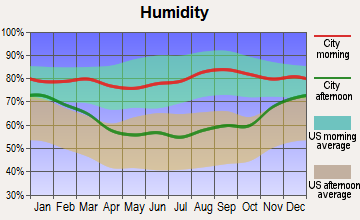
Humidity - Average morning or afternoon humidity
75.2%
76.3%
Humidity - Differences between morning and afternoon humidity
40%
28%
Humidity - Maximum monthly morning or afternoon humidity
89%
83%
Humidity - Minimum monthly morning or afternoon humidity
49%
55%
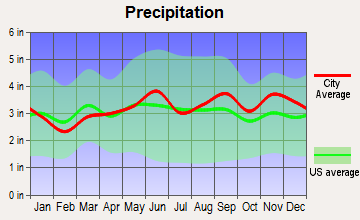
Precipitation - Yearly average
33.7 in
38.7 in
Snowfall - Yearly average
1.4 in
183.7 in
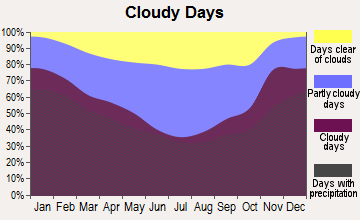
Clouds - Number of days clear of clouds
19.3%
8.9%
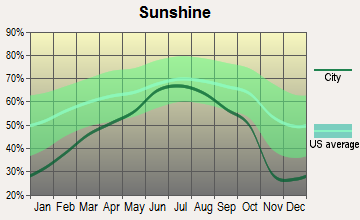
Sunshine amount - Average
63.3%
51.3%
Sunshine amount - Differences during a year
22%
43%
Sunshine amount - Maximum monthly
72%
66%
Sunshine amount - Minimum monthly
50%
23%
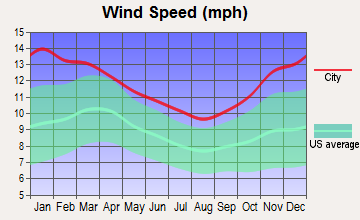
Wind speed - Average
7.2 mph
11.2 mph
Average climate in Austin, Texas
Average climate in Buffalo, New York
Air pollution
Type
AQI
CO
NO2
OZONE
PB
PM25
SO2
Year
Austin
Buffalo
Austin
Buffalo
Austin
Buffalo
Austin
Buffalo
Buffalo
Austin
Buffalo
Austin
Buffalo
2018
76
62
N/A
0.26
4.9
N/A
26.7
30.2
N/A
N/A
8.7
7.5
0.2
0.4
2017
76
68
N/A
0.32
4.6
N/A
29.7
29.8
N/A
N/A
8.3
7.5
0.3
0.4
2016
71
71
N/A
0.30
4.2
N/A
29.5
31.7
N/A
N/A
8.2
7.7
0.2
0.5
2015
78
69
N/A
0.35
4.4
N/A
28.9
30.2
N/A
N/A
8.6
8.8
0.3
1.1
2014
74
69
N/A
0.39
5.2
N/A
28.3
30.7
N/A
N/A
8.7
8.6
0.5
1.5
2013
78
73
0.09
0.33
5.5
N/A
29.5
31.4
N/A
N/A
8.6
9.0
0.5
2.4
2012
86
83
0.13
0.34
5.5
6.4
30.1
30.5
N/A
N/A
8.6
9.4
N/A
2.7
2011
83
82
0.11
0.41
2.6
8.3
33.0
28.8
N/A
N/A
9.1
8.9
N/A
2.0
2010
77
85
0.05
0.35
3.2
8.3
29.4
30.6
N/A
N/A
8.8
10.3
N/A
1.5
2009
76
78
0.05
0.28
2.6
7.4
29.7
28.7
N/A
N/A
9.0
9.8
N/A
1.7
2008
81
90
0.12
0.36
3.2
9.5
30.7
29.5
N/A
N/A
9.7
11.4
N/A
2.3
2007
82
97
0.12
0.38
3.1
10.2
27.1
29.5
N/A
N/A
9.8
12.4
N/A
2.7
2006
89
76
0.14
0.38
3.8
10.5
31.3
27.4
N/A
N/A
10.0
N/A
0.2
2.8
2005
92
94
0.15
0.41
4.4
12.3
29.0
29.7
N/A
N/A
10.7
N/A
0.2
3.8
2004
74
76
0.16
0.43
3.3
11.9
26.8
27.6
N/A
N/A
N/A
N/A
N/A
3.4
2003
85
89
0.26
0.50
4.2
13.0
28.9
27.6
0.005
N/A
N/A
N/A
0.1
5.5
2002
83
100
0.33
0.46
3.9
13.4
27.2
30.5
0.008
N/A
N/A
N/A
N/A
5.8
2001
83
93
0.31
0.46
4.2
15.2
25.5
27.9
0.021
N/A
N/A
N/A
N/A
7.2
2000
86
85
0.28
0.53
4.7
15.3
27.8
25.6
0.023
N/A
N/A
N/A
N/A
6.8
Natural disasters
Type
Austin
Buffalo
Tornado activity compared to U.S. average
137.9%
26.3%
Earthquake activity compared to U.S. average
80.4%
32.9%
Natural disasters compared to U.S. average
29%
22%
Transportation
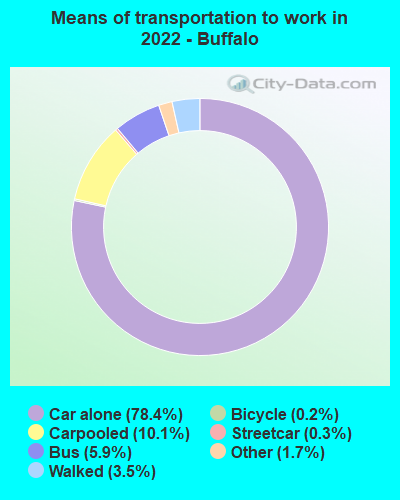
Austin, similar to most Texas cities, is spread out, and having a car is almost necessary. Austin’s Capital Metropolitan Transportation Authority provides bus and rail services. Buffalo has a more comprehensive public transportation system with buses and light rail Metro Rail. Buffalo is also significantly more walkable than Austin.
Transport
Type
Austin
Buffalo
Amtrak stations
1
0
Amtrak stations nearby
1
3
FAA registered aircraft
911
87
FAA registered aircraft manufacturers and dealers
21
1
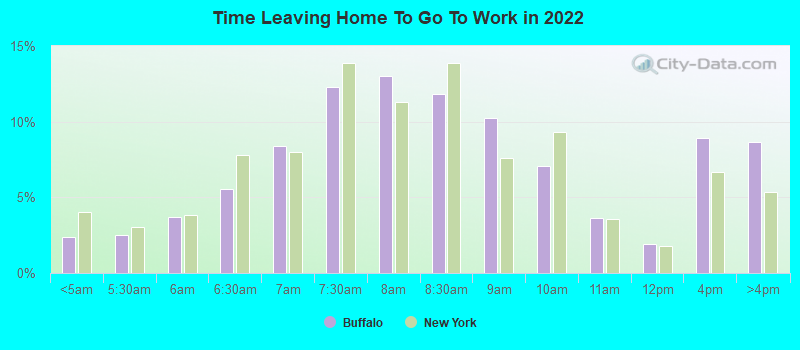
Means of transportation to work
Type
Austin
Buffalo
Bicycle
0.8%
0.5%
Bus
1.5%
5.8%
Carpooled
7.9%
7.8%
Car alone
85.9%
80.5%
Motorcycle
0.3%
0.1%
Railroad
0%
0.2%
Streetcar
0%
0.3%
Subway
0%
0.6%
Taxicab
0.1%
0.3%
Walked
2%
3.1%
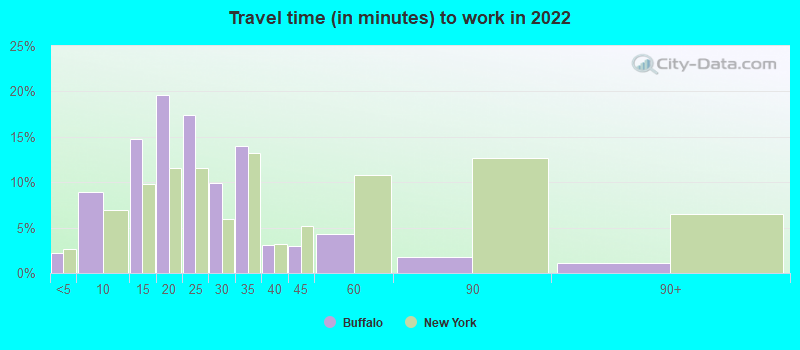
Average travel time to work
Type
Austin
Buffalo
Average
29.9 min
23.8 min
Other means
22.7 min
19.9 min
Public transportation
37.9 min
36.6 min
Private vehicle occupancy
Type
Austin
Buffalo
Average
1.1
1.1
Drove alone
91.2%
89.9%
In 2 person carpool
6.3%
6.9%
In 3 person carpool
1.7%
2.6%
In 4 person carpool
0.6%
0.3%
In 5-6 person carpool
0.1%
0.2%
In 7+ person carpool
0.2%
0.1%
How many people usually rode to work in the car, truck or van.
Real Estate
Austin's real estate market is booming, with home prices being much higher than the national average. Buffalo's housing market, in contrast, is much more affordable, with the median home cost significantly below the national average.
Neighborhoods
Austin's neighborhoods, such as Hyde Park, Allandale, and Crestview, are popular for their unique charm, dining, and shopping options. Buffalo’s Elmwood Village, North Buffalo, and Allentown provide cultural diversity, historical architecture, and a sense of community for its residents.
Houses and residents
Type
Austin
Buffalo
Houses
469,156
137,222
Average household size (people)
2.4
2.2
Length of stay in the house since moving in
12.1 years
15.8 years
Houses occupied
449,399 (95.8%)
122,569 (89.3%)
Houses occupied by owners
196,458 (43.7%)
54,108 (44.1%)
Houses occupied by renters
252,941 (56.3%)
68,461 (55.9%)
Median rent asked for vacant for-rent units
$1,286
$372.33
Median monthly housing costs
$1,521
$812
Median price asked for vacant for-sale houses and condos
$549,769
$283,454
Estimated median house or condo value
$482,900
$155,200
Median numbers of rooms
4.4
5.6
Median number of rooms in apartments
3.4
4.9
Median number of rooms in houses and condos
6
6.5
Median house price - detached houses
$595,996
$160,989
Median house price - in 2-unit structures
$393,984
$176,595
Median house price - in 3-to-4-unit structures
$262,826
$166,381
Median house price - in 5 or more unit structures
$576,111
$451,923
Median house price - mobile homes
$56,102
$51,009
Median house price - Townhouses or other attached units
$459,657
$280,424
Median house price - All housing units
$571,154
$172,704
Median house age
28
2,021
Renting percentage
54.9%
59.3%
Housing density (houses/condos per square mile)
1,865.3
3,378.8
House value disparities
28.4%
44.5%
Household income disparities
44.8%
50.4%
Median household income for houses/condes with a mortgage
$141,177
$78,318
Median household income for apartments without a mortgage
$86,430
$50,382
Housing units without a mortgage
1,799 (1.3%)
2,243 (7.7%)
Housing units with both a second mortgage and home equity loan
6,421 (4.8%)
1,953 (6.7%)
Housing units with a mortgage
132,628 (98.7%)
26,930 (92.3%)
Housing units with a home equity loan
206 (0.2%)
69 (0.2%)
Housing units with a second mortgage
8,515 (6.3%)
2,377 (8.1%)
House/condo owner moved in on average (years ago)
9
16
House/condo renter moved in on average (years ago)
1
3
Housing units lacking complete kitchen facilities
0.9%
5.5%
Housing units lacking complete plumbing facilities
0.6%
1.9%
Housing units in structures
Housing units in structures
Austin
Buffalo
One, detached
43.1%
39.4%
One, attached
5.2%
2.7%
Two
2.4%
34.2%
3 or 4
4.1%
8.0%
5 to 9
7.2%
3.3%
10 to 19
11.0%
2.6%
20 to 49
8.9%
3.4%
50 or more
17.2%
6.1%
Mobile homes
1.0%
0.0%
Boats, RVs, vans, etc.
0.0%
0.2%
Median real estate property taxes paid for housing units
Self-employed workers in own not incorporated business
38,777
5,576
State government workers
46,229
6,135
Unpaid family workers
102
313
Industries and Occupations
In Austin, the main industries are technology, government, education, and healthcare. The presence of many tech companies generates ample job opportunities in IT and related sectors. Buffalo, conversely, has a diversified economy with focus sectors like healthcare and social assistance, retail trade, and manufacturing.
Austin and Buffalo both offer commendable healthcare services. Austin has state-of-art healthcare facilities like the Dell Seton Medical Center. Buffalo, alternatively, prides itself on the Buffalo Niagara Medical Campus, housing leading hospitals and institutes.
Health (county statistics)
Type
Austin
Buffalo
General health status score of residents in this county from 1 (poor) to 5 (excellent)
Infrastructure is robust in both cities. Austin benefits from its status as a rapidly growing technology hub. It has numerous amenities, including recreational parks, a vibrant nightlife scene, and a dynamic food scene. Buffalo, on the other hand, prides itself on historic architecture, with structures representing a range of styles from various periods.
Infrastructure
Type
Austin
Buffalo
Hospitals
65
15
TV stations
20
14
Arenas or stadiums
2
2
Bank branches located here
264
69
Bank institutions located here
43
10
Main business address for public companies
44
6
Drinking water stations with no reported violations in the past
46
4
Drinking water stations with reported violations in the past
HMDA - Conventional home purchase loans - Applications denied
Year
Austin
Buffalo
1999
4,733
426
2000
2,950
620
2001
2,038
559
2002
1,772
407
2003
2,213
335
2004
2,458
468
2005
3,121
447
2006
3,367
701
2007
2,560
619
2008
1,747
316
2009
1,067
105
Culture and Food
Austin is well-known for its vibrant food scene, particularly its food trucks and Tex-Mex cuisine. It also has a thriving music scene. Buffalo's cultural facets are varied and rich with various music forms, art galleries, and unique food specialties, including the local favorite, Buffalo Wings.
Sports Teams
Austin houses professional sports teams like Austin FC in soccer while Buffalo is home to teams such as the Buffalo Bills (NFL) and Buffalo Sabres (NHL). Both cities, therefore, offer thrilling sports experiences for the enthusiasts.


 Austin, TX
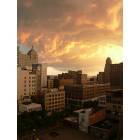
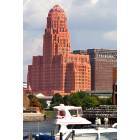
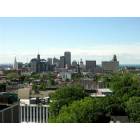
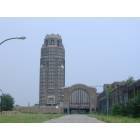
 Buffalo, NY