Austin, Texas and Aurora, Illinois lie in contrasting regions of the United States. Austin is known for its vibrant music and tech scenes, while Aurora offers a quieter suburban feel close to the bustling metropolis of Chicago. Each has its unique advantages and quirks that make them appealing to different individuals, and this guide aims to provide a comprehensive comparison between living in these two cities.
Distance between
Austin, TX and
Aurora, IL : 950.2 miles
Austin's population is larger by 438%. Its population has grown by 307,615 people (46.9%) since 2000. The population of Aurora has grown by 36,276 people (25.4%) during that time.
Austin has a slightly higher rate of crime than the national average and significantly higher than Aurora. Aurora's crime rate is considerably lower than the national average, making it one of the safest cities in America. This makes Aurora more appealing for families and those seeking a safer environment. However, Austin has been improving its safety measures, focusing on community policing, increasing the number of officers on the street and investing in technology to aid in crime prevention and investigation.
City-data.com crime index counts serious crimes and violent crime more heavily. It adjusts for the number of visitors and daily workers commuting into cities. (higher means more crime, U.S. average = 301.1)
City-data.com crime index counts serious crimes and violent crime more heavily. It adjusts for the number of visitors and daily workers commuting into cities. (higher means more crime, U.S. average = 301.1)
Sex Offenders
According to our data, there are 1,398 registered sex offenders living in Austin and 253 registered sex offenders living in . The ratio of residents to sex offenders in Austin is 678 to 1; the ratio in Aurora is 779 to 1. The number of registered sex offenders compared to the number of residents in Austin is near to than in Aurora.
Cost of Living
Austin's cost of living is slightly above the national average, with housing as the primary factor driving the cost of living higher. On the other hand, Aurora has a cost of living slightly below the national average, with housing costs notably lower than Austin.
Income Tax
As mentioned, Austin residents enjoy no state income tax. In contrast, Aurora residents have to pay a flat income tax rate of 4.95% to the state of Illinois.
Property Tax
Property taxes in both Austin and Aurora are relatively high. In Austin, the average property tax rate is around 1.8% of the property’s assessed fair market value, while in Aurora it is around 2.2%.
Sales Tax
Texas does not have a state income tax, which is a significant benefit for residents in Austin. However, the sales tax in Austin is relatively high at 8.25%. Illinois has a lower sales tax rate, currently at 6.25%, but Aurora has an additional city sales tax, bringing the total to 8%.
Income
Type
Austin
Aurora
Estimated median household income
$79,542
$83,996
Estimated per capita income
$53,937
$34,054
Cost of living index (U.S. average is 100)
96.4
100.6
If you make $50,000 in Austin, you will have to make $52,178 in Aurora to maintain the same standard of living.
Geographical Conditions
Austin is set in the Texas Hill Country, with stunning landscapes including lakes, rivers, and rolling hills. Aurora, located in the Midwest, is generally flat and is intersected by the Fox River. Both cities provide beautiful, although very different, natural surroundings.
Both cities have a strong commitment to education. Austin is the home of the University of Texas, a highly ranked public university known for its research programs. Aurora hosts several higher education institutions as well, including Aurora University. Both cities also have highly rated public and private schools, making them good options for families.
Austin's economy is thriving, fueled by the technology, pharmaceutical, and biotechnology industries. Aurora also has a robust economy, but relies more on the manufacturing, healthcare, and retail sectors. Both cities offer numerous job opportunities, though the types of jobs and industries differ significantly.
Biggest Employers
Austin's largest employers include Dell, the State of Texas, the University of Texas at Austin, and Ascension Seton. Aurora's biggest employers are Caterpillar, Rush-Copley Medical Center, and the City of Aurora. Both cities are conducive to job growth and have stable employment opportunities.
There were 4,180 building permits issued in Austin in 2012 (2467 more than in 2011) compared to 55 building permits issued in Aurora in 2012 (12 less than in 2011).
In Austin (Travis County), 60.2% voted for Democrats and 36.2% for Republicans in 2012 Presidential Election. In Aurora (Kane County), 49.7% voted for Democrats and 48.6% for Republicans.
Elections
Type
Democrats
Republicans
Other
Year
Austin
Aurora
Austin
Aurora
Austin
Aurora
2020
71.7%
56.3%
26.5%
41.9%
1.8%
1.8%
2016
65.8%
52.0%
27.2%
41.5%
7.0%
6.4%
2012
60.2%
49.7%
36.2%
48.6%
3.6%
1.6%
2008
63.8%
55.4%
34.4%
43.6%
1.8%
1.0%
2004
56.1%
44.1%
42.1%
55.1%
1.8%
0.8%
2000
41.7%
42.5%
47.0%
54.5%
11.3%
3.0%
1996
52.4%
41.8%
40.0%
47.4%
7.7%
10.8%
Breakdown of population affiliated with a religious congregation
Type
Adherents
Congregations
Religion
Austin
Aurora
Austin
Aurora
CATHOLIC CHURCH
17.3%
30.2%
4.5%
8.6%
SOUTHERN BAPTIST CONVENTION
8.0%
0.5%
22.8%
4.9%
EPISCOPAL CHURCH
1.4%
0.6%
2.8%
2.5%
MUSLIM ESTIMATE
1.2%
2.6%
0.7%
1.2%
EVANGELICAL LUTHERAN CHURCH IN AMERICA
1.0%
1.8%
2.5%
4.3%
LUTHERAN CHURCH
0.9%
2.6%
2.1%
6.1%
AMERICAN BAPTIST CHURCHES IN THE USA
0.1%
0.9%
0.1%
3.1%
Weather
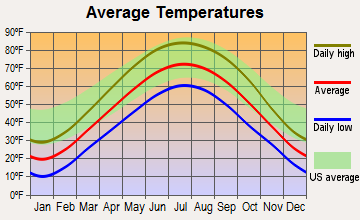
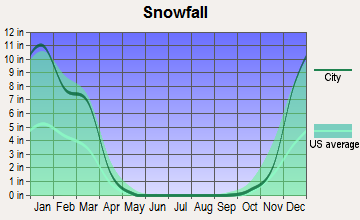
Austin and Aurora also have contrasting climates. Austin features a humid subtropical climate with hot summers and mild winters, which provides plenty of opportunities for outdoor activities year-round. Aurora, on the other hand, experiences a humid continental climate, with hot summers and cold, snowy winters. This weather can make certain outdoor activities limited during the winter months.
Weather and climate
Type
Austin
Aurora
Temperature - Average
68.5°F
48°F
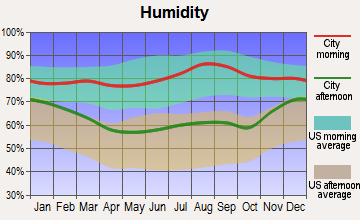
Humidity - Average morning or afternoon humidity
75.2%
75.7%
Humidity - Differences between morning and afternoon humidity
40%
31.3%
Humidity - Maximum monthly morning or afternoon humidity
89%
85.3%
Humidity - Minimum monthly morning or afternoon humidity
49%
54%
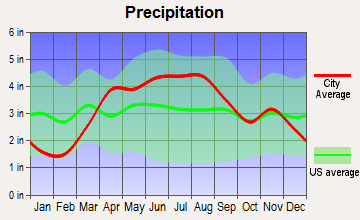
Precipitation - Yearly average
33.7 in
38.4 in
Snowfall - Yearly average
1.4 in
77.2 in
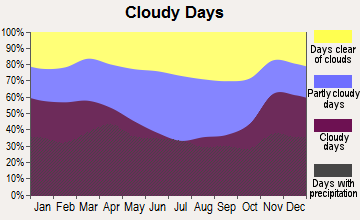
Clouds - Number of days clear of clouds
19.3%
14.1%
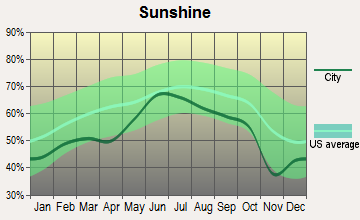
Sunshine amount - Average
63.3%
56.8%
Sunshine amount - Differences during a year
22%
33%
Sunshine amount - Maximum monthly
72%
68%
Sunshine amount - Minimum monthly
50%
35%
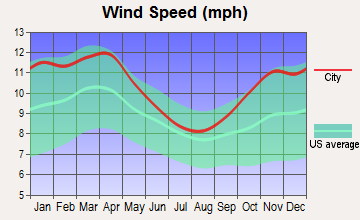
Wind speed - Average
7.2 mph
10.7 mph
Average climate in Austin, Texas
Average climate in Aurora, Illinois
Air pollution
Type
AQI
CO
NO2
OZONE
PM10
PM25
SO2
Year
Austin
Aurora
Austin
Austin
Austin
Aurora
Aurora
Austin
Aurora
Austin
Aurora
2018
76
85
N/A
N/A
4.9
N/A
26.7
26.6
23.9
N/A
8.7
10.6
0.2
0.9
2017
76
76
N/A
N/A
4.6
N/A
29.7
27.8
26.2
N/A
8.3
N/A
0.3
1.0
2016
71
77
N/A
N/A
4.2
N/A
29.5
27.6
27.7
N/A
8.2
N/A
0.2
0.5
2015
78
76
N/A
N/A
4.4
N/A
28.9
26.3
36.0
N/A
8.6
N/A
0.3
1.5
2014
74
72
N/A
N/A
5.2
N/A
28.3
24.8
46.2
N/A
8.7
N/A
0.5
1.0
2013
78
72
0.09
N/A
5.5
N/A
29.5
24.3
N/A
N/A
8.6
N/A
0.5
2.1
2012
86
87
0.13
N/A
5.5
N/A
30.1
25.7
N/A
N/A
8.6
10.3
N/A
2.5
2011
83
82
0.11
N/A
2.6
N/A
33.0
24.6
26.9
N/A
9.1
12.8
N/A
3.1
2010
77
87
0.05
N/A
3.2
N/A
29.4
24.3
26.5
N/A
8.8
12.6
N/A
2.7
2009
76
94
0.05
N/A
2.6
N/A
29.7
21.7
26.4
N/A
9.0
13.2
N/A
2.7
2008
81
87
0.12
N/A
3.2
N/A
30.7
22.4
29.0
N/A
9.7
11.8
N/A
4.2
2007
82
111
0.12
N/A
3.1
N/A
27.1
23.6
32.6
N/A
9.8
12.7
N/A
4.8
2006
89
68
0.14
N/A
3.8
N/A
31.3
20.2
32.1
N/A
10.0
N/A
0.2
4.3
2005
92
84
0.15
N/A
4.4
N/A
29.0
22.7
32.0
N/A
10.7
N/A
0.2
4.7
2004
74
71
0.16
N/A
3.3
N/A
26.8
19.8
32.8
N/A
N/A
N/A
N/A
4.5
2003
85
80
0.26
N/A
4.2
N/A
28.9
20.2
31.8
N/A
N/A
N/A
0.1
4.0
2002
83
90
0.33
N/A
3.9
N/A
27.2
21.2
37.1
N/A
N/A
N/A
N/A
4.6
2001
83
85
0.31
N/A
4.2
N/A
25.5
20.6
37.8
N/A
N/A
N/A
N/A
5.4
2000
86
64
0.28
N/A
4.7
N/A
27.8
19.4
N/A
N/A
N/A
N/A
N/A
4.2
Natural disasters
Type
Austin
Aurora
Tornado activity compared to U.S. average
137.9%
153.1%
Earthquake activity compared to U.S. average
80.4%
154.4%
Natural disasters compared to U.S. average
29%
15%
Transportation
Austin has a growing public transit system with buses, railways, and bike lanes. Aurora has a more established public transit system being closely tied to Chicago’s CTA and Metra. Both cities are making efforts to improve their public transit options for better commuting experiences.
Transport
Type
Austin
Aurora
Amtrak stations
1
0
Amtrak stations nearby
1
3
FAA registered aircraft
911
30
FAA registered aircraft manufacturers and dealers
21
0
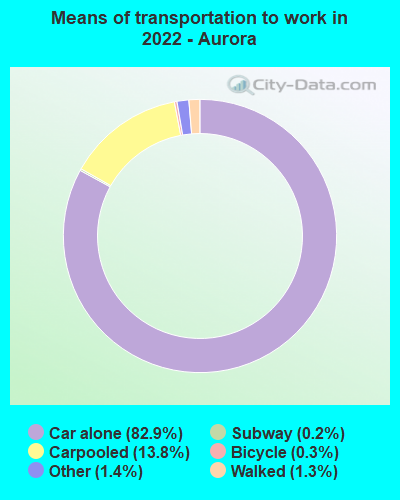
Means of transportation to work
Type
Austin
Aurora
Bicycle
0.8%
0.2%
Bus
1.5%
0.3%
Carpooled
7.9%
11%
Car alone
85.9%
85.1%
Motorcycle
0.3%
0.1%
Subway
0%
0.3%
Taxicab
0.1%
0%
Walked
2%
1.8%
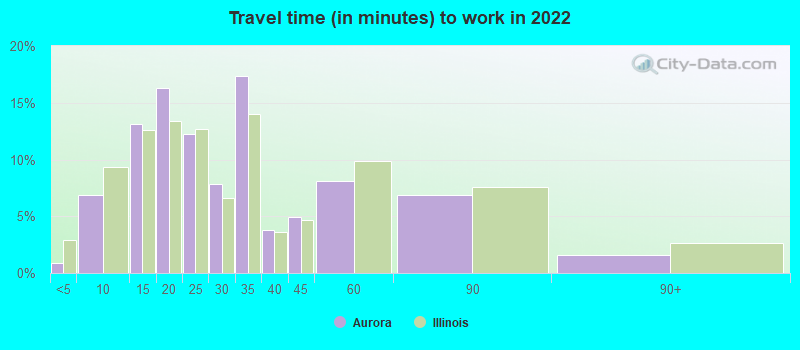
Average travel time to work
Type
Austin
Aurora
Average
29.9 min
27 min
Other means
22.7 min
28.1 min
Public transportation
37.9 min
61.4 min
Private vehicle occupancy
Type
Austin
Aurora
Average
1.1
1.3
Drove alone
91.2%
86.1%
In 2 person carpool
6.3%
9.7%
In 3 person carpool
1.7%
0.6%
In 4 person carpool
0.6%
1%
In 5-6 person carpool
0.1%
2.5%
In 7+ person carpool
0.2%
0%
How many people usually rode to work in the car, truck or van.
Real Estate
Real estate in Austin tends to be more expensive than Aurora due to the city's high demand and fast growth. Aurora offers more affordable housing but less diversity in terms of home styles.
Neighborhoods
Austin neighborhoods range from artistic and bohemian to family-friendly suburban sprawls. Aurora's neighborhoods offer a more laid-back, suburban vibe. Both cities have a wide range of neighborhoods to suit different lifestyles.
Houses and residents
Type
Austin
Aurora
Houses
469,156
64,677
Average household size (people)
2.4
3.1
Median year apartment built
1997
1977
Median year house/condo built
1988
1990
Length of stay in the house since moving in
12.1 years
13.1 years
Houses occupied
449,399 (95.8%)
62,379 (96.4%)
Houses occupied by owners
196,458 (43.7%)
43,361 (69.5%)
Houses occupied by renters
252,941 (56.3%)
19,018 (30.5%)
Median rent asked for vacant for-rent units
$1,286
$1,534
Median monthly housing costs
$1,521
$1,408
Median price asked for vacant for-sale houses and condos
$549,769
$92,244
Estimated median house or condo value
$482,900
$232,400
Median numbers of rooms
4.4
5.7
Median number of rooms in apartments
3.4
4.3
Median number of rooms in houses and condos
6
6.4
Median house price - detached houses
$595,996
$255,964
Median house price - in 2-unit structures
$393,984
$145,729
Median house price - in 3-to-4-unit structures
$262,826
$141,854
Median house price - in 5 or more unit structures
$576,111
$103,693
Median house price - mobile homes
$56,102
$317,080
Median house price - Townhouses or other attached units
$459,657
$202,183
Median house price - All housing units
$571,154
$240,490
Median house age
28
34
Renting percentage
54.9%
30.4%
Housing density (houses/condos per square mile)
1,865.3
1,678.8
House value disparities
28.4%
26.4%
Household income disparities
44.8%
40.1%
Median household income for houses/condes with a mortgage
$141,177
$112,817
Median household income for apartments without a mortgage
$86,430
$76,448
Housing units without a mortgage
1,799 (1.3%)
296 (1%)
Housing units with both a second mortgage and home equity loan
6,421 (4.8%)
1,148 (3.8%)
Housing units with a mortgage
132,628 (98.7%)
30,127 (99%)
Housing units with a home equity loan
206 (0.2%)
0 (0%)
Housing units with a second mortgage
8,515 (6.3%)
1,552 (5.1%)
House/condo owner moved in on average (years ago)
9
11
House/condo renter moved in on average (years ago)
1
1
Housing units lacking complete kitchen facilities
0.9%
1.3%
Housing units lacking complete plumbing facilities
0.6%
0.5%
Housing units in structures
Housing units in structures
Austin
Aurora
One, detached
43.1%
59.3%
One, attached
5.2%
16.8%
Two
2.4%
3.6%
3 or 4
4.1%
3.4%
5 to 9
7.2%
3.5%
10 to 19
11.0%
6.0%
20 to 49
8.9%
2.2%
50 or more
17.2%
4.8%
Mobile homes
1.0%
0.3%
Median real estate property taxes paid for housing units
Self-employed workers in own not incorporated business
38,777
3,558
State government workers
46,229
1,410
Unpaid family workers
102
54
Industries and Occupations
Austin's top industries include technology, health care, education, and government. Aurora's leading industries are manufacturing, health care, and retail. Academics and tech professionals may find more opportunities in Austin, while healthcare professionals and manufacturing workers might find Aurora more attractive.
Both Austin and Aurora have excellent healthcare facilities. Austin boasts world-class healthcare with well-ranked hospitals like the Ascension Seton and St. David's Medical Center. Aurora has access to notable facilities like the Rush-Copley Medical Center and is a short distance from the extensive healthcare facilities in Chicago.
Health (county statistics)
Type
Austin
Aurora
General health status score of residents in this county from 1 (poor) to 5 (excellent)
Austin's infrastructure is highly developed, with a focus on technology and sustainability. Aurora, being a suburb of Chicago, has well-developed infrastructure geared more towards residential and commercial needs. Both cities offer a reliable supply of water, electricity, and public utilities.
Infrastructure
Type
Austin
Aurora
Hospitals
65
5
TV stations
20
27
Bank branches located here
264
45
Bank institutions located here
43
19
Main business address for public companies
44
3
Drinking water stations with no reported violations in the past
46
4
Drinking water stations with reported violations in the past
HMDA - Conventional home purchase loans - Applications denied
Year
Austin
Aurora
1999
4,733
182
2000
2,950
240
2001
2,038
182
2002
1,772
191
2003
2,213
363
2004
2,458
683
2005
3,121
1,038
2006
3,367
1,182
2007
2,560
627
2008
1,747
211
2009
1,067
89
Culture and Food
Austin is known for its vibrant music and food scene, with numerous annual festivals celebrating its cultural diversity. Aurora also has a diverse culture, with plenty of opportunities for dining, shopping, and arts, albeit in a more suburban setting.
Sports Teams
Austin has fewer professional sports teams than Aurora, which is proximal to the sports-rich city of Chicago, home of the Bulls, Cubs, Blackhawks, and Bears. However, Austin is home to the Texas Longhorns, and the city takes collegiate sports very seriously.


 Austin, TX
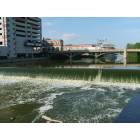
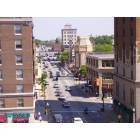
 Aurora, IL