Arlington, TX vs Mesquite, TX - Advanced U.S. city comparison tool

Arlington, TX vs Mesquite, TX

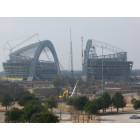
Both Arlington and Mesquite are populous cities in the state of Texas, offering their residents unique benefits and amenities. Arlington is part of the Dallas–Fort Worth metroplex and is home to the world-renowned AT&T Stadium. Mesquite, on the other hand, being smaller and less crowded, offers a more intimate living experience while being conveniently close to the Big D – Dallas. Of course, both cities have their pros and cons, and these need to be assessed based on crucial factors like safety, weather, cost of living, education, economy, neighborhoods, and many others, which we are going to delve into next.
 
 
Distance between Arlington, TX and Mesquite, TX : 30.3 miles

Arlington's population is larger by 166%. Its population has grown by 59,817 people (18.0%) since 2000. The population of Mesquite has grown by 23,168 people (18.6%) during that time.

Population
Type Arlington Mesquite
Population 392,786 147,691
Female / male percentage 49.7% / 50.3%
49.7%
50.3%
53.1% / 46.9%
53.1%
46.9%
Racial makeup - percentage
Ethnicity ArlingtonMesquite
White Non-Hispanic 34.9% 22.5%
Hispanic 34.5% 44.0%
Black 20.7% 24.5%
Asian 6.2% 2.7%
Two or more 3.0% 5.7%
American Indian 0.2% 0.2%
Racial makeup - absolute values
Ethnicity ArlingtonMesquite
White Non-Hispanic 137,137 33,275
Hispanic 135,594 65,197
Black 81,302 36,277
Asian 24,260 4,027
Two or more 11,913 8,431
American Indian 634 351
Pacific Islander 351 92

Crime and Safety

In terms of safety, both cities have their challenges. Both cities have higher than average crime rates compared to national averages. However, Mesquite's crime rate is slightly lower than Arlington's, making it a somewhat safer place to live. Both cities have multiple initiatives in place to combat crime and ensure safety for their residents, but these efforts are ongoing and safety remains a concern for people considering a move.

Crime by year per 100,000 residents
Type City-data.com crime indexRobberies per 100,000Murders per 100,000Rapes per 100,000Assaults per 100,000Burglaries per 100,000Theft per 100,000Auto theft per 100,000Arson per 100,000
Year ArlingtonMesquiteArlingtonMesquiteArlingtonMesquiteArlingtonMesquiteArlingtonMesquiteArlingtonMesquiteArlingtonMesquiteArlingtonMesquiteArlingtonMesquite
2020 285.6 322.7 89.6 105.4 5.7 7.8 60.6 48.8 376.0 276.0 300.7 520.1 1,935.9 2,411.5 313.9 604.3 8.2 7.8
2019 296.4 325.1 100.7 169.8 4.2 4.9 66.6 32.8 349.5 271.9 325.9 463.4 2,182.4 2,558.0 306.0 612.3 3.5 4.9
2018 283.9 309.5 91.3 145.3 1.7 4.8 59.4 37.4 313.8 208.2 379.4 561.7 2,285.2 2,494.5 310.3 570.0 3.2 6.9
2017 323.8 325.8 144.4 169.0 4.5 4.2 68.2 51.2 301.5 202.2 455.0 535.3 2,427.4 2,522.1 344.5 587.9 7.3 4.2
2016 335.5 321.2 141.9 171.5 5.3 1.4 78.2 45.3 331.8 195.5 538.6 656.4 2,340.2 2,636.1 274.8 503.5 3.8 6.2
2015 313.6 321.0 136.5 153.9 2.1 4.8 53.7 34.3 309.9 138.8 559.9 787.3 2,657.1 2,689.4 226.5 590.8 7.5 2.7
2014 317.5 310.1 128.7 132.3 3.4 2.8 53.8 36.7 298.2 127.4 644.9 814.4 2,633.6 2,642.7 236.6 591.4 6.8 6.9
2013 330.6 308.6 148.4 141.4 4.8 4.2 27.7 9.7 304.1 123.3 839.8 957.6 2,872.2 2,899.3 248.2 530.8 10.0 7.6
2012 341.5 307.0 140.3 126.4 4.5 1.4 35.6 9.7 323.0 167.8 934.1 1,082.8 2,798.9 2,782.9 250.5 474.4 13.4 13.1
2011 378.6 311.0 144.7 124.0 5.9 1.4 36.4 5.6 315.2 147.1 1,176.0 1,193.6 3,150.9 2,939.8 284.9 449.0 9.9 7.0
2010 411.9 331.3 145.6 118.0 4.4 5.0 32.6 5.7 344.2 216.0 1,303.4 1,042.0 3,651.0 3,107.5 340.7 510.6 13.1 14.3
2009 440.8 366.2 177.3 165.5 3.2 3.8 40.1 12.8 394.1 219.6 1,290.1 1,045.6 3,742.0 3,506.1 379.6 517.5 12.9 4.5
2008 438.9 324.8 184.7 128.2 6.1 2.3 37.5 7.5 373.6 233.0 1,187.0 776.0 3,762.3 3,317.5 411.9 526.4 16.8 12.8
2007 470.6 323.5 199.4 150.3 3.5 4.5 41.9 6.0 450.7 274.9 1,195.2 713.0 4,028.8 2,957.7 441.3 515.9 17.2 21.9
2006 469.5 301.1 238.6 128.0 3.8 3.7 51.5 7.5 437.4 232.1 1,083.4 693.2 3,727.0 2,802.0 460.8 527.8 11.3 34.4
2005 426.2 310.0 210.2 128.2 6.6 5.3 48.7 11.4 382.9 257.1 1,090.4 634.8 3,998.3 3,006.6 495.4 537.8 14.2 41.7
2004 387.7 312.0 183.4 83.7 3.9 3.8 55.4 7.6 281.7 259.4 935.0 690.8 4,066.8 3,376.4 422.8 566.0 19.4 40.3
2003 389.9 318.1 168.3 113.2 2.5 0.8 47.0 6.1 306.4 234.0 1,014.7 653.8 4,124.0 3,650.5 466.8 582.7 11.8 21.4

City-data.com crime index counts serious crimes and violent crime more heavily. It adjusts for the number of visitors and daily workers commuting into cities. (higher means more crime, U.S. average = 301.1)


Crime per year
Type City-data.com crime indexRobberiesMurdersRapesAssaultsBurglariesTheftAuto theftArson
Year ArlingtonMesquiteArlingtonMesquiteArlingtonMesquiteArlingtonMesquiteArlingtonMesquiteArlingtonMesquiteArlingtonMesquiteArlingtonMesquiteArlingtonMesquite
2019 296.4 325.1 405 243 17 7 268 47 1,406 389 1,311 663 8,780 3,660 1,231 876 14 7
2018 283.9 309.5 366 210 7 7 238 54 1,258 301 1,521 812 9,162 3,606 1,244 824 13 10
2017 323.8 325.8 574 244 18 6 271 74 1,198 292 1,808 773 9,646 3,642 1,369 849 29 6
2016 335.5 321.2 557 250 21 2 307 66 1,303 285 2,115 957 9,189 3,843 1,079 734 15 9
2015 313.6 321.0 529 224 8 7 208 50 1,201 202 2,170 1,146 10,298 3,915 878 860 29 4
2014 317.5 310.1 493 191 13 4 206 53 1,142 184 2,470 1,176 10,086 3,816 906 854 26 10
2013 330.6 308.6 562 204 18 6 105 14 1,152 178 3,181 1,382 10,879 4,184 940 766 38 11
2012 341.5 307.0 532 183 17 2 135 14 1,225 243 3,543 1,568 10,616 4,030 950 687 51 19
2011 378.6 311.0 540 177 22 2 136 8 1,176 210 4,388 1,704 11,757 4,197 1,063 641 37 10
2010 411.9 331.3 532 165 16 7 119 8 1,258 302 4,763 1,457 13,342 4,345 1,245 714 48 20
2009 440.8 366.2 672 220 12 5 152 17 1,494 292 4,891 1,390 14,186 4,661 1,439 688 49 6
2008 438.9 324.8 694 170 23 3 141 10 1,404 309 4,461 1,029 14,140 4,399 1,548 698 63 17
2007 470.6 323.5 742 199 13 6 156 8 1,677 364 4,447 944 14,990 3,916 1,642 683 64 29
2006 469.5 301.1 890 171 14 5 192 10 1,632 310 4,042 926 13,905 3,743 1,719 705 42 46
2005 426.2 310.0 768 169 24 7 178 15 1,399 339 3,984 837 14,609 3,964 1,810 709 52 55
2004 387.7 312.0 662 110 14 5 200 10 1,017 341 3,375 908 14,680 4,438 1,526 744 70 53
2003 389.9 318.1 598 148 9 1 167 8 1,089 306 3,606 855 14,656 4,774 1,659 762 42 28

City-data.com crime index counts serious crimes and violent crime more heavily. It adjusts for the number of visitors and daily workers commuting into cities. (higher means more crime, U.S. average = 301.1)

Sex Offenders

According to our data, there are 602 registered sex offenders living in Arlington and 180 registered sex offenders living in .
The ratio of residents to sex offenders in Arlington is 652 to 1; the ratio in Mesquite is 799 to 1.
The number of registered sex offenders compared to the number of residents in Arlington is near to than in Mesquite.

Cost of Living

The cost of living in both Arlington and Mesquite is slightly lower than the national average. This lower cost of living largely comes down to more affordable housing options in both cities. Nevertheless, each city's cost of living is offset by factors such as income levels, transportation costs, healthcare expenses, and educational facilities.

Income Tax

There is no personal state income tax in Texas, so residents of both Arlington and Mesquite are exempted from this tax.

Property Tax

Arlington has a slightly higher property tax rate compared to Mesquite. However, both cities' rates are higher than the national average. The exact amount a homeowner pays will depend on the assessment of their specific property.

Sales Tax

The sales tax in both cities is identical, as they are both located within the state of Texas. The total combined sales tax rate is 8.25%, which includes a state tax of 6.25% and a local city tax of 2%.
Income
Type Arlington Mesquite
Estimated median household income $59,889 $60,957
Estimated per capita income $31,722 $28,429
Cost of living index (U.S. average is 100) 95.9 94.7

If you make $50,000 in Mesquite, you will have to make $50,634 in Arlington to maintain the same standard of living.

Geographical Conditions

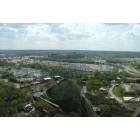
Both Arlington and Mesquite are located in the northeastern part of Texas, characterized by flat terrain and scattered forests. Arlington, located closer to the Trinity River, offers many waterfront views and opportunities for outdoor activities. Mesquite, named after the Mesquite trees common in the area, offers a unique landscape with its many parks.
Geographical information
Type Arlington Mesquite
Land area 95.8 sq. miles 43.4 sq. miles
Population density 4,099.3 people per sq. mile 3,401.8 people per sq. mile
Relative area comparison
Arlington, TX Mesquite, TX
First ancestry reported - percentage
Ancestry ArlingtonMesquite
English 3.9% 2.2%
German 2.8% 1.4%
Irish 2.4% 1.4%
Italian 0.7% 0.4%
Scottish 0.7% 0.2%
French 0.5% 0.2%
Polish 0.4% 0.0%
Scotch-Irish 0.4% 0.2%
Arab 0.3% 0.0%
Norwegian 0.3% 0.1%
Dutch 0.2% 0.1%
Population origin - absolute values
Ancestry ArlingtonMesquite
English 9,739 1,994
German 7,167 1,269
Irish 6,078 1,222
Italian 1,829 374
Scottish 1,785 211
French 1,188 207
Scotch-Irish 1,004 202
Polish 882 41
Arab 814 38
Norwegian 681 129
Dutch 545 108
Swedish 462 24
Czech 430 106
Welsh 183 58
Hungarian 182 40
Danish 172 2
Portuguese 157 13
Russian 156 25
French Canadian 120 82
Greek 109 111
Foreign born residents - absolute values
Type Count
Region ArlingtonMesquite
All 85,043 31,695
Africa 14,638 1,747
Asia 24,009 3,223
Europe 2,247 414
Latin America 42,034 25,441
North America 320 103
Oceania 5 38
Foreign born residents - percentage
Type Percentage
Region ArlingtonMesquite
All 21.3% 21.3%
Africa 3.7% 1.2%
Asia 6.0% 2.2%
Europe 0.6% 0.3%
Latin America 10.5% 17.1%

Education

The educational systems in both cities offer a variety of public and private schools, each with its strengths and weaknesses. The graduation rate in Arlington is slightly higher than that in Mesquite. However, Mesquite boasts higher test scores, especially in math and reading. Both cities also offer access to higher education establishments, with Arlington housing the prominent University of Texas at Arlington that attracts students from around the globe.
School enrollment
Type Arlington Mesquite
Nursery, preschool 3,811 (3.7%) 1,653 (4.2%)
Kindergarten 6,722 (6.5%) 1,755 (4.4%)
Grade 1 to 4 20,705 (20%) 10,535 (26.5%)
Grade 5 to 8 22,896 (22.1%) 8,125 (20.5%)
Grade 9 to 12 20,751 (20%) 10,742 (27%)
College undergrad 23,115 (22.3%) 5,041 (12.7%)
Graduate or professional 5,595 (5.4%) 1,864 (4.7%)
Students in private schools - absolute values
Type Count
Grade ArlingtonMesquite
Grades 1 to 8 (elementary and middle school) 3,714 416
Grades 9 to 12 (high school) 1,382 350
Undergraduate colleges 4,145 984
Students in private schools - percentage
Type Percentage
Grade ArlingtonMesquite
Grades 1 to 8 (elementary and middle school) 8.5% 2.2%
Grades 9 to 12 (high school) 6.7% 3.3%
Undergraduate colleges 17.9% 19.5%
Educational attainment
Type Arlington Mesquite
Less than high school 14.4% 19.9%
High school or equiv. 25.6% 27.9%
Less than 1 year of college 8.3% 8.5%
1 or more years of college 13.2% 16.3%
Associate degree 7.9% 8.4%
Bachelor's degree 20% 13%
Master's degree 8.3% 5.1%
Profess. school degree 1.3% 0.5%
Doctorate degree 1% 0.5%
Education level (25-year-olds and older)
Type Arlington Mesquite
Bachelor's degree or higher 30.6% 19.1%
Graduate or professional degree 10.6% 6%
High school or higher 85.6% 80.1%

Work and Economy

Opportunities for work in both cities are pretty diverse. Arlington's economy leans heavily towards entertainment and tourism, given its many sports teams and entertainment facilities. Conversely, Mesquite's economy is bolstered by its transport and logistics industry due to its location crossroads of multiple highways. Both cities also have a robust retail industry.

Biggest Employers

Some of Arlington's largest employers include the Arlington Independent School District, the University of Texas at Arlington, and General Motors. In contrast, the major employers in Mesquite include the Mesquite Independent School District, UPS, and Dallas Regional Medical Center.
Employment and residency - absolute values
Kind ArlingtonMesquite
Work and live in this city 67,185 15,234
Work and live in this county 147,638 56,586
Workers who work outside the city they live in 265,784 109,289
Workers who work outside the county they live in 49,089 12,979
Working at home 27,028 4,146
Not working at home 169,699 65,595
Employment and residency - percentage
Kind ArlingtonMesquite
Work and live in this city 39.0% 24.1%
Work and live in this county 75.0% 81.3%
Workers who work outside the city they live in 61.0% 75.9%
Workers who work outside the county they live in 25.0% 18.7%
Working at home 13.7% 5.9%
Not working at home 86.3% 94.1%
Geographical mobility: all
Type all
Mobility ArlingtonMesquite
Same house 1 year ago 88.4% 87.9%
Moved from abroad 0.6% 0.8%
Moved within same county 6.8% 9.2%
Moved from different state 1.3% 0.8%
Moved within same state 2.8% 1.3%
Geographical mobility: Asian
Type Asian
Mobility ArlingtonMesquite
Same house 1 year ago 87.3% 93.5%
Moved from abroad 1.3% 1.1%
Moved within same county 5.5% 5.0%
Moved from different state 2.9% 0.9%
Moved within same state 3.0% 1.2%
Geographical mobility: Black
Type Black
Mobility ArlingtonMesquite
Same house 1 year ago 86.3% 85.5%
Moved from abroad 0.1% 0.5%
Moved within same county 10.5% 10.1%
Moved from different state 1.2% 1.8%
Moved within same state 1.9% 2.2%
Geographical mobility: White
Type White
Mobility ArlingtonMesquite
Same house 1 year ago 89.3% 90.9%
Moved from abroad 0.8% 1.4%
Moved within same county 5.2% 5.8%
Moved from different state 1.2% 1.1%
Moved within same state 3.5% 0.7%
Building permits
Type Average valueCount
City ArlingtonMesquiteArlingtonMesquite
1997 $89,900 $80,900 1,454 622
1998 $95,100 $90,200 2,026 551
1999 $100,300 $103,900 2,046 672
2000 $103,900 $116,500 2,224 686
2001 $104,600 $117,300 2,565 439
2002 $135,900 $117,900 2,196 347
2003 $141,700 $114,700 1,721 421
2004 $141,300 $111,600 1,835 509
2005 $140,600 $107,600 1,419 426
2006 $154,500 $143,400 1,151 345
2007 $163,200 $91,600 812 132
2008 $154,300 $155,500 426 64
2009 $169,400 $98,700 245 79
2010 $165,800 $123,400 286 42
2011 $179,400 $134,100 232 33
2012 $197,200 $79,600 456 33
2013 $199,100 $104,300 545 24
2014 $189,700 $122,000 470 11
2015 $203,700 $127,300 379 27
2016 $258,500 $205,000 283 34
2017 $218,900 $279,300 475 67
2018 $207,100 $238,300 624 70
2019 $208,600 $236,700 840 64
2020 $198,600 $244,200 725 257
2021 $176,500 $237,500 976 560

There were 976 building permits issued in Arlington in 2012 (744 more than in 2011) compared to 560 building permits issued in Mesquite in 2012 (527 more than in 2011).

In Arlington (Tarrant County), 41.4% voted for Democrats and 57.1% for Republicans in 2012 Presidential Election. In Mesquite (Dallas County), 57.3% voted for Democrats and 41.8% for Republicans.

Elections
Type DemocratsRepublicansOther
Year ArlingtonMesquiteArlingtonMesquiteArlingtonMesquite
2020 49.3% 65.1% 49.1% 33.4% 1.6% 1.4%
2016 43.2% 60.8% 51.8% 34.7% 5.0% 4.5%
2012 41.4% 57.3% 57.1% 41.8% 1.4% 1.0%
2008 43.8% 57.4% 55.5% 42.0% 0.7% 0.6%
2004 37.0% 49.0% 62.5% 50.4% 0.5% 0.5%
2000 36.9% 45.0% 60.9% 52.7% 2.3% 2.4%
1996 41.6% 46.0% 50.9% 46.8% 7.5% 7.2%
Breakdown of population affiliated with a religious congregation
Type AdherentsCongregations
Religion ArlingtonMesquiteArlingtonMesquite
SOUTHERN BAPTIST CONVENTION 17.3% 11.0% 33.3% 31.1%
CATHOLIC CHURCH 11.1% 18.9% 1.9% 2.4%
MUSLIM ESTIMATE 2.2% 3.6% 0.9% 1.1%
LUTHERAN CHURCH 0.5% 0.3% 0.9% 0.7%
SEVENTH DAY ADVENTIST CHURCH 0.4% 0.5% 1.6% 1.7%
EPISCOPAL CHURCH 0.3% 1.0% 0.8% 1.5%
EVANGELICAL LUTHERAN CHURCH IN AMERICA 0.3% 0.3% 0.9% 0.9%

Weather

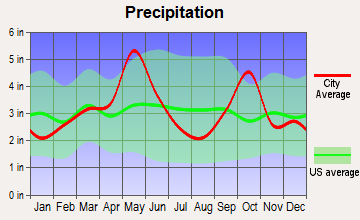
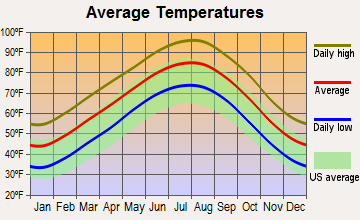
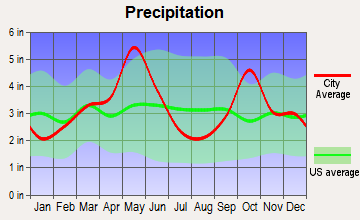
The weather in both cities is typified by hot summers and mild to cool winters. With an average of 232 sunny days, Arlington has a slight edge over Mesquite's average of 229 sunny days. Both cities experience moderate rainfall throughout the year, although the heavy downpours can sometimes lead to flooding in certain areas.
Weather and climate
Type Arlington Mesquite
Temperature - Average 65°F 65.4°F
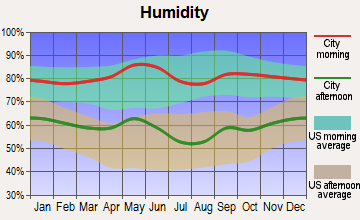
Humidity - Average morning or afternoon humidity 71.4% 71.3%
Humidity - Differences between morning and afternoon humidity 34% 34%
Humidity - Maximum monthly morning or afternoon humidity 82% 82%
Humidity - Minimum monthly morning or afternoon humidity 48% 48%
Precipitation - Yearly average 37.9 in 39 in
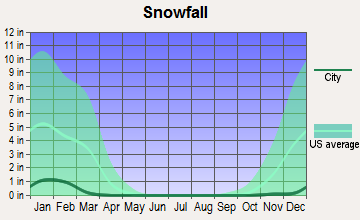
Snowfall - Yearly average 4.2 in 4.2 in
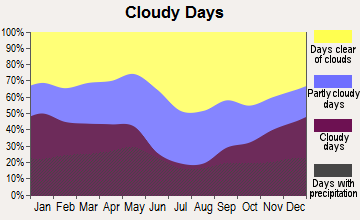
Clouds - Number of days clear of clouds 22.7% 22.7%
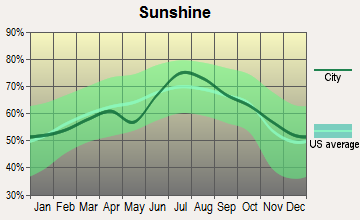
Sunshine amount - Average 66.6% 66.6%
Sunshine amount - Differences during a year 20% 20%
Sunshine amount - Maximum monthly 74% 74%
Sunshine amount - Minimum monthly 54% 54%
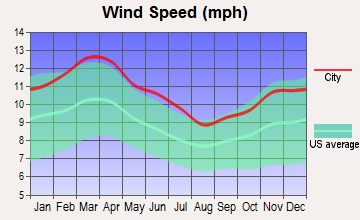
Wind speed - Average 10.3 mph 10.3 mph

Average climate in Arlington, Texas

Chicago, Illinois average temperatures Chicago, Illinois average precipitation Chicago, Illinois humidity Chicago, Illinois wind speed Chicago, Illinois snowfall Chicago, Illinois sunshine Chicago, Illinois clear and cloudy days
 

Average climate in Mesquite, Texas

Chicago, Illinois average temperatures Chicago, Illinois average precipitation Chicago, Illinois humidity Chicago, Illinois wind speed Chicago, Illinois snowfall Chicago, Illinois sunshine Chicago, Illinois clear and cloudy days
 

Air pollution
Type AQICONO2OZONEPM25SO2
Year ArlingtonMesquiteArlington ArlingtonMesquiteArlingtonMesquiteArlingtonMesquiteArlingtonMesquite
2018 86 86 N/A N/A 5.8 5.3 27.1 28.1 9.4 9.1 0.4 0.3
2017 86 84 N/A N/A 6.2 5.0 27.2 29.0 9.1 8.7 0.3 0.4
2016 76 73 N/A N/A 6.3 5.4 25.5 28.1 8.2 8.1 0.2 0.3
2015 80 82 N/A N/A 6.5 5.9 24.8 28.3 8.6 8.5 0.3 0.3
2014 78 77 0.22 N/A 6.8 5.6 26.6 29.3 9.3 9.3 0.3 0.4
2013 96 96 0.25 N/A 6.4 6.5 27.2 30.6 11.0 11.7 0.2 0.4
2012 108 110 0.26 N/A 7.8 7.7 30.3 32.2 10.5 11.1 0.3 0.4
2011 96 99 0.23 N/A 8.2 8.3 30.7 32.4 9.5 10.7 0.6 0.7
2010 76 76 0.23 N/A 8.9 8.4 27.7 29.8 8.4 9.3 0.7 0.6
2009 91 90 0.25 N/A 8.7 8.1 29.5 30.4 8.5 9.1 0.5 0.5
2008 92 86 0.25 N/A 9.6 8.7 25.8 30.4 10.7 9.7 0.5 0.6
2007 95 99 0.30 N/A 10.6 9.5 24.6 27.4 9.8 10.2 0.5 0.4
2006 102 104 0.34 N/A 10.4 9.5 29.7 32.4 9.9 9.9 0.8 0.7
2005 110 107 0.34 N/A 11.7 11.3 28.4 31.6 11.3 11.0 1.0 0.8
2004 90 95 0.39 N/A 10.8 10.8 25.4 28.4 N/A N/A 0.9 0.7
2003 97 100 0.40 N/A 11.1 12.1 27.2 30.4 N/A N/A 1.0 0.9
2002 97 95 0.37 N/A 11.8 12.3 25.8 28.1 N/A N/A 0.6 0.4
2001 88 91 0.48 N/A 14.7 12.3 25.0 28.4 N/A N/A 1.1 0.9
2000 104 104 0.55 N/A 14.5 14.0 26.2 28.2 N/A N/A 1.3 1.1
Natural disasters
Type Arlington Mesquite
Tornado activity compared to U.S. average 254.3% 250.2%
Earthquake activity compared to U.S. average 558.3% 562.6%
Natural disasters compared to U.S. average 23% 21%

Transportation

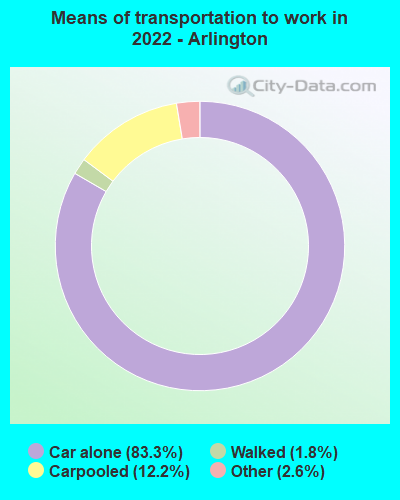
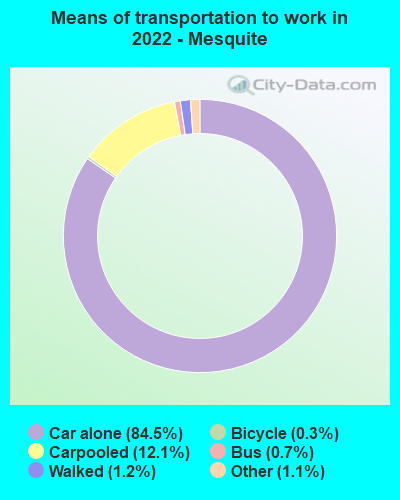
Arlington is highly dependent on cars for commuting, with a large majority of residents driving their own vehicles. The city does, however, offer a rideshare program called "Via". Mesquite, on the other hand, is served by the Dallas Area Rapid Transit (DART) system, offering bus service across the city. Both cities offer reasonable commute times, given their sizes.
Transport
Type Arlington Mesquite
Amtrak stations nearby 2 1
FAA registered aircraft 362 82
FAA registered aircraft manufacturers and dealers 5 2
Means of transportation to work
Type Arlington Mesquite
Bicycle 0.2% 0.3%
Bus 0% 0.6%
Carpooled 11.9% 11.5%
Car alone 85% 85.7%
Motorcycle 0.1% 0.1%
Walked 1.4% 1.1%
Means of transportation to work
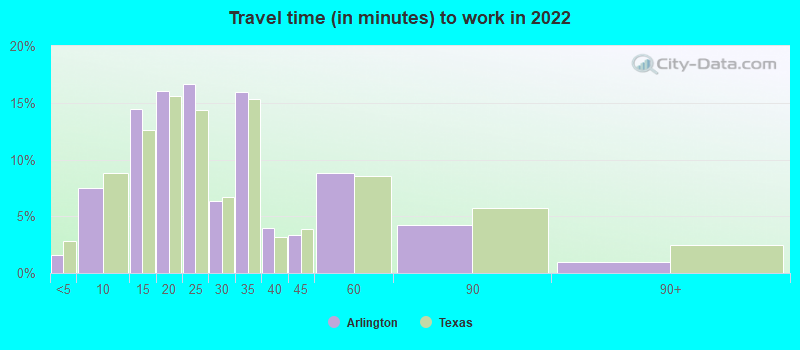
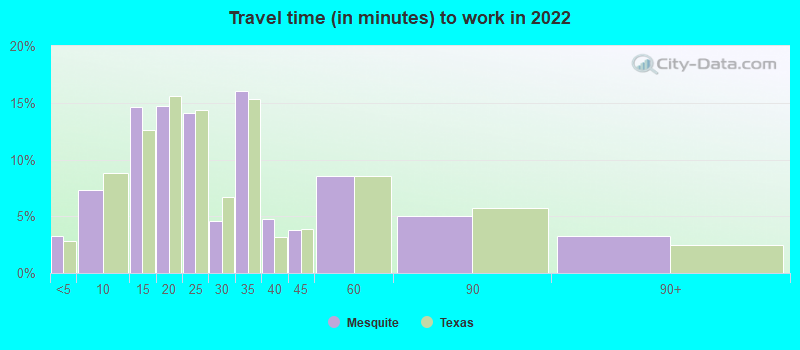
Average travel time to work
Type Arlington Mesquite
Average 26.1 min 28.2 min
Other means 27.6 min 30.9 min
Public transportation 45.1 min 46.8 min
Travel time to work
Time leaving to work
Travel time to work
Time leaving to work
Private vehicle occupancy
Type Arlington Mesquite
Average 1.2 1.2
Drove alone 88.7% 84.3%
In 2 person carpool 7.8% 11.3%
In 3 person carpool 2.2% 2.9%
In 4 person carpool 0.8% 0.7%
In 5-6 person carpool 0.4% 0.6%
In 7+ person carpool 0.1% 0.2%

How many people usually rode to work in the car, truck or van.

Real Estate

Real estate in both cities is fairly affordable but is more so in Mesquite. The median home cost in Mesquite is significantly lower than in Arlington. Both cities have seen steady appreciation in home values over the past decade, offering potential investment opportunities.

Neighborhoods

Arlington is home to diverse neighborhoods, each offering its unique vibe from bustling downtown areas to peaceful suburban regions. The city is also known for its well-maintained parks. Mesquite, while smaller, boasts a friendly and close-knit community feel in its neighborhoods with an emphasis on family-friendly environments.
Houses and residents
Type Arlington Mesquite
Houses 156,653 55,252
Average household size (people) 2.7 2.9
Median year apartment built 1983 1986
Median year house/condo built 1984 1983
Length of stay in the house since moving in 13 years 12.9 years
Houses occupied 146,888 (93.8%) 52,023 (94.2%)
Houses occupied by owners 78,883 (53.7%) 33,675 (64.7%)
Houses occupied by renters 68,005 (46.3%) 18,348 (35.3%)
Median rent asked for vacant for-rent units $1,609 $1,206
Median monthly housing costs $1,220 $1,213
Median price asked for vacant for-sale houses and condos $199,415 $297,978
Estimated median house or condo value $254,700 $208,900
Median numbers of rooms 5.4 5.4
Median number of rooms in apartments 4.1 4.2
Median number of rooms in houses and condos 6.5 6
Median house price - detached houses $265,594 $178,609
Median house price - in 2-unit structures $415,006 $84,682
Median house price - in 3-to-4-unit structures $224,044 $148,342
Median house price - in 5 or more unit structures $131,545 $240,293
Median house price - mobile homes $92,300 $58,740
Median house price - Townhouses or other attached units $171,140 $180,243
Median house price - All housing units $259,527 $180,062
Median house age 37 37
Renting percentage 42.6% 38.6%
Housing density (houses/condos per square mile) 1,634.9 1,272.6
House value disparities 25% 24.3%
Household income disparities 43.9% 41.7%
Median household income for houses/condes with a mortgage $97,883 $86,417
Median household income for apartments without a mortgage $67,452 $71,936
Housing units without a mortgage 948 (2%) 267 (1.3%)
Housing units with both a second mortgage and home equity loan 1,684 (3.6%) 611 (2.9%)
Housing units with a mortgage 46,456 (98%) 20,601 (98.7%)
Housing units with a home equity loan 0 (0%) 0 (0%)
Housing units with a second mortgage 1,967 (4.1%) 975 (4.7%)
House/condo owner moved in on average (years ago) 13 13
House/condo renter moved in on average (years ago) 1 1
Housing units lacking complete kitchen facilities 1.7% 0.8%
Housing units lacking complete plumbing facilities 1% 1.7%
Housing units in structures
Housing units in structures ArlingtonMesquite
One, detached 60.2% 71.9%
One, attached 10.8% 2.6%
Two 1.5% 1.0%
3 or 4 4.3% 3.8%
5 to 9 5.7% 5.4%
10 to 19 7.7% 5.1%
20 to 49 3.3% 4.2%
50 or more 5.2% 4.1%
Mobile homes 1.3% 1.9%
Boats, RVs, vans, etc. 0.1% 0.0%
Median real estate property taxes paid for housing units
Type Arlington Mesquite
With mortgages $4,727 (1.8%) $3,323 (1.5%)
With no mortgages $3,676 (1.5%) $2,778 (1.5%)
Marital status
Type Arlington Mesquite
Divorced 10.1% 9.8%
Never married 35.8% 40.1%
Now married 47.7% 43.8%
Separated 1.7% 2.2%
Widowed 4.7% 4.2%
Class of workers - percentage
Class of Workers ArlingtonMesquite
Employee of private company 74.3% 72.7%
Local government workers 7.1% 6.9%
Self-employed workers in own not incorporated business 5.5% 6.6%
Private not-for-profit wage and salary workers 5.0% 5.8%
State government workers 3.4% 1.8%
Self-employed in own incorporated business 2.9% 3.9%
Federal government workers 1.7% 1.9%
Unpaid family workers 0.2% 0.5%
Class of workers - absolute values
Class of Workers ArlingtonMesquite
Employee of private company 148,108 54,041
Federal government workers 3,337 1,380
Local government workers 14,123 5,136
Private not-for-profit wage and salary workers 9,955 4,309
Self-employed in own incorporated business 5,720 2,878
Self-employed workers in own not incorporated business 10,953 4,883
State government workers 6,771 1,369
Unpaid family workers 396 373

Industries and Occupations

The major industries in Arlington include entertainment, tourism, education, health care, and retail. Among the common occupations in Arlington are office and administrative support, sales, and management. In contrast, Mesquite's economy is dominated by transportation and logistics, health care, and retail, with the most common occupations being office and administrative support, transportation, and sales.
Most common male industries
Industry ArlingtonMesquite
Construction 15.7% 21.1%
Transportation and warehousing 14.2% 11.8%
Manufacturing 12.5% 8.4%
Retail trade 10.2% 15.4%
Accommodation and food services 6.6% 5.7%
Administrative and support and waste management services 5.9% 5.8%
Professional, scientific, and technical services 5.1% 4.5%
Educational services 4.9% 3.8%
Other services, except public administration 4.9% 7.1%
Finance and insurance 4.2% 3.0%
Health care and social assistance 3.8% 3.4%
Wholesale trade 2.9% 3.3%
Public administration 2.6% 1.1%
Information 2.3% 1.4%
Real estate and rental and leasing 2.2% 1.7%
Arts, entertainment, and recreation 1.1% 0.4%
Mining, quarrying, and oil and gas extraction 0.6% 1.3%
Utilities 0.4% 0.5%
Agriculture, forestry, fishing and hunting 0.1% 0.2%
Most common female industries
Industry ArlingtonMesquite
Health care and social assistance 21.3% 14.2%
Educational services 12.9% 10.3%
Retail trade 12.1% 18.1%
Finance and insurance 7.4% 8.8%
Other services, except public administration 7.2% 8.7%
Manufacturing 6.8% 3.1%
Accommodation and food services 5.8% 9.9%
Professional, scientific, and technical services 5.5% 5.6%
Transportation and warehousing 5.2% 4.9%
Administrative and support and waste management services 4.8% 4.5%
Public administration 4.0% 2.6%
Arts, entertainment, and recreation 1.9% 0.5%
Construction 1.6% 1.2%
Wholesale trade 1.6% 2.4%
Real estate and rental and leasing 1.1% 1.9%
Information 0.5% 2.0%
Mining, quarrying, and oil and gas extraction 0.2% 0.1%
Management of companies and enterprises 0.1% 1.3%
Most common male occupations
Occupation ArlingtonMesquite
Construction and extraction occupations 10.9% 18.9%
Management occupations 8.6% 7.0%
Material moving occupations 8.5% 10.1%
Transportation occupations 8.3% 8.5%
Installation, maintenance, and repair occupations 8.3% 7.9%
Sales and related occupations 8.0% 7.4%
Production occupations 7.1% 6.1%
Office and administrative support occupations 7.0% 8.5%
Computer and mathematical occupations 5.1% 2.9%
Building and grounds cleaning and maintenance occupations 4.5% 4.0%
Business and financial operations occupations 4.1% 2.9%
Food preparation and serving related occupations 3.8% 2.9%
Architecture and engineering occupations 2.8% 2.6%
Educational instruction, and library occupations 2.8% 3.0%
Arts, design, entertainment, sports, and media occupations 2.1% 0.9%
Personal care and service occupations 2.0% 0.2%
Health diagnosing and treating practitioners and other technical occupations 1.3% 0.4%
Community and social service occupations 1.0% 1.2%
Healthcare support occupations 0.8% 1.6%
Law enforcement workers including supervisors 0.7% 1.2%
Most common female occupations
Occupation ArlingtonMesquite
Office and administrative support occupations 19.1% 20.3%
Sales and related occupations 9.8% 12.7%
Educational instruction, and library occupations 8.9% 7.9%
Management occupations 8.8% 7.0%
Business and financial operations occupations 7.0% 2.7%
Healthcare support occupations 5.6% 5.8%
Health diagnosing and treating practitioners and other technical occupations 5.4% 4.4%
Personal care and service occupations 5.1% 5.8%
Food preparation and serving related occupations 4.7% 7.0%
Production occupations 4.0% 3.0%
Material moving occupations 3.6% 8.6%
Building and grounds cleaning and maintenance occupations 3.2% 6.6%
Community and social service occupations 3.1% 0.4%
Transportation occupations 2.2% 1.1%
Computer and mathematical occupations 2.2% 1.4%
Health technologists and technicians 1.9% 2.1%
Legal occupations 1.5% 0.0%
Arts, design, entertainment, sports, and media occupations 1.2% 1.9%
Food environment data per 10,000 residents
Food environment statistics ArlingtonMesquite
Number of convenience stores (no gas) 3.6 2.8
Number of convenience stores (with gas) 1.1 1.2
Number of full-service restaurants 5.7 6.7
Number of grocery stores 1.2 1.6
Number of supercenters and club stores 0.2 0.1
Food environment - absolute values
Food environment statistics ArlingtonMesquite
Number of convenience stores (no gas) 609 673
Number of convenience stores (with gas) 194 275
Number of full-service restaurants 970 1,603
Number of grocery stores 212 392
Number of supercenters and club stores 25 25
Obesity and diabetes
Food environment statistics rate ArlingtonMesquite
Adult diabetes rate 8.1% 8.8%
Adult obesity rate 26.1% 27.1%
Low-income preschool obesity rate 14.5% 17.0%

Health Care

Arlington boasts more healthcare facilities than Mesquite, including the renowned Texas Health Resources and the Medical City Arlington. Mesquite, however, is home to the Dallas Regional Medical Center and offers access to a wide variety of healthcare providers.
Health (county statistics)
Type Arlington Mesquite
General health status score of residents in this county from 1 (poor) to 5 (excellent) 3.4 3.4
Average weight of females (lbs) 159 lbs 171 lbs
Average weight of males (lbs) 197.2 lbs 194.3 lbs
Residents visited a dentist within the past year 66% 61.7%
Residents exercised in the past month 72.8% 71.4%
Residents keep firearms around their homes 30.6% 23.8%
Adult residents drank alcohol in the past 30 days 74.1% 69.3%
Residents smoked 100+ cigarettes in their lives 42.6% 39.8%

Fatal vehicle accidents per 100,000 residents
Type Total count per 100,000Drunk per 100,000Fatal count per 100,000Pedestrian count per 100,000Person count per 100,000Vehicle count per 100,000
Year ArlingtonMesquiteArlingtonMesquiteArlingtonMesquiteArlingtonMesquiteArlingtonMesquiteArlingtonMesquite
2021 13.0 6.8 0.0 0.0 13.7 6.8 3.6 2.0 30.8 19.6 21.4 12.2
2020 8.4 10.7 3.3 3.3 8.6 10.7 1.8 0.7 19.3 20.7 14.7 18.0
2019 6.5 7.1 1.8 1.4 7.0 7.8 1.5 2.1 13.8 16.3 11.0 10.7
2018 7.0 7.0 2.0 2.1 7.3 7.0 1.8 1.4 16.1 14.0 12.3 9.1
2017 6.3 10.4 1.5 2.1 6.8 11.1 2.0 4.9 11.6 27.0 9.1 17.3
2016 6.1 8.3 1.0 3.5 6.6 9.0 2.3 2.1 12.2 27.0 9.6 16.6
2015 6.4 8.3 2.1 3.4 6.9 8.3 2.3 2.1 17.0 17.2 9.8 13.8
2014 7.8 5.5 3.4 3.5 8.4 5.5 2.3 0.7 21.1 12.5 12.5 10.4
2013 6.6 4.9 2.6 2.1 7.4 5.6 1.8 0.0 12.1 11.2 10.3 7.7
2012 5.3 4.9 1.3 1.4 5.6 4.9 2.1 0.0 11.2 8.4 7.5 7.0
2011 8.3 6.3 2.1 2.8 10.2 6.3 1.3 2.8 21.1 11.9 14.5 9.1
2010 5.2 6.4 1.6 2.9 5.7 6.4 0.8 1.4 15.6 9.3 11.2 10.7
2009 8.4 4.5 3.2 0.7 8.4 4.5 1.6 0.0 20.0 21.0 13.2 10.5
2008 7.7 12.1 3.5 3.0 7.7 12.1 1.6 2.3 17.3 40.1 11.5 21.9
2007 6.0 8.4 2.2 2.3 6.5 8.4 1.6 1.5 16.2 12.2 8.4 11.5
2006 7.9 4.6 3.6 0.8 8.5 4.6 2.2 0.8 20.0 14.6 12.6 10.0
2005 8.6 6.3 2.8 1.6 9.7 6.3 1.7 4.7 21.9 20.4 13.6 10.2
2004 4.8 7.1 2.2 0.8 5.3 8.6 0.6 2.4 12.6 18.1 6.7 11.8
2003 5.7 11.7 0.8 2.3 6.2 12.5 1.4 5.5 15.3 33.5 9.3 22.6
2002 7.4 9.3 1.7 3.9 9.2 14.8 1.1 2.3 24.3 29.5 12.0 11.7
2001 7.9 7.0 2.6 0.0 8.5 8.6 2.6 3.9 19.3 18.0 10.5 10.9
2000 8.7 6.4 1.8 0.8 9.3 8.0 3.0 0.8 28.2 32.9 17.7 20.9
1999 5.1 6.9 1.9 0.9 6.4 6.9 1.0 3.4 16.7 12.9 9.0 6.9
1998 7.5 12.2 2.6 0.9 8.2 13.1 2.0 0.9 20.6 27.0 11.1 16.6
1997 7.7 10.6 3.0 1.8 8.0 13.3 1.3 3.5 27.1 32.7 14.0 18.6
1996 7.8 10.7 3.1 2.7 8.5 13.4 2.4 0.9 26.9 23.3 14.6 16.1
1995 10.1 9.0 2.4 1.8 10.7 9.9 4.9 0.9 29.1 26.2 15.9 16.3
1994 11.6 6.4 5.6 1.8 12.0 8.2 2.1 3.7 33.2 14.6 21.5 8.2
1993 6.5 6.5 1.8 0.0 8.3 6.5 1.1 2.8 23.8 19.5 11.5 11.1
1992 7.3 7.5 3.3 3.8 8.4 7.5 1.5 0.9 20.8 19.8 12.1 13.2
1991 13.0 5.7 6.3 2.9 14.9 8.6 3.3 0.0 33.8 19.1 20.5 8.6
1990 8.4 5.9 3.8 2.0 9.1 6.9 0.0 0.0 27.0 13.7 14.4 8.8
1989 9.9 10.2 2.7 3.1 10.3 12.2 0.0 0.0 29.2 30.6 15.2 13.3
1988 11.0 7.4 4.6 1.1 11.8 7.4 0.0 0.0 33.8 13.7 16.7 10.6
1987 12.5 9.9 5.7 5.5 12.9 11.0 0.0 0.0 38.0 31.8 19.4 15.4
1986 10.3 23.9 3.8 11.4 10.6 28.5 0.0 0.0 26.6 59.3 13.7 35.3
1985 10.3 9.5 1.9 4.7 11.4 9.5 0.0 0.0 29.6 19.0 17.1 13.1
1984 11.4 16.1 3.8 2.5 13.3 16.1 0.0 0.0 25.1 35.9 15.2 26.0
1983 8.4 15.5 2.3 3.9 9.9 16.8 0.0 0.0 23.9 51.7 13.7 23.3
1982 9.1 13.5 1.5 6.8 9.5 13.5 0.0 0.0 19.7 18.9 12.9 14.9
1981 8.0 18.4 0.8 9.9 8.7 19.9 0.0 0.0 17.5 46.8 12.1 29.8
1980 11.0 16.4 3.0 10.4 11.8 19.4 0.0 0.0 26.2 47.7 17.8 19.4
1979 8.0 15.2 1.9 6.1 10.3 24.3 0.0 0.0 19.0 45.6 11.4 22.8
1978 7.6 20.1 0.8 4.6 8.4 24.7 0.0 0.0 22.8 61.9 12.9 30.9
1977 4.9 14.2 1.1 1.6 5.3 15.8 0.0 0.0 12.1 28.4 7.6 17.3
1976 3.4 9.6 0.0 0.0 3.4 11.2 0.0 0.0 6.8 27.3 4.9 14.5
1975 3.4 9.8 0.0 0.0 3.4 11.5 0.0 0.0 6.8 27.8 4.9 14.7

Fatal vehicle accidents
Type Total countDrunkFatal countPedestrian countPerson countVehicle count
Year ArlingtonMesquiteArlingtonMesquiteArlingtonMesquiteArlingtonMesquiteArlingtonMesquiteArlingtonMesquite
1975 9 6 0 0 9 7 0 0 18 17 13 9
1976 9 6 0 0 9 7 0 0 18 17 13 9
1977 13 9 3 1 14 10 0 0 32 18 20 11
1978 20 13 2 3 22 16 0 0 60 40 34 20
1979 21 10 5 4 27 16 0 0 50 30 30 15
1980 29 11 8 7 31 13 0 0 69 32 47 13
1981 21 13 2 7 23 14 0 0 46 33 32 21
1982 24 10 4 5 25 10 0 0 52 14 34 11
1983 22 12 6 3 26 13 0 0 63 40 36 18
1984 30 13 10 2 35 13 0 0 66 29 40 21
1985 27 8 5 4 30 8 0 0 78 16 45 11
1986 27 21 10 10 28 25 0 0 70 52 36 31
1987 33 9 15 5 34 10 0 0 100 29 51 14
1988 29 7 12 1 31 7 0 0 89 13 44 10
1989 26 10 7 3 27 12 0 0 77 30 40 13
1990 22 6 10 2 24 7 0 0 71 14 38 9
1991 35 6 17 3 40 9 9 0 91 20 55 9
1992 20 8 9 4 23 8 4 1 57 21 33 14
1993 18 7 5 0 23 7 3 3 66 21 32 12
1994 33 7 16 2 34 9 6 4 94 16 61 9
1995 29 10 7 2 31 11 14 1 84 29 46 18
1996 23 12 9 3 25 15 7 1 79 26 43 18
1997 23 12 9 2 24 15 4 4 81 37 42 21
1998 23 14 8 1 25 15 6 1 63 31 34 19
1999 16 8 6 1 20 8 3 4 52 15 28 8
2000 29 8 6 1 31 10 10 1 94 41 59 26
2001 27 9 9 0 29 11 9 5 66 23 36 14
2002 26 12 6 5 32 19 4 3 85 38 42 15
2003 20 15 3 3 22 16 5 7 54 43 33 29
2004 17 9 8 1 19 11 2 3 45 23 24 15
2005 31 8 10 2 35 8 6 6 79 26 49 13
2006 29 6 13 1 31 6 8 1 73 19 46 13
2007 22 11 8 3 24 11 6 2 60 16 31 15
2008 29 16 13 4 29 16 6 3 65 53 43 29
2009 32 6 12 1 32 6 6 0 76 28 50 14
2010 19 9 6 4 21 9 3 2 57 13 41 15
2011 31 9 8 4 38 9 5 4 79 17 54 13
2012 20 7 5 2 21 7 8 0 42 12 28 10
2013 25 7 10 3 28 8 7 0 46 16 39 11
2014 30 8 13 5 32 8 9 1 81 18 48 15
2015 25 12 8 5 27 12 9 3 66 25 38 20
2016 24 12 4 5 26 13 9 3 48 39 38 24
2017 25 15 6 3 27 16 8 7 46 39 36 25
2018 28 10 8 3 29 10 7 2 64 20 49 13
2019 26 10 7 2 28 11 6 3 55 23 44 15
2020 33 16 13 5 34 16 7 1 76 31 58 27
2021 51 10 0 0 54 10 14 3 121 29 84 18
Police full-time law enforcement employees
Year ArlingtonMesquite
2021 860 313
2020 876 319
2019 882 311
2018 871 311
2017 0 307
2016 0 300
2015 0 302
2014 0 294
2013 807 0
2012 820 293
2011 840 305
2010 817 300
2009 804 307
2008 790 303
2007 759 294
2006 738 292
2005 721 282
2004 693 272
2003 707 265
Police full-time law enforcement employees (per 1,000 residents)
Year ArlingtonMesquite
2021 2.1 2.3
2020 2.2 2.3
2019 2.2 2.2
2018 2.2 2.2
2017 0.0 2.1
2016 0.0 2.1
2015 0.0 2.1
2014 0.0 2.0
2013 2.1 0.0
2012 2.2 2.0
2011 2.3 2.1
2010 2.2 2.1
2009 2.1 2.3
2008 2.1 2.3
2007 2.0 2.2
2006 2.0 2.2
2005 2.0 2.1
2004 1.9 2.1
2003 2.0 2.0
Local government: full-time employees
Job ArlingtonMesquite
Airports 9 4
Correction 72 20
Financial administration 91 50
Firefighters 343 209
Fire - other 116 6
Health 61 30
Judicial and legal 86 22
Local libraries 65 19
Other and unallocable 29 66
Other government administration 88 61
Parks and recreation 204 75
Police - other 34 64
Police protection - officers 780 231
Sewerage 47 20
Streets and highways 142 58
Totals for government 2,433 1,082
Water supply 144 61
Welfare 122 0
Local government: part-time employees
Job ArlingtonMesquite
Airports 1 7
Correction 10 2
Financial administration 6 1
Fire - other 4 0
Health 8 2
Judicial and legal 10 15
Local libraries 65 18
Other government administration 18 1
Parks and recreation 319 121
Police - other 68 3
Police protection - officers 20 0
Sewerage 5 0
Streets and highways 1 0
Totals for government 552 174
Water supply 6 1
Welfare 11 0
Place of birth - Foreign born
Residents ArlingtonMesquite
All residents 21.9% 22.6%
American Indian / Alaska Native residents 24.9% 38.6%
Asian residents 68.3% 69.9%
Black or African American residents 14.7% 4.3%
Other race residents 40.7% 39.3%
Two or more races residents 26.1% 29.5%
White residents 8.2% 11.0%
White alone, not Hispanic / Latino residents 5.8% 2.4%
Place of birth - Native, outside of US
Residents ArlingtonMesquite
All residents 1.2% 0.9%
American Indian / Alaska Native residents 0.6% 6.7%
Asian residents 1.1% 3.4%
Black or African American residents 0.7% 0.9%
Native Hawaiian / Pacific Islander residents 48.9% 49.5%
Other race residents 3.3% 2.0%
Two or more races residents 2.2% 2.0%
White residents 0.9% 0.4%
White alone, not Hispanic / Latino residents 1.1% 0.4%
Place of birth - Born in state of residence
Residents ArlingtonMesquite
All residents 51.7% 59.0%
American Indian / Alaska Native residents 56.8% 46.5%
Asian residents 23.9% 22.3%
Black or African American residents 47.4% 65.7%
Native Hawaiian / Pacific Islander residents 4.2% 50.5%
Other race residents 45.7% 54.4%
Two or more races residents 57.4% 56.8%
White residents 59.0% 67.1%
White alone, not Hispanic / Latino residents 58.1% 68.1%
Place of birth - Born in other state
Residents ArlingtonMesquite
All residents 25.1% 17.4%
American Indian / Alaska Native residents 17.8% 8.2%
Asian residents 6.6% 4.4%
Black or African American residents 37.2% 29.1%
Native Hawaiian / Pacific Islander residents 46.9% 0.0%
Other race residents 10.3% 4.3%
Two or more races residents 14.4% 11.8%
White residents 31.9% 21.5%
White alone, not Hispanic / Latino residents 35.0% 29.1%
English speakers (speaking English at home)
Type Arlington Mesquite
Born in the United States residents 89.4% 86%
Foreign born residents 11.8% 6.7%
Native, born elsewhere residents 49.2% 25.2%
Total residents 65.7% 58.8%
Mechanisms of homicide
Mechanism ArlingtonMesquite
Homicides from 2000 to 2006 624 1,824
Cut / Pierce 68 117
Firearm 385 1,343
Suffocation 32 36
Mechanisms of homicide per 1,000,000 residents
Mechanism ArlingtonMesquite
Homicides from 2000 to 2006 57.4 113.8
Cut / Pierce 6.3 7.3
Firearm 35.4 83.8
Suffocation 2.9 2.2
Mechanisms of suicide per 1,000,000 residents
Mechanism ArlingtonMesquite
Suicides from 2000 to 2006 98.7 91.8
Cut / Pierce 0 1.6
Fall 0 2.6
Firearm 54.9 50.4
Poisoning 14.4 18.7
Suffocation 23.6 15.9

Infrastructure

Arlington boasts considerably more advanced infrastructure compared to Mesquite. Housing facilities, schools, medical facilities, and entertainment spots are well dispersed throughout the city making it more convenient for the residents. Mesquite, while smaller, offers a more compact layout that increases its walkability.
Infrastructure
Type Arlington Mesquite
Hospitals 39 8
TV stations 25 25
Bank branches located here 74 27
Bank institutions located here 23 13

Schools

School facilities
Type Arlington Mesquite
Private elementary/middle schools 11 4
Private high schools 10 2
Public elementary/middle schools 81 35
Public high schools 18 7
Colleges/Universities 12 6
HMDA - Conventional home purchase loans - Applications denied
Year ArlingtonMesquite
1999 1,768 810
2000 1,198 286
2001 1,140 190
2002 847 196
2003 1,216 463
2004 1,504 732
2005 2,158 967
2006 2,107 995
2007 1,390 633
2008 558 209
2009 235 81

Culture and Food

Arlington is a cultural hub, featuring many artistic venues, museums, and a buzzing nightlife. It's renowned for its food scene, with restaurants offering a variety of cuisines. Mesquite, though smaller, offers a unique charm with its annual rodeo event and numerous BBQ joints that give a glimpse into Texas' authentic western heritage.

Sports Teams

Arlington is home to several major sports teams, including the Dallas Cowboys NFL team and the Texas Rangers MLB team. While Mesquite does not host any major sports teams, it nevertheless offers its residents a variety of local sports amenities and is just a short drive away from the sports action in Dallas.