Just miles apart, the cities of Anaheim and Orange in California offer distinct experiences to both residents and tourists. Anaheim, famously home to Disneyland, has a larger population and bustling tourism industry, while Orange, with its historic charm, provides a cozier community atmosphere. We delve into aspects such as crime and safety, weather, cost of living, education, and more to provide a comprehensive comparison of the two places.
Distance between
Anaheim, CA and
Orange, CA : 4.0 miles
Anaheim's population is larger by 152%. Its population has grown by 17,926 people (5.5%) since 2000. The population of Orange has grown by 8,443 people (6.6%) during that time.
The crime rate in Anaheim is higher than in Orange. According to NeighborhoodScout, Anaheim's crime rate stands at 35 crimes per one thousand residents. Conversely, Orange, which is statistically safer, registers a crime rate of about 21 crimes per one thousand residents. However, both cities have crime rates that are higher than the national average, suggesting that residents and visitors remain cautious.
City-data.com crime index counts serious crimes and violent crime more heavily. It adjusts for the number of visitors and daily workers commuting into cities. (higher means more crime, U.S. average = 301.1)
City-data.com crime index counts serious crimes and violent crime more heavily. It adjusts for the number of visitors and daily workers commuting into cities. (higher means more crime, U.S. average = 301.1)
Sex Offenders
According to our data, there are 389 registered sex offenders living in Anaheim and 123 registered sex offenders living in . The ratio of residents to sex offenders in Anaheim is 902 to 1; the ratio in Orange is 1,142 to 1. The number of registered sex offenders compared to the number of residents is larger in Anaheim than in Orange.
Cost of Living
Cost of living in both cities is high compared to the U.S. average, which reflects California's general cost of living. According to the cost of living calculator on NerdWallet, Anaheim's cost of living is substantially higher than Orange's, particularly in housing and entertainment. However, healthcare costs are slightly lower in Anaheim than in Orange.
Income Tax
Just like sales tax, income tax doesn't differ considerably between the two cities. California adopts a progressive income tax, rates ranging from 1% to 13.3% based on income level. Anaheim and Orange, being in the same state, are subject to the same taxing norms.
Property Tax
Anaheim and Orange have similar average property tax rates, about 0.79% of a property's assessed fair market value, reflecting the average rate for Orange County. However, with higher property values in Anaheim, homeowners there may pay more property tax in dollar terms.
Sales Tax
The total sales tax rate in both cities is 7.75%, which comprises the California state sales tax rate of 6%. It's worth noting that the sales tax does not significantly differentiate between Anaheim and Orange.
Income
Type
Anaheim
Orange
Estimated median household income
$81,747
$103,045
Estimated per capita income
$32,827
$41,925
Cost of living index (U.S. average is 100)
88.5
88.6
If you make $50,000 in Anaheim, you will have to make $50,056 in Orange to maintain the same standard of living.
Geographical Conditions
Geographically, both cities are similar with flat plains and hilly areas, surrounded by beautiful Southern California landscapes. Anaheim offers more parks and recreational areas due to its size, while Orange is well-regarded for its preserved natural spaces like the Peters Canyon Regional Park.
Both cities have reputable schools catering to different education levels. Anaheim has more schools due to its larger population size, including the esteemed Anaheim Union High School District and North Orange County Community College District. Orange, on the other hand, is home to the acclaimed Chapman University and has a superior pupil to teacher ratio than Anaheim.
Anaheim has a diverse economy with a robust tourism sector influenced by Disneyland Resort and the Anaheim Convention Center, which welcomes millions of visitors annually. Additionally, it has significant manufacturing, retail trade, and healthcare sectors. Orange, smaller and less tourist-centric, has a more localized economy with a focus on healthcare, education, and professional services.
Biggest Employers
In Anaheim, the biggest employers are Disneyland Resort, Kaiser Foundation Hospital, and Northgate Gonzalez Markets. Conversely, in Orange, St. Joseph Hospital and Chapman University are the largest employers, offering opportunities particularly in healthcare and education fields.
There were 85 building permits issued in Anaheim in 2012 (44 more than in 2011) compared to 79 building permits issued in Orange in 2012 (74 more than in 2011).
Weather
Anaheim and Orange share virtually identical weather due to their geographic proximity. They enjoy a Mediterranean climate with cool, wet winters and warm, dry summers. The average temperature ranges from 60-75°F. Residents and visitors can appreciate an ample amount of sunshine throughout the year, roughly about 280 days annually.
Weather and climate
Type
Anaheim
Orange
Temperature - Average
64.9°F
65°F
Humidity - Average morning or afternoon humidity
69.6%
69.5%
Humidity - Differences between morning and afternoon humidity
25.9%
25.6%
Humidity - Maximum monthly morning or afternoon humidity
77.9%
77.7%
Humidity - Minimum monthly morning or afternoon humidity
52%
52%
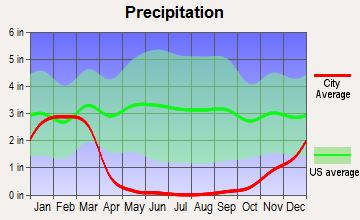
Precipitation - Yearly average
12 in
11.9 in
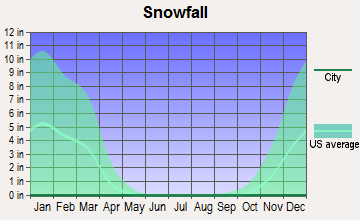
Snowfall - Yearly average
0 in
0 in
Clouds - Number of days clear of clouds
26.6%
26.7%
Sunshine amount - Average
78.4%
78.4%
Sunshine amount - Differences during a year
22%
21.9%
Sunshine amount - Maximum monthly
84.9%
84.9%
Sunshine amount - Minimum monthly
63%
62.9%
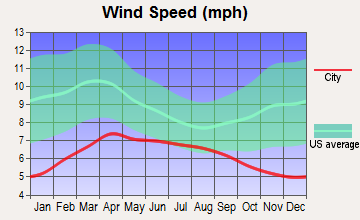
Wind speed - Average
5.7 mph
5.7 mph
Average climate in Anaheim, California
Average climate in Orange, California
Air pollution
Type
AQI
CO
NO2
OZONE
PB
PM10
PM25
SO2
Year
Anaheim
Orange
Anaheim
Orange
Anaheim
Orange
Anaheim
Orange
Anaheim
Orange
Anaheim
Orange
Anaheim
Orange
Anaheim
Orange
2018
139
144
0.36
0.34
13.7
14.0
26.8
27.3
0.007
0.007
27.5
29.0
12.1
12.6
0.7
0.7
2017
145
151
0.50
0.39
14.8
14.6
26.7
28.3
0.007
0.007
26.7
29.6
13.5
13.8
0.6
0.5
2016
132
137
0.57
0.40
14.5
14.3
26.3
28.0
0.007
0.007
24.1
26.3
12.9
13.1
0.3
0.3
2015
142
145
0.45
0.36
14.7
14.7
26.0
28.1
0.007
0.007
25.0
27.0
14.8
14.9
0.3
0.3
2014
138
141
0.40
0.33
15.0
15.0
26.7
27.5
0.008
0.008
26.7
29.1
16.2
15.9
0.5
0.4
2013
138
143
0.47
0.38
14.8
15.6
25.3
26.4
0.005
0.005
28.3
30.5
13.9
14.1
0.5
0.4
2012
142
144
0.46
0.39
14.5
15.2
25.0
26.0
0.005
0.005
27.0
29.2
14.7
15.0
0.2
0.2
2011
138
143
0.42
0.37
15.9
16.6
26.7
26.6
0.007
0.007
27.4
29.0
16.0
16.6
0.8
0.7
2010
130
139
0.44
0.40
16.7
16.9
25.8
26.1
0.009
0.009
23.5
25.3
14.9
15.1
0.6
0.6
2009
151
154
0.41
0.39
18.0
18.4
26.0
26.8
0.010
0.009
24.4
25.2
15.4
15.8
1.1
1.1
2008
156
158
0.38
0.41
20.3
20.1
26.7
27.0
0.010
0.010
30.2
30.1
18.9
18.6
1.1
1.1
2007
135
135
0.38
0.42
19.5
20.2
26.2
26.0
0.012
0.012
N/A
N/A
N/A
N/A
0.8
0.8
2006
128
128
0.43
0.46
19.1
20.7
26.3
25.9
0.008
0.008
N/A
N/A
N/A
N/A
1.3
1.3
2005
128
128
0.45
0.47
20.7
21.8
31.3
26.9
0.013
0.013
N/A
N/A
N/A
N/A
1.3
1.3
2004
134
134
0.53
0.55
19.9
22.1
37.1
30.3
0.015
0.014
N/A
N/A
N/A
N/A
1.6
1.6
2003
143
143
0.69
0.68
23.7
25.5
23.8
24.8
0.025
0.025
N/A
N/A
N/A
N/A
1.1
1.1
2002
134
134
0.77
0.72
24.1
25.6
21.8
22.7
0.019
0.019
N/A
N/A
N/A
N/A
2.1
1.9
2001
143
143
0.94
0.85
28.4
27.3
24.5
22.8
0.035
0.035
N/A
N/A
N/A
N/A
1.7
1.6
2000
152
149
0.80
0.83
29.4
29.7
23.0
22.3
0.030
0.030
N/A
N/A
N/A
N/A
1.9
1.9
Natural disasters
Type
Anaheim
Orange
Tornado activity compared to U.S. average
19.3%
19.3%
Earthquake activity compared to U.S. average
7,039.7%
7,026.4%
Natural disasters compared to U.S. average
32%
32%
Transportation
Anaheim has excellent public transport services, thanks to the Anaheim Resort Transportation network serving its busy tourism sector. Not to mention, the Metrolink and Amtrak services that add to the city's connectivity. Orange, though with a smaller network, has efficient public transportation buoyed by OCTA buses and Metrolink train services.
Transport
Type
Anaheim
Orange
Amtrak stations
1
0
Amtrak stations nearby
3
3
FAA registered aircraft
136
72
FAA registered aircraft manufacturers and dealers
3
2
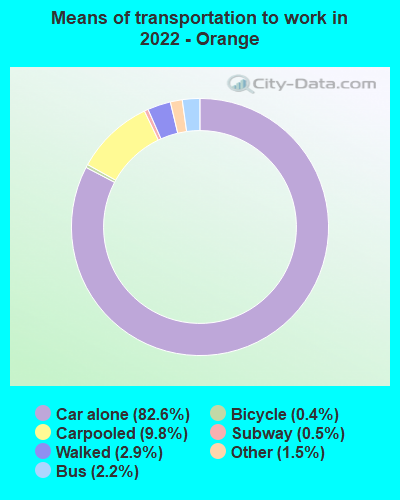
Means of transportation to work
Type
Anaheim
Orange
Bicycle
1%
0.5%
Bus
0.9%
1.2%
Carpooled
10.8%
11.2%
Car alone
83.4%
83%
Motorcycle
0.2%
0.2%
Railroad
0.2%
0.3%
Subway
0.3%
0.3%
Walked
1.6%
2.1%
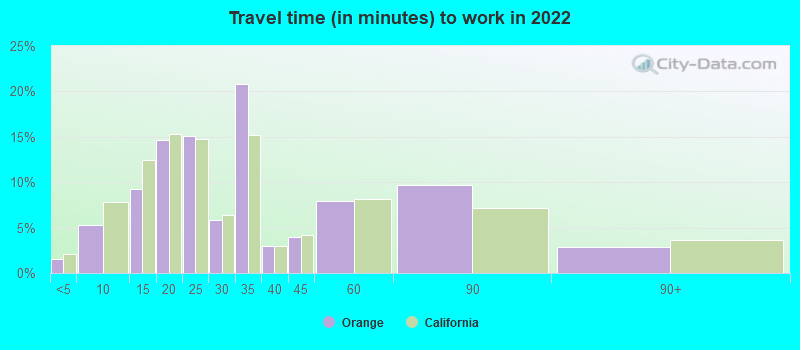
Average travel time to work
Type
Anaheim
Orange
Average
30.8 min
31.3 min
Other means
28.1 min
25.6 min
Public transportation
47.8 min
45.4 min
Private vehicle occupancy
Type
Anaheim
Orange
Average
1.2
1.3
Drove alone
85.3%
85.8%
In 2 person carpool
11.2%
9.2%
In 3 person carpool
1.8%
1.5%
In 4 person carpool
0.8%
2%
In 5-6 person carpool
0.9%
1.6%
How many people usually rode to work in the car, truck or van.
Real Estate
Real estate in both cities is notably expensive, reflecting California's high property values. However, Anaheim's median home value is slightly higher than that of Orange. There is also greater real estate market activity in Anaheim due to its larger population and tourist presence.
Neighborhoods
Anaheim offers a mixture of urban and suburban neighborhoods, home to a diverse range of cultures. Downtown Anaheim and Anaheim Hills provide a rich variety of experience to residents and visitors alike. Orange, offering a small-town feeling, is known for its historic homes in the Old Town District and tranquil communities like Orange Park Acres.
Houses and residents
Type
Anaheim
Orange
Houses
110,319
45,377
Average household size (people)
3.4
3
Median year apartment built
1975
1975
Median year house/condo built
1970
1970
Length of stay in the house since moving in
14.8 years
15.4 years
Houses occupied
105,608 (95.7%)
43,291 (95.4%)
Houses occupied by owners
51,684 (48.9%)
24,222 (56%)
Houses occupied by renters
53,924 (51.1%)
19,069 (44%)
Median rent asked for vacant for-rent units
$2,111
$3,066
Median monthly housing costs
$1,910
$2,103
Median price asked for vacant for-sale houses and condos
$1,256,069
$1,306,159
Estimated median house or condo value
$688,400
$827,200
Median numbers of rooms
4.7
5.3
Median number of rooms in apartments
3.6
4.1
Median number of rooms in houses and condos
6.1
6.3
Median house price - detached houses
$859,592
$943,896
Median house price - in 2-unit structures
$742,035
$539,500
Median house price - in 3-to-4-unit structures
$546,946
Over $1,000,000
Median house price - in 5 or more unit structures
$553,561
$632,238
Median house price - mobile homes
$114,904
$111,668
Median house price - Townhouses or other attached units
$619,623
$661,387
Median house price - All housing units
$782,600
$889,359
Median house age
48
49
Renting percentage
51.5%
39.3%
Housing density (houses/condos per square mile)
2,254.1
1,939.6
House value disparities
20.2%
20.3%
Household income disparities
43.6%
40.6%
Median household income for houses/condes with a mortgage
$125,169
$144,254
Median household income for apartments without a mortgage
$86,779
$87,481
Housing units without a mortgage
374 (1%)
317 (1.8%)
Housing units with both a second mortgage and home equity loan
2,222 (6%)
927 (5.3%)
Housing units with a mortgage
36,875 (99%)
17,033 (98.2%)
Housing units with a home equity loan
0 (0%)
53 (0.3%)
Housing units with a second mortgage
2,794 (7.5%)
1,157 (6.7%)
House/condo owner moved in on average (years ago)
14
14
House/condo renter moved in on average (years ago)
4
4
Housing units lacking complete kitchen facilities
4.5%
3%
Housing units lacking complete plumbing facilities
0.1%
0.6%
Housing units in structures
Housing units in structures
Anaheim
Orange
One, detached
42.7%
55.0%
One, attached
8.3%
8.3%
Two
2.3%
2.1%
3 or 4
7.6%
8.8%
5 to 9
6.8%
3.5%
10 to 19
5.5%
2.1%
20 to 49
6.8%
6.1%
50 or more
17.2%
10.6%
Mobile homes
2.6%
3.4%
Boats, RVs, vans, etc.
0.1%
0.0%
Median real estate property taxes paid for housing units
Self-employed workers in own not incorporated business
11,077
6,160
State government workers
5,046
2,223
Unpaid family workers
65
72
Industries and Occupations
Tourism and entertainment dominate Anaheim with Disneyland being the city's largest employer. There are also considerable opportunities in healthcare, retail, and manufacturing. Orange, while it has fewer job opportunities due to its smaller size, offers significant employment in the healthcare sector, with children's hospital CHOC and St. Joseph Hospital being major employers.
Health diagnosing and treating practitioners and other technical occupations
4.2%
6.1%
Building and grounds cleaning and maintenance occupations
4.2%
3.3%
Health technologists and technicians
3.6%
1.8%
Community and social service occupations
2.2%
2.1%
Material moving occupations
2.0%
1.5%
Computer and mathematical occupations
1.4%
1.7%
Arts, design, entertainment, sports, and media occupations
1.3%
3.7%
Life, physical, and social science occupations
1.3%
1.6%
Legal occupations
0.8%
1.4%
Transportation occupations
0.8%
1.1%
Health Care
Both cities are served by excellent healthcare facilities. Anaheim hosts the Anaheim Regional Medical Center among others, while Orange is renowned for its specialist hospitals like the Children’s Hospital of Orange County and the UCI Medical Center.
Anaheim boasts superior infrastructure with its extensive public facilities, ranging from parks, libraries, to state-of-the-art healthcare institutions, facilitated by bigger budgets from a larger population and tourism revenue. Orange, while it has adequate facilities, is less modernized and boasts a historic downtown area, preserving its Old Town charm.
Infrastructure
Type
Anaheim
Orange
Hospitals
22
9
TV stations
6
4
Bank branches located here
46
30
Bank institutions located here
19
13
Main business address for public companies
7
1
Drinking water stations with no reported violations in the past
1
1
Drinking water stations with reported violations in the past
HMDA - Conventional home purchase loans - Applications denied
Year
Anaheim
Orange
1999
914
451
2000
679
380
2001
632
299
2002
735
300
2003
1,047
478
2004
1,456
589
2005
1,965
645
2006
1,999
769
2007
1,230
561
2008
599
287
2009
378
133
Culture and Food
Anaheim offers a vibrant cultural scene, hosting various festivals and events throughout the year like the famous Disneyland events and Parades. It also boasts a diverse food culture given its multicultural populace. Orange, on the other hand, maintains a robust community-oriented culture, and its food scene offers unique experiences with a range of establishments from craft breweries to historic diners in the Old Town.
Sports Teams
Sport is a big part of Anaheim's culture, the city being home to prominent teams like the MLB's Angels and NHL's Ducks, providing residents and visitors thrilling sports entertainment. Orange, lacking professional sports teams, emphasizes community sports well-supported by its community and schools.


 Anaheim, CA
 Orange, CA