Anaheim, CA, and Moreno Valley, CA, both located in Southern California, offer varying experiences for both residents and visitors. While Anaheim is known for its tourist hub featuring Disneyland Resort, Moreno Valley offers a quieter, more suburban atmosphere. These cities differ significantly in various aspects like crime levels, weather conditions, cost of living, public transit, and many others. In this comparison, we will provide insights into living in and visiting these cities, focusing on key considerations like safety, weather, economic outlook, cultural offerings, and more.
Distance between
Anaheim, CA and
Moreno Valley, CA : 38.4 miles
Anaheim's population is larger by 64%. Its population has grown by 17,926 people (5.5%) since 2000. The population of Moreno Valley has grown by 69,219 people (48.6%) during that time.
Anaheim reports a higher overall crime rate compared to Moreno Valley. However, both cities' rates are above the U.S. national average, enforcing the need for vigilance and care. Specifically, Anaheim's property crime is notably higher, which may affect those looking to reside or invest in the city. Moreno Valley has an overall safer community feel, especially for those wanting to start families.
City-data.com crime index counts serious crimes and violent crime more heavily. It adjusts for the number of visitors and daily workers commuting into cities. (higher means more crime, U.S. average = 301.1)
City-data.com crime index counts serious crimes and violent crime more heavily. It adjusts for the number of visitors and daily workers commuting into cities. (higher means more crime, U.S. average = 301.1)
Sex Offenders
According to our data, there are 389 registered sex offenders living in Anaheim and 325 registered sex offenders living in . The ratio of residents to sex offenders in Anaheim is 902 to 1; the ratio in Moreno Valley is 632 to 1. The number of registered sex offenders compared to the number of residents is a smaller in Anaheim than in Moreno Valley.
Cost of Living
The cost of living in Anaheim is significantly higher than in Moreno Valley. Everything from housing to groceries and healthcare is more expensive in Anaheim. Moreno Valley stands as a more affordable option for those moving into the region, making it popular among families and retirees. Tourists, too, may find their dollars stretch further in Moreno Valley.
Income Tax
Both cities share the same state income tax structure imposed by California; there is no city-level income tax. The actual tax rates will depend on the person's taxable income.
Property Tax
Property tax in both cities is determined by the County Assessor's Office in their respective counties and rises with the value of the property. Considering the higher property values in Anaheim, homeowners here could face higher property taxes.
Sales Tax
Both cities fall under California's jurisdiction, hence have the same state sales tax rate at 7.25%. However, with local taxes, Anaheim sees a slightly higher total sales tax rate compared to Moreno Valley, making everyday shopping potentially pricier.
Income
Type
Anaheim
Moreno Valley
Estimated median household income
$81,747
$79,840
Estimated per capita income
$32,827
$25,319
Cost of living index (U.S. average is 100)
88.5
82.3
If you make $50,000 in Moreno Valley, you will have to make $53,767 in Anaheim to maintain the same standard of living.
Geographical Conditions
Geographically, Anaheim, situated in a plain, is close to the coast and offers coastal amenities like beaches. Moreno Valley, located in Inland Empire, is surrounded by mountains and rolling hills, offering picturesque views and ample outdoor recreational opportunities.
Moreno Valley is served by the Moreno Valley Unified School District, which has several schools listed as California Distinguished Schools. In contrast, Anaheim offers a more diverse educational environment due to its larger size, with several excellent public and private school options and higher educational institutions, including Anaheim University.
Anaheim's economy is stronger with a higher median household income driven by the tourism, entertainment, technology, and healthcare sectors. Major employers include the Walt Disney Company, Anaheim Regional Medical Center, and L3 Technologies. Moreno Valley has a lower median household income, and its economy revolves around the logistics, education, and retail sectors.
Biggest Employers
Disneyland Resort is Anaheim's biggest employer, followed by Kaiser Foundation Hospital. Moreno Valley’s largest employers are the Moreno Valley Unified School District and Riverside County Regional Medical Center.
There were 85 building permits issued in Anaheim in 2012 (44 more than in 2011) compared to 377 building permits issued in Moreno Valley in 2012 (354 more than in 2011).
In Anaheim (Orange County), 45.8% voted for Democrats and 52.0% for Republicans in 2012 Presidential Election. In Moreno Valley (Riverside County), 49.6% voted for Democrats and 48.0% for Republicans.
Elections
Type
Democrats
Republicans
Other
Year
Anaheim
Moreno Valley
Anaheim
Moreno Valley
Anaheim
Moreno Valley
2020
53.6%
53.0%
44.6%
45.0%
1.8%
2.0%
2016
50.9%
49.7%
42.4%
44.4%
6.7%
5.9%
2012
45.8%
49.6%
52.0%
48.0%
2.3%
2.4%
2008
47.8%
50.4%
50.3%
48.1%
1.9%
1.5%
2004
39.3%
41.3%
60.2%
58.2%
0.5%
0.6%
2000
40.4%
45.0%
55.9%
51.6%
3.7%
3.4%
1996
37.9%
43.0%
51.7%
45.6%
10.5%
11.3%
Breakdown of population affiliated with a religious congregation
Type
Adherents
Congregations
Religion
Anaheim
Moreno Valley
Anaheim
Moreno Valley
CATHOLIC CHURCH
26.5%
27.5%
4.4%
4.5%
SOUTHERN BAPTIST CONVENTION
2.3%
1.2%
8.8%
11.2%
MUSLIM ESTIMATE
0.8%
0.5%
1.3%
0.7%
LUTHERAN CHURCH
0.6%
0.3%
2.0%
1.8%
EPISCOPAL CHURCH
0.4%
0.2%
1.4%
1.4%
EVANGELICAL LUTHERAN CHURCH IN AMERICA
0.4%
0.3%
2.3%
1.5%
SEVENTH DAY ADVENTIST CHURCH
0.4%
0.9%
1.3%
3.4%
REFORMED CHURCH IN AMERICA
0.3%
0.3%
0.2%
0.7%
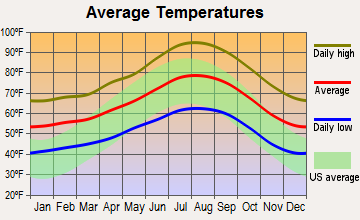
Weather
Both Anaheim and Moreno Valley experience a Mediterranean climate, characterized by warm, dry summers and mild, wet winters. However, Moreno Valley, nestled in the San Bernardino-Riverside Metropolitan Area, sees slightly hotter temperatures in summers. For those preferring milder climates, Anaheim, with its coastal influence due to proximity to the Pacific Ocean, would be a better fit.
Weather and climate
Type
Anaheim
Moreno Valley
Temperature - Average
64.9°F
65.1°F
Humidity - Average morning or afternoon humidity
69.6%
66.7%
Humidity - Differences between morning and afternoon humidity
25.9%
21.1%
Humidity - Maximum monthly morning or afternoon humidity
77.9%
73.3%
Humidity - Minimum monthly morning or afternoon humidity
52%
52.3%
Precipitation - Yearly average
12 in
11.6 in
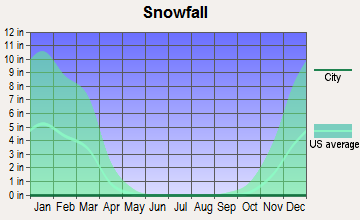
Snowfall - Yearly average
0 in
0 in
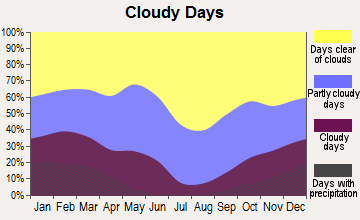
Clouds - Number of days clear of clouds
26.6%
27.3%
Sunshine amount - Average
78.4%
78%
Sunshine amount - Differences during a year
22%
20.8%
Sunshine amount - Maximum monthly
84.9%
83%
Sunshine amount - Minimum monthly
63%
62.2%
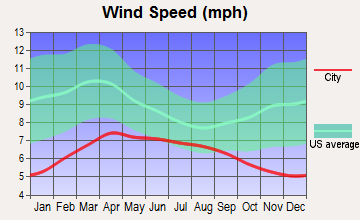
Wind speed - Average
5.7 mph
4.5 mph
Average climate in Anaheim, California
Average climate in Moreno Valley, California
Air pollution
Type
AQI
CO
NO2
OZONE
PB
PM10
PM25
SO2
Year
Anaheim
Moreno Valley
Anaheim
Moreno Valley
Anaheim
Moreno Valley
Anaheim
Moreno Valley
Anaheim
Moreno Valley
Anaheim
Moreno Valley
Anaheim
Moreno Valley
Anaheim
Moreno Valley
2018
139
154
0.36
0.33
13.7
12.3
26.8
33.4
0.007
0.006
27.5
35.0
12.1
11.6
0.7
0.4
2017
145
145
0.50
0.34
14.8
12.2
26.7
35.1
0.007
0.004
26.7
37.6
13.5
13.2
0.6
0.3
2016
132
143
0.57
0.34
14.5
12.4
26.3
33.4
0.007
0.006
24.1
36.8
12.9
12.9
0.3
0.3
2015
142
145
0.45
0.32
14.7
12.2
26.0
33.2
0.007
0.004
25.0
34.7
14.8
13.7
0.3
0.3
2014
138
146
0.40
0.35
15.0
14.4
26.7
33.1
0.008
0.006
26.7
37.2
16.2
15.6
0.5
0.3
2013
138
150
0.47
0.35
14.8
14.7
25.3
32.7
0.005
0.006
28.3
35.7
13.9
14.4
0.5
0.3
2012
142
145
0.46
0.33
14.5
15.2
25.0
32.6
0.005
0.007
27.0
34.4
14.7
15.2
0.2
0.3
2011
138
149
0.42
0.34
15.9
15.3
26.7
33.0
0.007
0.006
27.4
34.4
16.0
16.6
0.8
0.4
2010
130
146
0.44
0.37
16.7
16.4
25.8
32.5
0.009
0.008
23.5
31.5
14.9
15.8
0.6
1.2
2009
151
151
0.41
0.34
18.0
17.8
26.0
32.1
0.010
0.010
24.4
35.0
15.4
17.0
1.1
1.4
2008
156
156
0.38
0.38
20.3
18.1
26.7
32.6
0.010
0.011
30.2
41.2
18.9
15.7
1.1
1.1
2007
135
127
0.38
0.55
19.5
19.0
26.2
31.3
0.012
0.013
N/A
N/A
N/A
N/A
0.8
1.6
2006
128
129
0.43
0.51
19.1
19.7
26.3
30.6
0.008
0.007
N/A
N/A
N/A
N/A
1.3
1.5
2005
128
131
0.45
0.50
20.7
21.1
31.3
27.5
0.013
0.012
N/A
N/A
N/A
N/A
1.3
3.0
2004
134
140
0.53
0.63
19.9
18.1
37.1
31.3
0.015
0.013
N/A
N/A
N/A
N/A
1.6
2.7
2003
143
144
0.69
0.78
23.7
21.7
23.8
31.9
0.025
0.021
N/A
N/A
N/A
N/A
1.1
1.8
2002
134
142
0.77
0.79
24.1
22.9
21.8
31.3
0.019
0.016
N/A
N/A
N/A
N/A
2.1
0.4
2001
143
147
0.94
0.79
28.4
24.2
24.5
30.8
0.035
0.039
N/A
N/A
N/A
N/A
1.7
1.0
2000
152
157
0.80
0.83
29.4
23.4
23.0
28.2
0.030
0.034
N/A
N/A
N/A
N/A
1.9
1.4
Natural disasters
Type
Anaheim
Moreno Valley
Tornado activity compared to U.S. average
19.3%
16.4%
Earthquake activity compared to U.S. average
7,039.7%
7,327.3%
Natural disasters compared to U.S. average
32%
46%
Transportation
Anaheim has a robust transportation network. The Anaheim Resort Transport (ART) runs extensive bus networks, and Metrolink provides regional train services. The leading option in Moreno Valley is the Riverside Transit Agency. Overall, Anaheim provides better commuting options to residents and tourists.
Transport
Type
Anaheim
Moreno Valley
Amtrak stations
1
1
Amtrak stations nearby
3
3
FAA registered aircraft
136
27
FAA registered aircraft manufacturers and dealers
3
2
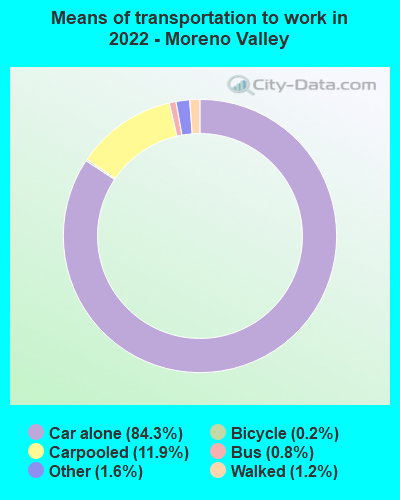
Means of transportation to work
Type
Anaheim
Moreno Valley
Bicycle
1%
0.1%
Bus
0.9%
1.2%
Carpooled
10.8%
11.2%
Car alone
83.4%
84.7%
Motorcycle
0.2%
0.3%
Railroad
0.2%
0%
Streetcar
0.1%
0.1%
Subway
0.3%
0%
Walked
1.6%
1.2%
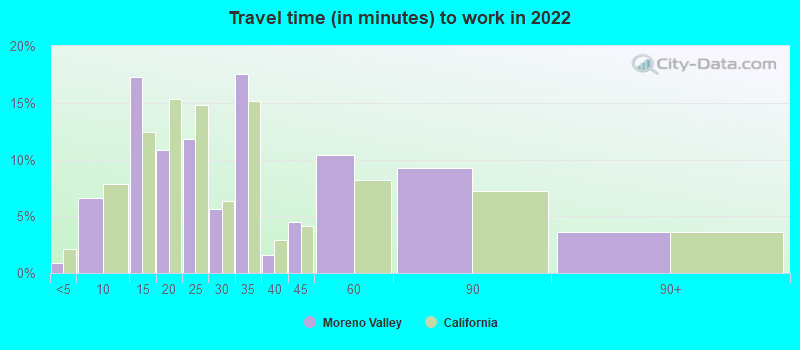
Average travel time to work
Type
Anaheim
Moreno Valley
Average
30.8 min
29.1 min
Other means
28.1 min
34.1 min
Public transportation
47.8 min
55.2 min
Private vehicle occupancy
Type
Anaheim
Moreno Valley
Average
1.2
1.2
Drove alone
85.3%
84.3%
In 2 person carpool
11.2%
12.3%
In 3 person carpool
1.8%
2.7%
In 4 person carpool
0.8%
0.4%
In 5-6 person carpool
0.9%
0.1%
In 7+ person carpool
0%
0.2%
How many people usually rode to work in the car, truck or van.
Real Estate
The real estate market in Anaheim is considerably more expensive than in Moreno Valley. Both the median home prices and rents are higher in Anaheim, making home ownership more challenging. Moreno Valley, in contrast, offers more affordable housing options.
Neighborhoods
Anaheim boasts diverse neighborhoods each with its unique personality, ranging from the bustling Disneyland area to more peaceful regions. Moreno Valley, though limited in variety, offers notable suburban neighborhoods ideal for families and retirees.
Houses and residents
Type
Anaheim
Moreno Valley
Houses
110,319
55,128
Average household size (people)
3.4
3.7
Median year apartment built
1975
1990
Median year house/condo built
1970
1987
Length of stay in the house since moving in
14.8 years
13.4 years
Houses occupied
105,608 (95.7%)
54,104 (98.1%)
Houses occupied by owners
51,684 (48.9%)
33,152 (61.3%)
Houses occupied by renters
53,924 (51.1%)
20,952 (38.7%)
Median rent asked for vacant for-rent units
$2,111
$1,620
Median monthly housing costs
$1,910
$1,773
Median price asked for vacant for-sale houses and condos
$1,256,069
$478,171
Estimated median house or condo value
$688,400
$422,500
Median numbers of rooms
4.7
5.9
Median number of rooms in apartments
3.6
4.9
Median number of rooms in houses and condos
6.1
6.3
Median house price - detached houses
$859,592
$408,231
Median house price - in 2-unit structures
$742,035
Over $1,000,000
Median house price - in 3-to-4-unit structures
$546,946
$287,962
Median house price - in 5 or more unit structures
$553,561
$227,600
Median house price - mobile homes
$114,904
$77,425
Median house price - Townhouses or other attached units
$619,623
$416,724
Median house price - All housing units
$782,600
$396,904
Median house age
48
33
Renting percentage
51.5%
35.3%
Housing density (houses/condos per square mile)
2,254.1
1,076.1
House value disparities
20.2%
18.2%
Household income disparities
43.6%
37.8%
Median household income for houses/condes with a mortgage
$125,169
$96,852
Median household income for apartments without a mortgage
$86,779
$72,290
Housing units without a mortgage
374 (1%)
207 (0.8%)
Housing units with both a second mortgage and home equity loan
2,222 (6%)
1,146 (4.3%)
Housing units with a mortgage
36,875 (99%)
26,147 (99.2%)
Housing units with a home equity loan
0 (0%)
24 (0.1%)
Housing units with a second mortgage
2,794 (7.5%)
1,290 (4.9%)
House/condo owner moved in on average (years ago)
14
13
House/condo renter moved in on average (years ago)
4
4
Housing units lacking complete kitchen facilities
4.5%
1.7%
Housing units lacking complete plumbing facilities
0.1%
0.1%
Housing units in structures
Housing units in structures
Anaheim
Moreno Valley
One, detached
42.7%
79.5%
One, attached
8.3%
2.4%
Two
2.3%
0.7%
3 or 4
7.6%
2.2%
5 to 9
6.8%
5.6%
10 to 19
5.5%
2.7%
20 to 49
6.8%
1.5%
50 or more
17.2%
3.3%
Mobile homes
2.6%
1.9%
Boats, RVs, vans, etc.
0.1%
0.0%
Median real estate property taxes paid for housing units
Self-employed workers in own not incorporated business
11,077
4,730
State government workers
5,046
1,746
Unpaid family workers
65
181
Industries and Occupations
Anaheim is home to popular amusement parks and hospitality, making these the city's leading industries. Additionally, health services and retail trade also play a notable role in the city's labor market. Moreno Valley's primary industries are logistics, education, and health service, recently experiencing growth in the logistics industry due to its strategic position amidst major highways.
Both cities have quality healthcare facilities. Anaheim's healthcare ecosystem is bigger, boasting large hospitals like the Anaheim Regional Medical Center. Moreno Valley has reliable healthcare options like the Riverside County Regional Medical Center but has fewer choices compared to Anaheim.
Health (county statistics)
Type
Anaheim
Moreno Valley
General health status score of residents in this county from 1 (poor) to 5 (excellent)
In terms of infrastructure, Anaheim offers more developments due to its larger population and status as a commercial hub. It has a larger number of public facilities, libraries, parks, and entertainment centers. Moreno Valley, smaller by comparison, provides suburban comfort but fewer amenities.
Infrastructure
Type
Anaheim
Moreno Valley
Hospitals
22
8
TV stations
6
5
Bank branches located here
46
15
Bank institutions located here
19
7
Drinking water stations with no reported violations in the past
1
1
Drinking water stations with reported violations in the past
HMDA - Conventional home purchase loans - Applications denied
Year
Anaheim
Moreno Valley
1999
914
253
2000
679
0
2001
632
0
2002
735
0
2003
1,047
1,150
2004
1,456
1,936
2005
1,965
2,705
2006
1,999
2,993
2007
1,230
1,542
2008
599
599
2009
378
269
Culture and Food
Culturally, Anaheim is richer due to its larger and more diverse population and tourist influx. It features a vibrant food scene with world cuisines. The food culture in Moreno Valley is homelier, with a good mix of fast food, casual dining, and a few upscale options. Both cities reflect California's overall progressive and fusion-influenced food culture.
Sports Teams
Anaheim is home to the Anaheim Ducks (NHL) and the Los Angeles Angels (MLB), offering a vibrant sports culture. Moreno Valley, without professional sports teams, doesn’t offer the same level of sporting action, but residents can follow teams from the broader Riverside County area.


 Anaheim, CA
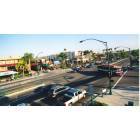
 Moreno Valley, CA