Anaheim, known for being home to Disneyland and the Anaheim Ducks hockey team, is a large and lively city with a variety of opportunities for education, entertainment, and employment. El Toro, on the other hand, a neighborhood known for tranquility and higher cost of living, offers a more peaceful, suburban lifestyle. However, both provide unique and distinct experiences, whether you're relocating or just visiting.
As with any larger city, Anaheim sees a higher crime rate than El Toro. However, Anaheim Police Department is proactive in ensuring safety by frequently interacting with community members and having a visible presence. Smaller in population, El Toro perceives less crime, making it seem safer overall, though it's essential to remember that crime can happen anywhere.
Cost of Living
Anaheim, being a larger city with a variety of housing options, has varied living costs. However, El Toro, with a dominant suburban feel, sees an overall higher cost of living due to the larger residential properties and perceived safety of the neighborhood.
Income Tax
As both cities are in California, they also share the same progressive state income tax, with rates ranging from 1% up to 13.3% depending on income level.
Property Tax
The property tax in both cities also follows the California state average, which is 0.813%, but overall property tax bills in El Toro are likely to be higher due to the greater median home value compared to Anaheim.
Sales Tax
Anaheim and El Toro both fall within the state of California, so they share the same state sales tax of 7.25%. However, Anaheim has a higher total sales tax rate due to additional city and county sales taxes.
Income
Type
Anaheim
El Toro
Estimated median household income
$81,747
$132,724
Estimated per capita income
$32,827
$60,371
Cost of living index (U.S. average is 100)
88.5
95
If you make $50,000 in Anaheim, you will have to make $53,672 in El Toro to maintain the same standard of living.
Geographical Conditions
Anaheim is primarily flat, making it suitable for walking and biking. El Toro, on the other hand, has a more varied terrain with rolling hills, enhancing its suburban appeal.
Geographical information
Type
Anaheim
El Toro
Land area
48.9 sq. miles
74.2 sq. miles
Population density
7,068.3 people per sq. mile
2,412 people per sq. mile
Elevation
160 feet
520 feet
Relative area comparison
Anaheim, CA El Toro, CA
Education
Anaheim has a multitude of educational opportunities, with numerous public and private schools, and it's also home to higher education institutions like Anaheim University. El Toro also has quality education, though there are fewer options due to its smaller size.
Anaheim has a diversified economy with a strong tourism sector due to Disneyland and the convention center. El Toro's economy is more residential-focused with a higher proportion of people commuting out of the city for work.
Biggest Employers
In Anaheim, the biggest employers are Disneyland Resort and the Anaheim Regional Medical Center. El Toro's jobs mainly revolve around the service industry with major employers being Saddleback Church and Walmart.
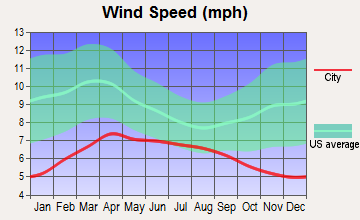
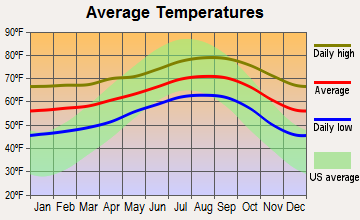
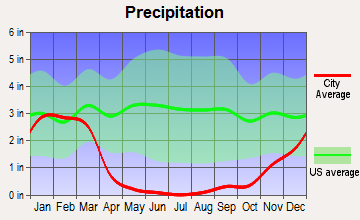
Weather
Both cities experience typically sunny Southern California weather. Anaheim, being further inland, gets warmer in the summers while El Toro, being close to the coast, has more moderate and consistent temperatures throughout the year. Both cities get minimal rainfall, making them great for outdoor activities year-round.
Weather and climate
Type
Anaheim
El Toro
Temperature - Average
64.9°F
63.3°F
Humidity - Average morning or afternoon humidity
69.6%
68.9%
Humidity - Differences between morning and afternoon humidity
25.9%
24.8%
Humidity - Maximum monthly morning or afternoon humidity
77.9%
76.8%
Humidity - Minimum monthly morning or afternoon humidity
52%
52.1%
Precipitation - Yearly average
12 in
13.1 in
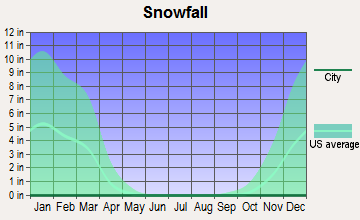
Snowfall - Yearly average
0 in
0 in
Clouds - Number of days clear of clouds
26.6%
26.7%
Sunshine amount - Average
78.4%
78.2%
Sunshine amount - Differences during a year
22%
21.7%
Sunshine amount - Maximum monthly
84.9%
84.3%
Sunshine amount - Minimum monthly
63%
62.6%
Wind speed - Average
5.7 mph
5.4 mph
Average climate in Anaheim, California
Average climate in El Toro, California
Air pollution
Type
AQI
CO
NO2
OZONE
PB
PM10
PM25
SO2
Year
Anaheim
El Toro
Anaheim
El Toro
Anaheim
El Toro
Anaheim
El Toro
Anaheim
Anaheim
El Toro
Anaheim
El Toro
Anaheim
El Toro
2018
139
121
0.36
0.23
13.7
12.5
26.8
32.7
0.007
N/A
27.5
25.4
12.1
10.7
0.7
N/A
2017
145
123
0.50
0.25
14.8
12.3
26.7
33.4
0.007
N/A
26.7
25.7
13.5
12.9
0.6
N/A
2016
132
112
0.57
0.19
14.5
11.7
26.3
32.6
0.007
N/A
24.1
23.5
12.9
12.0
0.3
0.1
2015
142
123
0.45
0.16
14.7
12.4
26.0
31.8
0.007
N/A
25.0
23.5
14.8
13.7
0.3
0.1
2014
138
109
0.40
0.15
15.0
12.2
26.7
30.6
0.008
N/A
26.7
26.3
16.2
15.0
0.5
0.3
2013
138
110
0.47
0.21
14.8
12.7
25.3
29.2
0.005
N/A
28.3
27.2
13.9
12.9
0.5
0.2
2012
142
114
0.46
0.28
14.5
12.1
25.0
28.9
0.005
N/A
27.0
25.5
14.7
13.6
0.2
0.1
2011
138
129
0.42
0.19
15.9
13.3
26.7
29.5
0.007
N/A
27.4
26.5
16.0
14.5
0.8
0.3
2010
130
114
0.44
0.25
16.7
13.1
25.8
29.7
0.009
N/A
23.5
23.6
14.9
14.0
0.6
0.6
2009
151
134
0.41
0.20
18.0
15.2
26.0
30.4
0.010
N/A
24.4
25.2
15.4
14.6
1.1
1.1
2008
156
142
0.38
0.29
20.3
15.9
26.7
30.8
0.010
N/A
30.2
33.3
18.9
14.5
1.1
1.1
2007
135
116
0.38
0.27
19.5
16.0
26.2
29.7
0.012
N/A
N/A
N/A
N/A
N/A
0.8
0.8
2006
128
115
0.43
0.33
19.1
16.8
26.3
29.6
0.008
N/A
N/A
N/A
N/A
N/A
1.3
1.3
2005
128
113
0.45
0.31
20.7
16.9
31.3
29.4
0.013
N/A
N/A
N/A
N/A
N/A
1.3
1.3
2004
134
134
0.53
0.35
19.9
17.9
37.1
32.3
0.015
N/A
N/A
N/A
N/A
N/A
1.6
1.6
2003
143
133
0.69
0.44
23.7
20.9
23.8
30.2
0.025
N/A
N/A
N/A
N/A
N/A
1.1
1.1
2002
134
130
0.77
0.46
24.1
20.3
21.8
27.1
0.019
N/A
N/A
N/A
N/A
N/A
2.1
1.6
2001
143
140
0.94
0.57
28.4
20.5
24.5
27.0
0.035
N/A
N/A
N/A
N/A
N/A
1.7
1.4
2000
152
140
0.80
0.48
29.4
23.3
23.0
23.1
0.030
N/A
N/A
N/A
N/A
N/A
1.9
1.9
Natural disasters
Type
Anaheim
El Toro
Tornado activity compared to U.S. average
19.3%
18.6%
Earthquake activity compared to U.S. average
7,039.7%
6,916.9%
Natural disasters compared to U.S. average
32%
32%
Transportation
Anaheim has a wider range of public transportation options, including trains, buses, and shuttles, due to its tourism industry. El Toro primarily relies on cars for transportation, with average commuting times being higher due to longer distances to major employment centers.
Transport
Type
Anaheim
El Toro
Amtrak stations
1
0
Amtrak stations nearby
3
3
FAA registered aircraft
136
0
FAA registered aircraft manufacturers and dealers
3
0
Means of transportation to work
Type
Anaheim
El Toro
Bicycle
1%
0.3%
Bus
0.9%
0.5%
Carpooled
10.8%
9.7%
Car alone
83.4%
83.4%
Motorcycle
0.2%
0.2%
Railroad
0.2%
0.2%
Subway
0.3%
0%
Walked
1.6%
0.6%
Average travel time to work
Type
Anaheim
El Toro
Average
30.8 min
25.6 min
Real Estate
Anaheim's real estate market is dynamic with various types ranging from apartments to single-family homes. El Toro's real estate market is more stable and expensive, featuring predominantly single-family homes.
Neighborhoods
Anaheim offers a wide range of neighborhoods, from bustling downtown areas to quiet, family-centric suburbs. El Toro primarily consists of quiet, suburban neighborhoods.
Houses and residents
Type
Anaheim
El Toro
Houses
110,319
65,041
Average household size (people)
3.4
2.8
Houses occupied
105,608 (95.7%)
61,855 (95.1%)
Houses occupied by owners
51,684 (48.9%)
42,038 (68%)
Houses occupied by renters
53,924 (51.1%)
19,817 (32%)
Median rent asked for vacant for-rent units
$2,111
$3,113
Median price asked for vacant for-sale houses and condos
$1,256,069
$1,099,558
Estimated median house or condo value
$688,400
$956,652
Median number of rooms in apartments
3.6
3.9
Median number of rooms in houses and condos
6.1
6.1
Housing density (houses/condos per square mile)
2,254.1
876.6
Household income disparities
43.6%
35%
Housing units without a mortgage
374 (1%)
2,867 (7.8%)
Housing units with both a second mortgage and home equity loan
2,222 (6%)
154 (0.4%)
Housing units with a mortgage
36,875 (99%)
33,957 (92.2%)
Housing units with a home equity loan
0 (0%)
3,730 (10.1%)
Housing units with a second mortgage
2,794 (7.5%)
4,895 (13.3%)
Housing units lacking complete kitchen facilities
4.5%
0.3%
Housing units lacking complete plumbing facilities
Self-employed workers in own not incorporated business
11,077
7,511
State government workers
5,046
2,809
Unpaid family workers
65
330
Industries and Occupations
In Anaheim, tourism, entertainment, and retail industries reign. Conversely, El Toro sees a higher prevalence of service industries and occupations, including health care and education.
Health Care
Anaheim has numerous healthcare facilities, including the large Anaheim Regional Medical Center. In contrast, El Toro residents often travel to nearby cities for more comprehensive healthcare services.
Anaheim has a more developed infrastructure due to its larger size and tourism importance, which includes well-maintained roads, public facilities, and parks. El Toro, being smaller, has a less extensive infrastructure but maintains a high standard for its neighborhoods.
Infrastructure
Type
Anaheim
El Toro
TV stations
6
2
Bank branches located here
46
4
Bank institutions located here
19
3
Nuclear power plants nearby
0
2
Culture and Food
Anaheim offers a diverse food culture with a wide array of dining options due to its large population and tourism industry. El Toro has a more limited but high-quality selection of restaurants and cafes, reflective of its smaller, community-oriented population.
Sports Teams
Anaheim is home to both the Anaheim Ducks NHL team and the Los Angeles Angels MLB team, making it a vibrant sports city. El Toro doesn't host any major sports teams but enjoys proximity to Anaheim's sports venues.
 Anaheim, CA
 El Toro, CA