Albuquerque, New Mexico, and Kansas City, Missouri are two renowned cities in the United States, each offering unique lifestyles and opportunities. While Albuquerque is known for its stunning desert landscapes, vibrant culture, and active outdoor life, Kansas City boasts a diverse industrial base, rich history, and a vibrant arts scene. This comparison provides insights into critical aspects of living in both cities, from crime and safety to healthcare, to help potential residents and tourists make an informed choice.
Distance between
Albuquerque, NM and
Kansas City, MO : 717.9 miles
Albuquerque's population is larger by 11%. Its population has grown by 113,992 people (25.4%) since 2000. The population of Kansas City has grown by 66,849 people (15.1%) during that time.
When researching about crime, Albuquerque has a higher crime rate compared to the national average, including both property and violent crimes. Kansas City's crime rate is also above the national average. Both cities are actively working on reducing crime rates, but prospective residents and tourists should remain informed about neighborhoods and safety precautions.
City-data.com crime index counts serious crimes and violent crime more heavily. It adjusts for the number of visitors and daily workers commuting into cities. (higher means more crime, U.S. average = 301.1)
City-data.com crime index counts serious crimes and violent crime more heavily. It adjusts for the number of visitors and daily workers commuting into cities. (higher means more crime, U.S. average = 301.1)
Sex Offenders
According to our data, there are 886 registered sex offenders living in Albuquerque and 1,820 registered sex offenders living in . The ratio of residents to sex offenders in Albuquerque is 631 to 1; the ratio in Kansas City is 264 to 1. The number of registered sex offenders compared to the number of residents is a smaller in Albuquerque than in Kansas City.
Cost of Living
In terms of cost of living, Albuquerque is generally less expensive than Kansas City. However, both of these cities have a lower cost of living compared to the US average, making them affordable options for settling. The cost differences are most prevalent in housing and health costs.
Income Tax
Missouri imposes income tax with different tax brackets, whilst New Mexico has a lower income tax rate compared to Missouri, making Albuquerque potentially more tax-friendly for earners.
Property Tax
As for the property tax, Kansas City has a higher property tax rate than Albuquerque - a crucial factor to consider when buying property.
Sales Tax
Kansas City residents pay a higher combined state and city sales tax compared to residents in Albuquerque. This difference can make some goods and services relatively more costly in Kansas City.
Income
Type
Albuquerque
Kansas City
Estimated median household income
$58,512
$63,396
Estimated per capita income
$35,738
$36,456
Cost of living index (U.S. average is 100)
93.6
87.3
If you make $50,000 in Kansas City, you will have to make $53,608 in Albuquerque to maintain the same standard of living.
Geographical Conditions
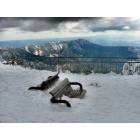
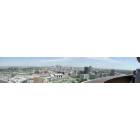
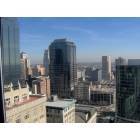
Albuquerque is located in the desert, ensconced by mesmerizing landscapes and magnificent mountains, making it ideal for outdoor enthusiasts. Kansas City, located near the convergence of the Kansas and Missouri Rivers, offers varied terrain with lush green spaces.
Residents benefit from various educational opportunities in both cities. Albuquerque hosts the University of New Mexico and a handful of other universities. Kansas City is home to several higher education institutions, including the University of Missouri-Kansas City and Kansas City Art Institute. Public and private schools in both cities display varying performance levels, necessitating research for families with school-age children.
Kansas City boasts a diverse economy with sectors such as finance, health care, IT, and manufacturing. Albuquerque's economy also has variety, with growing sectors in tech, film, and green energy. Overall, Kansas City has displayed stronger job growth, but both cities provide numerous opportunities depending on your profession.
Biggest Employers
Albuquerque's biggest employers are predominantly in education, healthcare, and the government sector. The same sectors apply in Kansas City as it hosts several big corporations in these industries.
In Albuquerque (Bernalillo County), 55.8% voted for Democrats and 39.4% for Republicans in 2012 Presidential Election. In Kansas City (Jackson County), 58.9% voted for Democrats and 39.3% for Republicans.
Elections
Type
Democrats
Republicans
Other
Year
Albuquerque
Kansas City
Albuquerque
Kansas City
Albuquerque
Kansas City
2020
61.3%
60.1%
36.7%
38.1%
2.0%
1.8%
2016
52.4%
55.5%
34.6%
38.1%
13.0%
6.4%
2012
55.8%
58.9%
39.4%
39.3%
4.9%
1.7%
2008
60.2%
62.1%
38.8%
36.8%
1.0%
1.1%
2004
51.6%
58.2%
47.4%
41.4%
0.9%
0.4%
2000
48.8%
59.0%
46.8%
38.4%
4.4%
2.5%
1996
48.3%
56.2%
43.2%
34.3%
8.5%
9.5%
Breakdown of population affiliated with a religious congregation
Type
Adherents
Congregations
Religion
Albuquerque
Kansas City
Albuquerque
Kansas City
CATHOLIC CHURCH
26.5%
10.3%
10.7%
6.4%
SOUTHERN BAPTIST CONVENTION
2.6%
9.5%
11.4%
13.7%
EPISCOPAL CHURCH
0.7%
0.8%
1.9%
1.7%
CUMBERLAND PRESBYTERIAN CHURCH
0.4%
0.0%
0.2%
0.1%
EVANGELICAL LUTHERAN CHURCH IN AMERICA
0.4%
0.2%
1.9%
1.0%
SEVENTH DAY ADVENTIST CHURCH
0.4%
0.5%
1.9%
1.0%
LUTHERAN CHURCH
0.3%
1.4%
1.7%
1.8%
MUSLIM ESTIMATE
0.3%
0.4%
0.5%
1.1%
AMERICAN BAPTIST CHURCHES IN THE USA
0.1%
0.3%
0.5%
1.4%
SALVATION ARMY
0.1%
0.4%
0.5%
0.6%
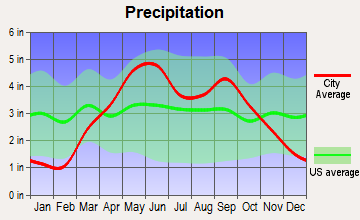
Weather
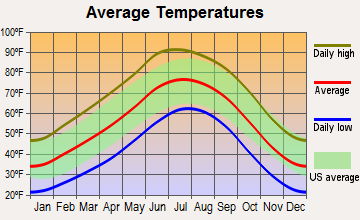
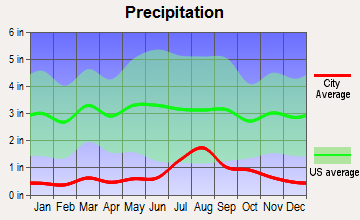
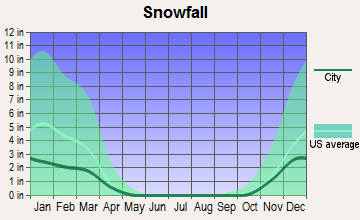
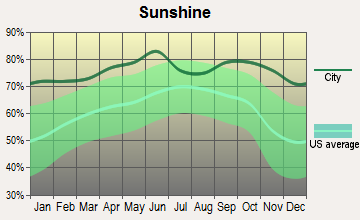
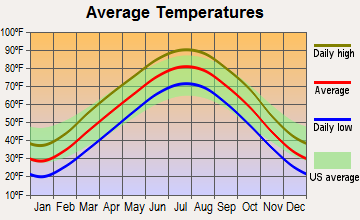
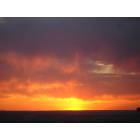
Albuquerque offers a desert climate, with hot summers, mild winters, and lots of sunshine, ideal for outdoor activities. Kansas City experiences a humid continental climate, with hot and humid summers and cold winters. Kansas City also experiences more rainfall than Albuquerque, which might appeal to those who prefer a greener environment.
Weather and climate
Type
Albuquerque
Kansas City
Temperature - Average
55.6°F
56.2°F
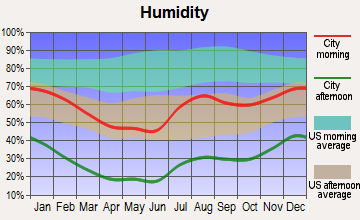
Humidity - Average morning or afternoon humidity
44.3%
76.3%
Humidity - Differences between morning and afternoon humidity
46%
30.1%
Humidity - Maximum monthly morning or afternoon humidity
63%
86%
Humidity - Minimum monthly morning or afternoon humidity
17%
56%
Precipitation - Yearly average
9.4 in
36.3 in
Snowfall - Yearly average
19.2 in
38 in
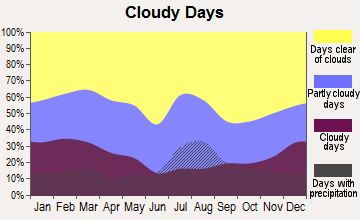
Clouds - Number of days clear of clouds
27.8%
20.1%
Sunshine amount - Average
82.7%
67.3%
Sunshine amount - Differences during a year
9%
25.9%
Sunshine amount - Maximum monthly
82%
74%
Sunshine amount - Minimum monthly
73%
48%
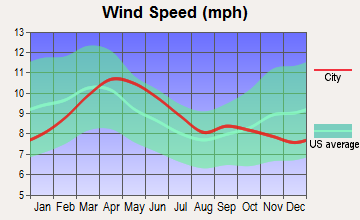
Wind speed - Average
8.9 mph
11.2 mph
Average climate in Albuquerque, New Mexico
Average climate in Kansas City, Missouri
Air pollution
Type
AQI
CO
NO2
OZONE
PB
PM10
PM25
SO2
Year
Albuquerque
Kansas City
Albuquerque
Kansas City
Albuquerque
Kansas City
Albuquerque
Kansas City
Albuquerque
Albuquerque
Kansas City
Albuquerque
Kansas City
Albuquerque
Kansas City
2018
95
89
0.23
0.29
10.3
11.1
35.3
29.6
N/A
N/A
20.3
24.5
4.3
7.4
0.5
0.9
2017
82
88
0.24
0.29
10.4
11.6
33.5
30.4
N/A
N/A
18.4
26.7
5.7
10.0
0.4
1.4
2016
86
85
0.22
0.30
10.4
12.0
33.2
28.9
N/A
N/A
16.0
24.9
5.3
9.0
0.8
1.5
2015
84
90
0.23
0.30
11.2
12.9
30.8
28.9
N/A
N/A
16.0
33.6
6.1
8.3
0.7
4.6
2014
89
90
0.22
0.28
11.7
13.0
31.8
28.6
N/A
N/A
22.0
28.5
6.1
9.3
0.6
5.0
2013
91
88
0.22
0.41
11.8
13.2
34.1
29.3
N/A
N/A
21.8
30.8
5.7
10.3
0.8
5.6
2012
116
105
0.18
0.52
13.7
14.2
33.6
31.9
N/A
N/A
26.6
N/A
9.3
10.3
0.7
6.4
2011
130
108
0.21
0.45
13.5
15.0
34.0
29.9
N/A
N/A
28.6
N/A
9.9
10.9
0.4
4.8
2010
92
97
0.15
0.40
12.2
15.0
32.1
27.4
N/A
N/A
25.1
N/A
6.8
11.9
N/A
5.4
2009
81
96
0.16
0.29
12.5
14.8
30.4
28.3
N/A
N/A
26.2
N/A
6.9
9.6
N/A
6.1
2008
91
89
0.21
0.40
11.8
17.0
31.5
25.7
N/A
N/A
20.8
N/A
6.5
11.5
N/A
6.0
2007
112
104
0.29
0.42
13.0
18.4
31.4
29.1
N/A
N/A
19.7
N/A
6.7
13.1
N/A
4.2
2006
103
104
0.33
0.36
14.2
18.5
31.8
29.2
N/A
N/A
21.1
N/A
N/A
12.4
N/A
5.1
2005
85
105
0.32
0.55
13.9
18.3
29.7
28.4
N/A
N/A
20.0
N/A
N/A
N/A
N/A
4.5
2004
89
83
0.32
0.45
16.6
11.6
29.8
26.2
0.003
N/A
21.5
N/A
N/A
N/A
N/A
4.0
2003
115
99
0.37
0.41
17.6
10.9
31.9
28.0
0.004
N/A
25.1
N/A
N/A
N/A
N/A
3.0
2002
91
100
0.43
0.40
18.9
8.9
29.1
27.0
0.005
N/A
23.1
N/A
N/A
N/A
N/A
2.5
2001
81
88
0.67
0.52
17.2
7.9
29.4
27.0
N/A
N/A
20.9
N/A
N/A
N/A
N/A
1.2
2000
95
102
0.81
0.75
17.0
8.8
27.9
29.2
N/A
N/A
17.7
N/A
N/A
N/A
N/A
2.2
Natural disasters
Type
Albuquerque
Kansas City
Tornado activity compared to U.S. average
6.4%
200.4%
Earthquake activity compared to U.S. average
802.6%
598.9%
Natural disasters compared to U.S. average
9%
24%
Transportation
Kansas City has more developed public transportation and commuting infrastructure, including buses, light rail, and bike-sharing programs. Albuquerque also offers public transportation options, but they are fewer and geographically more limited.
Transport
Type
Albuquerque
Kansas City
Amtrak stations
1
1
Amtrak stations nearby
1
3
FAA registered aircraft
1
0
FAA registered aircraft manufacturers and dealers
17
0
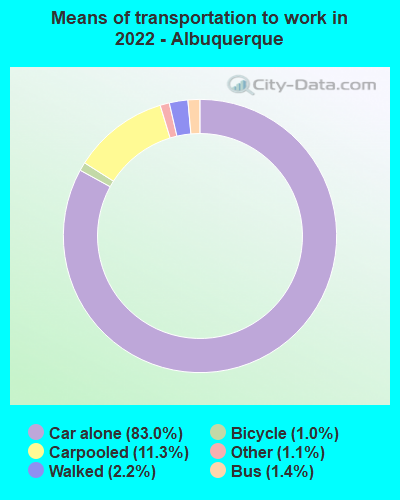
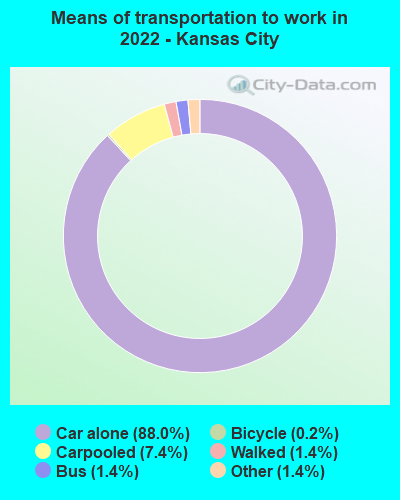
Means of transportation to work
Type
Albuquerque
Kansas City
Bicycle
0.9%
0.4%
Bus
0.8%
1.5%
Carpooled
9.6%
8.7%
Car alone
85.1%
86.8%
Motorcycle
0.2%
0.1%
Taxicab
0%
0.2%
Walked
2.3%
1.3%
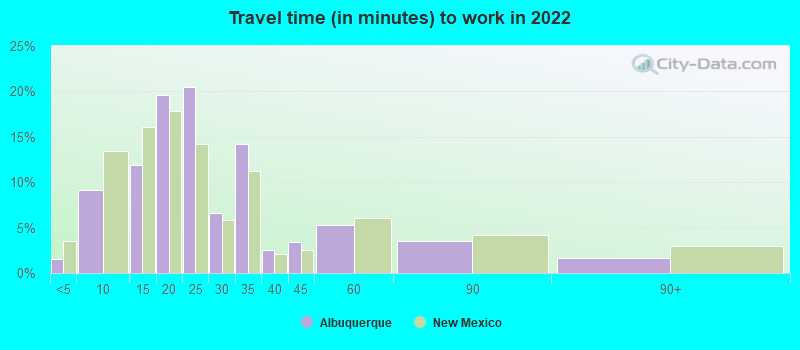
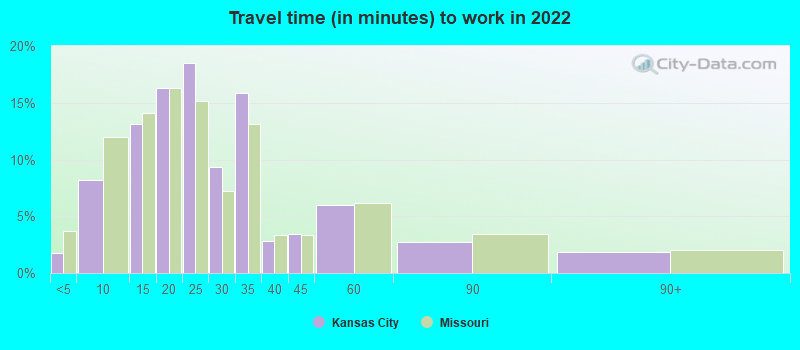
Average travel time to work
Type
Albuquerque
Kansas City
Average
24.5 min
25.5 min
Other means
20.8 min
21.7 min
Public transportation
37.8 min
38.9 min
Private vehicle occupancy
Type
Albuquerque
Kansas City
Average
1.1
1.1
Drove alone
91.6%
89.4%
In 2 person carpool
6.6%
8%
In 3 person carpool
1.2%
2.1%
In 4 person carpool
0.3%
0.3%
In 5-6 person carpool
0.1%
0.2%
In 7+ person carpool
0.2%
0%
How many people usually rode to work in the car, truck or van.
Real Estate
Real estate costs in Albuquerque tend to be lower than in Kansas City. However, real-estate appreciation over the past decade has been more significant in Kansas City. Both cities offer a variety of housing styles and neighborhoods for different housing needs.
Neighborhoods
Both cities have a rich mixture of neighborhoods to choose from, each with its unique character. Kansas City offers options ranging from vibrant downtown areas to quiet suburban neighborhoods, while Albuquerque has a mix of historic neighborhoods, downtown living, and quieter, suburban areas.
Houses and residents
Type
Albuquerque
Kansas City
Houses
256,814
243,950
Average household size (people)
2.4
2.3
Median year apartment built
1983
1975
Median year house/condo built
1984
1967
Length of stay in the house since moving in
12.6 years
12 years
Houses occupied
243,582 (94.8%)
219,020 (89.8%)
Houses occupied by owners
147,964 (60.7%)
118,384 (54.1%)
Houses occupied by renters
95,618 (39.3%)
100,636 (45.9%)
Median rent asked for vacant for-rent units
$893.82
$933.71
Median monthly housing costs
$1,021
$1,092
Median price asked for vacant for-sale houses and condos
$171,149
$71,644
Estimated median house or condo value
$251,500
$213,400
Median numbers of rooms
5.3
5.5
Median number of rooms in apartments
3.9
4.3
Median number of rooms in houses and condos
6.2
6.6
Median house price - detached houses
$290,578
$250,072
Median house price - in 2-unit structures
$636,758
$212,485
Median house price - in 3-to-4-unit structures
$274,794
$147,015
Median house price - in 5 or more unit structures
$224,872
$274,597
Median house price - mobile homes
$52,392
$19,650
Median house price - occupied boats, rvs, vans etc.
$35,209
$485,967
Median house price - Townhouses or other attached units
$209,825
$203,232
Median house price - All housing units
$271,083
$247,285
Median house age
38
52
Renting percentage
39.7%
43.8%
Housing density (houses/condos per square mile)
1,421.7
778
House value disparities
29.8%
36%
Household income disparities
45.9%
43.9%
Median household income for houses/condes with a mortgage
$87,851
$96,255
Median household income for apartments without a mortgage
$63,195
$64,961
Housing units without a mortgage
1,631 (1.6%)
1,566 (2%)
Housing units with both a second mortgage and home equity loan
3,560 (3.6%)
5,650 (7.2%)
Housing units with a mortgage
97,744 (98.4%)
77,422 (98%)
Housing units with a home equity loan
309 (0.3%)
403 (0.5%)
Housing units with a second mortgage
6,864 (6.9%)
6,848 (8.7%)
House/condo owner moved in on average (years ago)
11
9
House/condo renter moved in on average (years ago)
1
1
Housing units lacking complete kitchen facilities
1.1%
3.8%
Housing units lacking complete plumbing facilities
0.3%
2.2%
Housing units in structures
Housing units in structures
Albuquerque
Kansas City
One, detached
61.4%
60.7%
One, attached
6.6%
3.9%
Two
1.0%
3.1%
3 or 4
6.1%
4.4%
5 to 9
4.7%
5.8%
10 to 19
4.7%
6.2%
20 to 49
4.8%
5.8%
50 or more
6.3%
9.3%
Mobile homes
4.2%
0.6%
Boats, RVs, vans, etc.
0.0%
0.1%
Median real estate property taxes paid for housing units
Self-employed workers in own not incorporated business
14,060
13,035
State government workers
20,531
6,835
Unpaid family workers
359
197
Industries and Occupations
In Albuquerque, key industries include aerospace, healthcare, education, and solar energy. Kansas City has a diverse blend of industries from transport and trade to professional business services, government, and health care. Accordingly, occupations in both cities vary widely.
Both cities offer a variety of healthcare services. Kansas City has more numerous and highly ranked hospitals than Albuquerque, such as the University of Kansas Hospital. Albuquerque is home to the University of New Mexico Hospital and a VA Medical Center.
Health (county statistics)
Type
Albuquerque
Kansas City
General health status score of residents in this county from 1 (poor) to 5 (excellent)
The infrastructure in Kansas City is generally more developed than Albuquerque due to its earlier establishment and larger population. However, Albuquerque, with its smaller size, can offer less congestion and generally easier navigation.
Infrastructure
Type
Albuquerque
Kansas City
Hospitals
36
30
TV stations
18
14
Arenas or stadiums
1
2
Bank branches located here
137
140
Bank institutions located here
24
41
Main business address for public companies
8
27
Drinking water stations with no reported violations in the past
7
0
Drinking water stations with reported violations in the past
HMDA - Conventional home purchase loans - Applications denied
Year
Albuquerque
Kansas City
1999
2,651
1,565
2000
1,303
1,758
2001
752
1,494
2002
693
1,380
2003
1,022
1,975
2004
1,729
3,011
2005
2,199
3,470
2006
2,639
3,499
2007
1,575
2,228
2008
654
742
2009
368
447
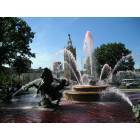
Culture and Food
Culture and food are vibrant parts of both cities. Kansas City is famous for its jazz heritage and barbeque cuisine, while Albuquerque is known for its rich Native American and Hispanic cultures and its New Mexican cuisine.
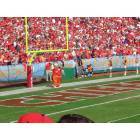
Sports Teams
Kansas City is home to popular professional sports teams, including the Kansas City Chiefs (NFL) and Royals (MLB). Albuquerque has the minor league baseball team, Albuquerque Isotopes, and New Mexico United, the state’s first professional soccer team.
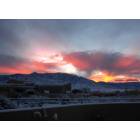
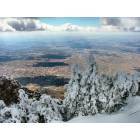


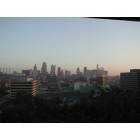
 Albuquerque, NM
 Kansas City, MO