Lake City, South Carolina Submit your own pictures of this city and show them to the world
OSM Map
General Map
Google Map
MSN Map
OSM Map
General Map
Google Map
MSN Map
OSM Map
General Map
Google Map
MSN Map
OSM Map
General Map
Google Map
MSN Map
Please wait while loading the map...
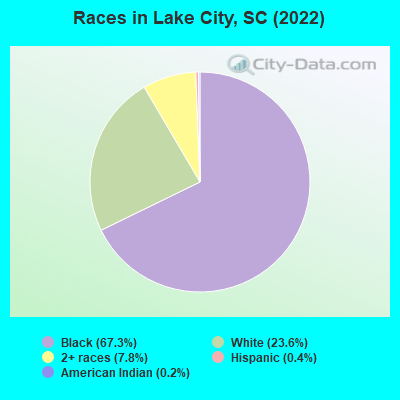
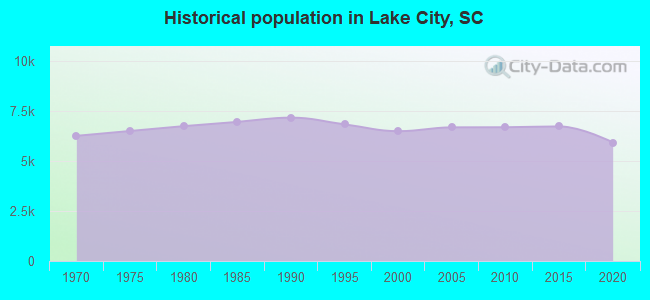
Population in 2022: 5,996 (96% urban, 4% rural). Population change since 2000: -7.4%Males: 2,707 Females: 3,289
March 2022 cost of living index in Lake City: 80.7 (low, U.S. average is 100) Percentage of residents living in poverty in 2022: 22.4%for White Non-Hispanic residents , 29.3% for Black residents , 91.3% for Hispanic or Latino residents , 18.4% for two or more races residents )Business Search - 14 Million verified businesses
Data:
Median household income ($)
Median household income (% change since 2000)
Household income diversity
Ratio of average income to average house value (%)
Ratio of average income to average rent
Median household income ($) - White
Median household income ($) - Black or African American
Median household income ($) - Asian
Median household income ($) - Hispanic or Latino
Median household income ($) - American Indian and Alaska Native
Median household income ($) - Multirace
Median household income ($) - Other Race
Median household income for houses/condos with a mortgage ($)
Median household income for apartments without a mortgage ($)
Races - White alone (%)
Races - White alone (% change since 2000)
Races - Black alone (%)
Races - Black alone (% change since 2000)
Races - American Indian alone (%)
Races - American Indian alone (% change since 2000)
Races - Asian alone (%)
Races - Asian alone (% change since 2000)
Races - Hispanic (%)
Races - Hispanic (% change since 2000)
Races - Native Hawaiian and Other Pacific Islander alone (%)
Races - Native Hawaiian and Other Pacific Islander alone (% change since 2000)
Races - Two or more races (%)
Races - Two or more races (% change since 2000)
Races - Other race alone (%)
Races - Other race alone (% change since 2000)
Racial diversity
Unemployment (%)
Unemployment (% change since 2000)
Unemployment (%) - White
Unemployment (%) - Black or African American
Unemployment (%) - Asian
Unemployment (%) - Hispanic or Latino
Unemployment (%) - American Indian and Alaska Native
Unemployment (%) - Multirace
Unemployment (%) - Other Race
Population density (people per square mile)
Population - Males (%)
Population - Females (%)
Population - Males (%) - White
Population - Males (%) - Black or African American
Population - Males (%) - Asian
Population - Males (%) - Hispanic or Latino
Population - Males (%) - American Indian and Alaska Native
Population - Males (%) - Multirace
Population - Males (%) - Other Race
Population - Females (%) - White
Population - Females (%) - Black or African American
Population - Females (%) - Asian
Population - Females (%) - Hispanic or Latino
Population - Females (%) - American Indian and Alaska Native
Population - Females (%) - Multirace
Population - Females (%) - Other Race
Coronavirus confirmed cases (Jul 17, 2024)
Deaths caused by coronavirus (Jul 17, 2024)
Coronavirus confirmed cases (per 100k population) (Jul 17, 2024)
Deaths caused by coronavirus (per 100k population) (Jul 17, 2024)
Daily increase in number of cases (Jul 17, 2024)
Weekly increase in number of cases (Jul 17, 2024)
Cases doubled (in days) (Jul 17, 2024)
Hospitalized patients (Apr 18, 2022)
Negative test results (Apr 18, 2022)
Total test results (Apr 18, 2022)
COVID Vaccine doses distributed (per 100k population) (Sep 19, 2023)
COVID Vaccine doses administered (per 100k population) (Sep 19, 2023)
COVID Vaccine doses distributed (Sep 19, 2023)
COVID Vaccine doses administered (Sep 19, 2023)
Likely homosexual households (%)
Likely homosexual households (% change since 2000)
Likely homosexual households - Lesbian couples (%)
Likely homosexual households - Lesbian couples (% change since 2000)
Likely homosexual households - Gay men (%)
Likely homosexual households - Gay men (% change since 2000)
Cost of living index
Median gross rent ($)
Median contract rent ($)
Median monthly housing costs ($)
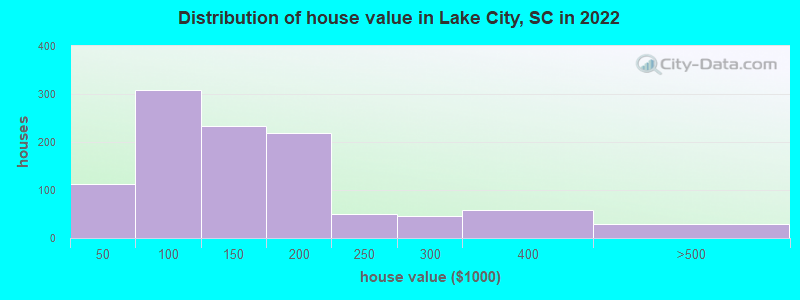
Median house or condo value ($)
Median house or condo value ($ change since 2000)
Mean house or condo value by units in structure - 1, detached ($)
Mean house or condo value by units in structure - 1, attached ($)
Mean house or condo value by units in structure - 2 ($)
Mean house or condo value by units in structure by units in structure - 3 or 4 ($)
Mean house or condo value by units in structure - 5 or more ($)
Mean house or condo value by units in structure - Boat, RV, van, etc. ($)
Mean house or condo value by units in structure - Mobile home ($)
Median house or condo value ($) - White
Median house or condo value ($) - Black or African American
Median house or condo value ($) - Asian
Median house or condo value ($) - Hispanic or Latino
Median house or condo value ($) - American Indian and Alaska Native
Median house or condo value ($) - Multirace
Median house or condo value ($) - Other Race
Median resident age
Resident age diversity
Median resident age - Males
Median resident age - Females
Median resident age - White
Median resident age - Black or African American
Median resident age - Asian
Median resident age - Hispanic or Latino
Median resident age - American Indian and Alaska Native
Median resident age - Multirace
Median resident age - Other Race
Median resident age - Males - White
Median resident age - Males - Black or African American
Median resident age - Males - Asian
Median resident age - Males - Hispanic or Latino
Median resident age - Males - American Indian and Alaska Native
Median resident age - Males - Multirace
Median resident age - Males - Other Race
Median resident age - Females - White
Median resident age - Females - Black or African American
Median resident age - Females - Asian
Median resident age - Females - Hispanic or Latino
Median resident age - Females - American Indian and Alaska Native
Median resident age - Females - Multirace
Median resident age - Females - Other Race
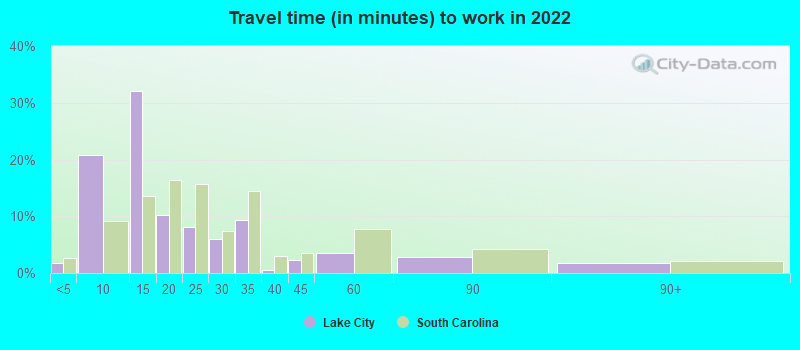
Commute - mean travel time to work (minutes)
Travel time to work - Less than 5 minutes (%)
Travel time to work - Less than 5 minutes (% change since 2000)
Travel time to work - 5 to 9 minutes (%)
Travel time to work - 5 to 9 minutes (% change since 2000)
Travel time to work - 10 to 19 minutes (%)
Travel time to work - 10 to 19 minutes (% change since 2000)
Travel time to work - 20 to 29 minutes (%)
Travel time to work - 20 to 29 minutes (% change since 2000)
Travel time to work - 30 to 39 minutes (%)
Travel time to work - 30 to 39 minutes (% change since 2000)
Travel time to work - 40 to 59 minutes (%)
Travel time to work - 40 to 59 minutes (% change since 2000)
Travel time to work - 60 to 89 minutes (%)
Travel time to work - 60 to 89 minutes (% change since 2000)
Travel time to work - 90 or more minutes (%)
Travel time to work - 90 or more minutes (% change since 2000)
Marital status - Never married (%)
Marital status - Now married (%)
Marital status - Separated (%)
Marital status - Widowed (%)
Marital status - Divorced (%)
Median family income ($)
Median family income (% change since 2000)
Median non-family income ($)
Median non-family income (% change since 2000)
Median per capita income ($)
Median per capita income (% change since 2000)
Median family income ($) - White
Median family income ($) - Black or African American
Median family income ($) - Asian
Median family income ($) - Hispanic or Latino
Median family income ($) - American Indian and Alaska Native
Median family income ($) - Multirace
Median family income ($) - Other Race
Median year house/condo built
Median year apartment built
Year house built - Built 2005 or later (%)
Year house built - Built 2000 to 2004 (%)
Year house built - Built 1990 to 1999 (%)
Year house built - Built 1980 to 1989 (%)
Year house built - Built 1970 to 1979 (%)
Year house built - Built 1960 to 1969 (%)
Year house built - Built 1950 to 1959 (%)
Year house built - Built 1940 to 1949 (%)
Year house built - Built 1939 or earlier (%)
Average household size
Household density (households per square mile)
Average household size - White
Average household size - Black or African American
Average household size - Asian
Average household size - Hispanic or Latino
Average household size - American Indian and Alaska Native
Average household size - Multirace
Average household size - Other Race
Occupied housing units (%)
Vacant housing units (%)
Owner occupied housing units (%)
Renter occupied housing units (%)
Vacancy status - For rent (%)
Vacancy status - For sale only (%)
Vacancy status - Rented or sold, not occupied (%)
Vacancy status - For seasonal, recreational, or occasional use (%)
Vacancy status - For migrant workers (%)
Vacancy status - Other vacant (%)
Residents with income below the poverty level (%)
Residents with income below 50% of the poverty level (%)
Children below poverty level (%)
Poor families by family type - Married-couple family (%)
Poor families by family type - Male, no wife present (%)
Poor families by family type - Female, no husband present (%)
Poverty status for native-born residents (%)
Poverty status for foreign-born residents (%)
Poverty among high school graduates not in families (%)
Poverty among people who did not graduate high school not in families (%)
Residents with income below the poverty level (%) - White
Residents with income below the poverty level (%) - Black or African American
Residents with income below the poverty level (%) - Asian
Residents with income below the poverty level (%) - Hispanic or Latino
Residents with income below the poverty level (%) - American Indian and Alaska Native
Residents with income below the poverty level (%) - Multirace
Residents with income below the poverty level (%) - Other Race
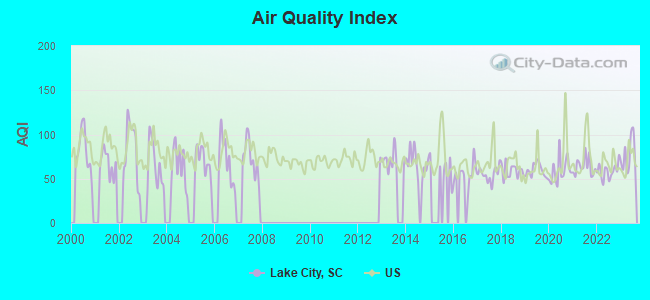
Air pollution - Air Quality Index (AQI)
Air pollution - CO
Air pollution - NO2
Air pollution - SO2
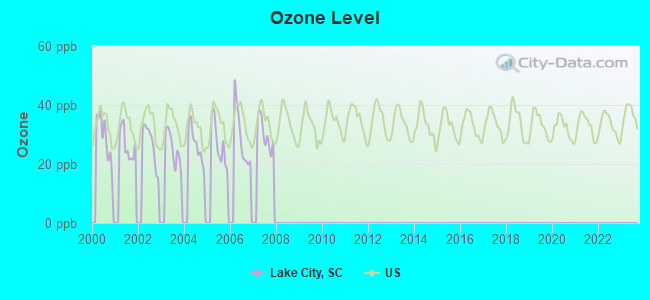
Air pollution - Ozone
Air pollution - PM10
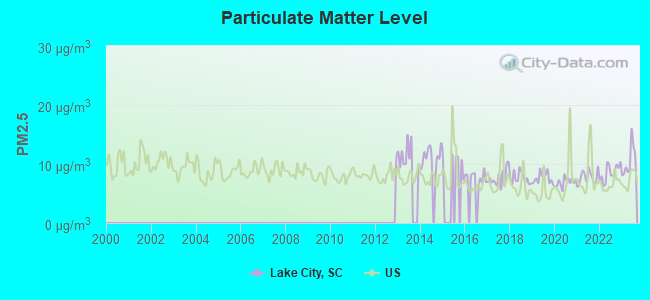
Air pollution - PM25
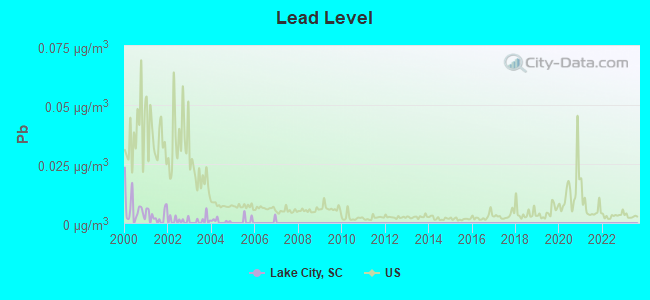
Air pollution - Pb
Crime - Murders per 100,000 population
Crime - Rapes per 100,000 population
Crime - Robberies per 100,000 population
Crime - Assaults per 100,000 population
Crime - Burglaries per 100,000 population
Crime - Thefts per 100,000 population
Crime - Auto thefts per 100,000 population
Crime - Arson per 100,000 population
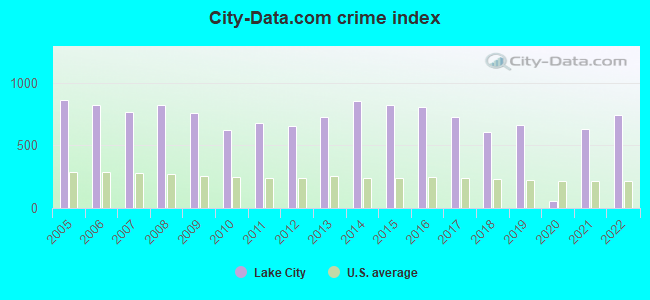
Crime - City-data.com crime index
Crime - Violent crime index
Crime - Property crime index
Crime - Murders per 100,000 population (5 year average)
Crime - Rapes per 100,000 population (5 year average)
Crime - Robberies per 100,000 population (5 year average)
Crime - Assaults per 100,000 population (5 year average)
Crime - Burglaries per 100,000 population (5 year average)
Crime - Thefts per 100,000 population (5 year average)
Crime - Auto thefts per 100,000 population (5 year average)
Crime - Arson per 100,000 population (5 year average)
Crime - City-data.com crime index (5 year average)
Crime - Violent crime index (5 year average)
Crime - Property crime index (5 year average)
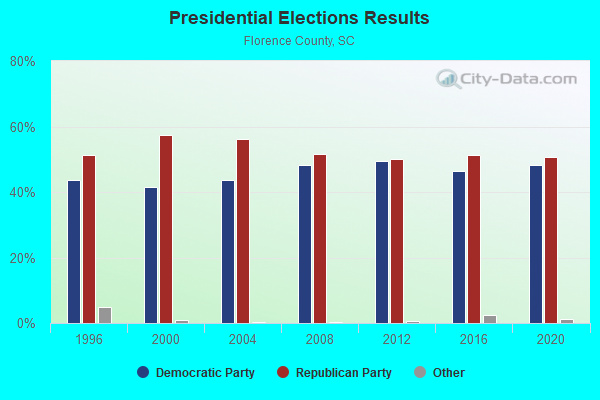
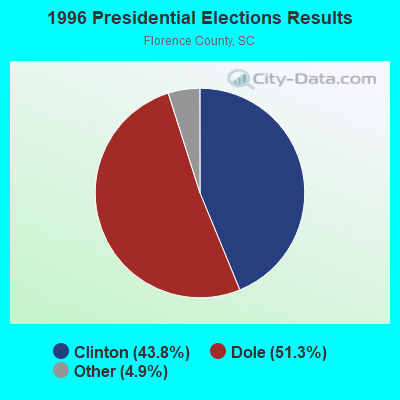
1996 Presidential Elections Results (%) - Democratic Party (Clinton)
1996 Presidential Elections Results (%) - Republican Party (Dole)
1996 Presidential Elections Results (%) - Other
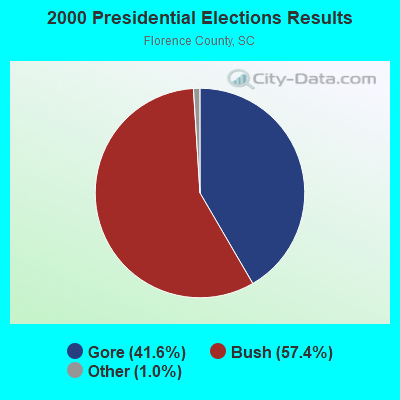
2000 Presidential Elections Results (%) - Democratic Party (Gore)
2000 Presidential Elections Results (%) - Republican Party (Bush)
2000 Presidential Elections Results (%) - Other
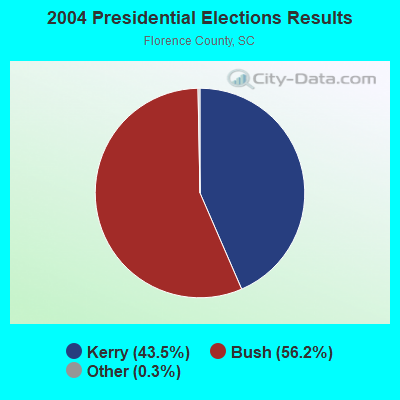
2004 Presidential Elections Results (%) - Democratic Party (Kerry)
2004 Presidential Elections Results (%) - Republican Party (Bush)
2004 Presidential Elections Results (%) - Other
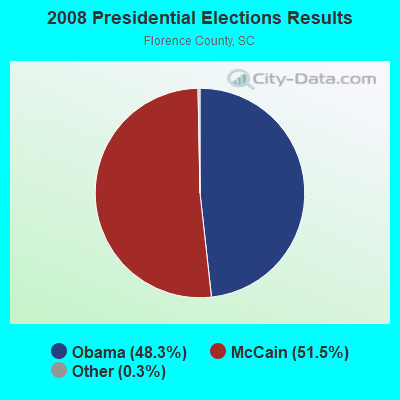
2008 Presidential Elections Results (%) - Democratic Party (Obama)
2008 Presidential Elections Results (%) - Republican Party (McCain)
2008 Presidential Elections Results (%) - Other
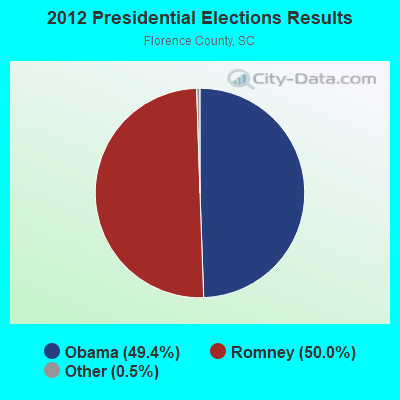
2012 Presidential Elections Results (%) - Democratic Party (Obama)
2012 Presidential Elections Results (%) - Republican Party (Romney)
2012 Presidential Elections Results (%) - Other
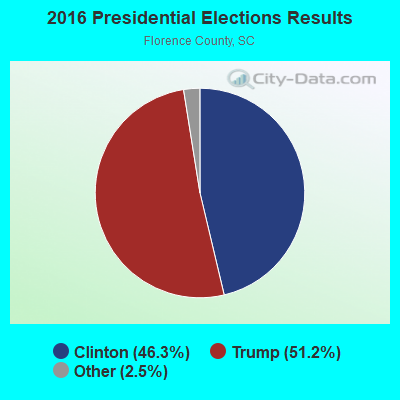
2016 Presidential Elections Results (%) - Democratic Party (Clinton)
2016 Presidential Elections Results (%) - Republican Party (Trump)
2016 Presidential Elections Results (%) - Other
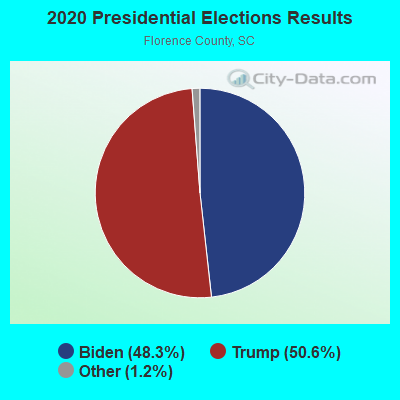
2020 Presidential Elections Results (%) - Democratic Party (Biden)
2020 Presidential Elections Results (%) - Republican Party (Trump)
2020 Presidential Elections Results (%) - Other
Ancestries Reported - Arab (%)
Ancestries Reported - Czech (%)
Ancestries Reported - Danish (%)
Ancestries Reported - Dutch (%)
Ancestries Reported - English (%)
Ancestries Reported - French (%)
Ancestries Reported - French Canadian (%)
Ancestries Reported - German (%)
Ancestries Reported - Greek (%)
Ancestries Reported - Hungarian (%)
Ancestries Reported - Irish (%)
Ancestries Reported - Italian (%)
Ancestries Reported - Lithuanian (%)
Ancestries Reported - Norwegian (%)
Ancestries Reported - Polish (%)
Ancestries Reported - Portuguese (%)
Ancestries Reported - Russian (%)
Ancestries Reported - Scotch-Irish (%)
Ancestries Reported - Scottish (%)
Ancestries Reported - Slovak (%)
Ancestries Reported - Subsaharan African (%)
Ancestries Reported - Swedish (%)
Ancestries Reported - Swiss (%)
Ancestries Reported - Ukrainian (%)
Ancestries Reported - United States (%)
Ancestries Reported - Welsh (%)
Ancestries Reported - West Indian (%)
Ancestries Reported - Other (%)
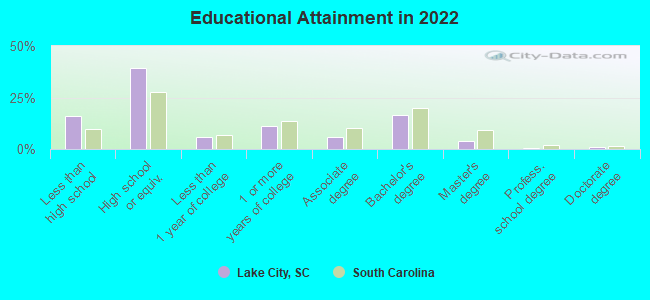
Educational Attainment - No schooling completed (%)
Educational Attainment - Less than high school (%)
Educational Attainment - High school or equivalent (%)
Educational Attainment - Less than 1 year of college (%)
Educational Attainment - 1 or more years of college (%)
Educational Attainment - Associate degree (%)
Educational Attainment - Bachelor's degree (%)
Educational Attainment - Master's degree (%)
Educational Attainment - Professional school degree (%)
Educational Attainment - Doctorate degree (%)
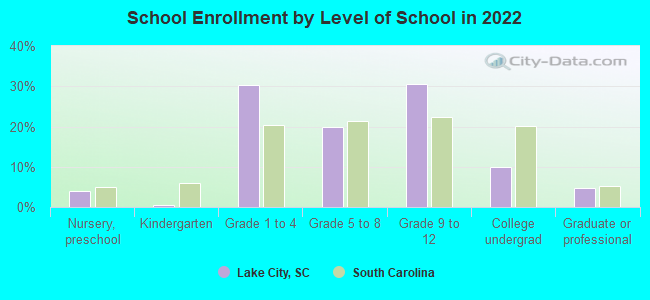
School Enrollment - Nursery, preschool (%)
School Enrollment - Kindergarten (%)
School Enrollment - Grade 1 to 4 (%)
School Enrollment - Grade 5 to 8 (%)
School Enrollment - Grade 9 to 12 (%)
School Enrollment - College undergrad (%)
School Enrollment - Graduate or professional (%)
School Enrollment - Not enrolled in school (%)
School enrollment - Public schools (%)
School enrollment - Private schools (%)
School enrollment - Not enrolled (%)
Median number of rooms in houses and condos
Median number of rooms in apartments
Housing units lacking complete plumbing facilities (%)
Housing units lacking complete kitchen facilities (%)
Density of houses
Urban houses (%)
Rural houses (%)
Households with people 60 years and over (%)
Households with people 65 years and over (%)
Households with people 75 years and over (%)
Households with one or more nonrelatives (%)
Households with no nonrelatives (%)
Population in households (%)
Family households (%)
Nonfamily households (%)
Population in families (%)
Family households with own children (%)
Median number of bedrooms in owner occupied houses
Mean number of bedrooms in owner occupied houses
Median number of bedrooms in renter occupied houses
Mean number of bedrooms in renter occupied houses
Median number of vehichles in owner occupied houses
Mean number of vehichles in owner occupied houses
Median number of vehichles in renter occupied houses
Mean number of vehichles in renter occupied houses
Mortgage status - with mortgage (%)
Mortgage status - with second mortgage (%)
Mortgage status - with home equity loan (%)
Mortgage status - with both second mortgage and home equity loan (%)
Mortgage status - without a mortgage (%)
Average family size
Average family size - White
Average family size - Black or African American
Average family size - Asian
Average family size - Hispanic or Latino
Average family size - American Indian and Alaska Native
Average family size - Multirace
Average family size - Other Race
Geographical mobility - Same house 1 year ago (%)
Geographical mobility - Moved within same county (%)
Geographical mobility - Moved from different county within same state (%)
Geographical mobility - Moved from different state (%)
Geographical mobility - Moved from abroad (%)
Place of birth - Born in state of residence (%)
Place of birth - Born in other state (%)
Place of birth - Native, outside of US (%)
Place of birth - Foreign born (%)
Housing units in structures - 1, detached (%)
Housing units in structures - 1, attached (%)
Housing units in structures - 2 (%)
Housing units in structures - 3 or 4 (%)
Housing units in structures - 5 to 9 (%)
Housing units in structures - 10 to 19 (%)
Housing units in structures - 20 to 49 (%)
Housing units in structures - 50 or more (%)
Housing units in structures - Mobile home (%)
Housing units in structures - Boat, RV, van, etc. (%)
House/condo owner moved in on average (years ago)
Renter moved in on average (years ago)
Year householder moved into unit - Moved in 1999 to March 2000 (%)
Year householder moved into unit - Moved in 1995 to 1998 (%)
Year householder moved into unit - Moved in 1990 to 1994 (%)
Year householder moved into unit - Moved in 1980 to 1989 (%)
Year householder moved into unit - Moved in 1970 to 1979 (%)
Year householder moved into unit - Moved in 1969 or earlier (%)
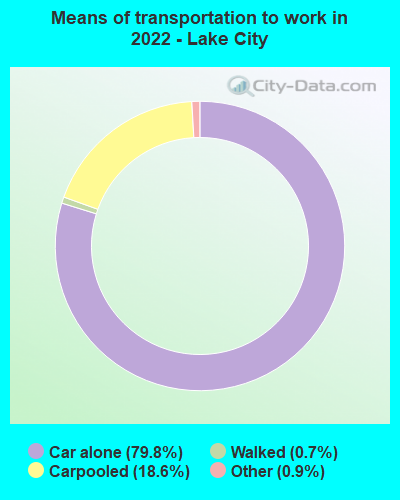
Means of transportation to work - Drove car alone (%)
Means of transportation to work - Carpooled (%)
Means of transportation to work - Public transportation (%)
Means of transportation to work - Bus or trolley bus (%)
Means of transportation to work - Streetcar or trolley car (%)
Means of transportation to work - Subway or elevated (%)
Means of transportation to work - Railroad (%)
Means of transportation to work - Ferryboat (%)
Means of transportation to work - Taxicab (%)
Means of transportation to work - Motorcycle (%)
Means of transportation to work - Bicycle (%)
Means of transportation to work - Walked (%)
Means of transportation to work - Other means (%)
Working at home (%)
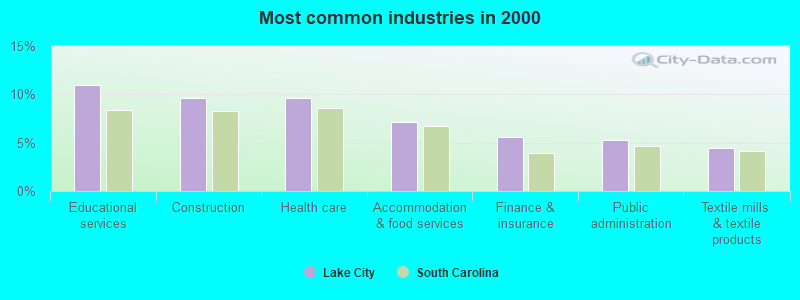
Industry diversity
Most Common Industries - Agriculture, forestry, fishing and hunting, and mining (%)
Most Common Industries - Agriculture, forestry, fishing and hunting (%)
Most Common Industries - Mining, quarrying, and oil and gas extraction (%)
Most Common Industries - Construction (%)
Most Common Industries - Manufacturing (%)
Most Common Industries - Wholesale trade (%)
Most Common Industries - Retail trade (%)
Most Common Industries - Transportation and warehousing, and utilities (%)
Most Common Industries - Transportation and warehousing (%)
Most Common Industries - Utilities (%)
Most Common Industries - Information (%)
Most Common Industries - Finance and insurance, and real estate and rental and leasing (%)
Most Common Industries - Finance and insurance (%)
Most Common Industries - Real estate and rental and leasing (%)
Most Common Industries - Professional, scientific, and management, and administrative and waste management services (%)
Most Common Industries - Professional, scientific, and technical services (%)
Most Common Industries - Management of companies and enterprises (%)
Most Common Industries - Administrative and support and waste management services (%)
Most Common Industries - Educational services, and health care and social assistance (%)
Most Common Industries - Educational services (%)
Most Common Industries - Health care and social assistance (%)
Most Common Industries - Arts, entertainment, and recreation, and accommodation and food services (%)
Most Common Industries - Arts, entertainment, and recreation (%)
Most Common Industries - Accommodation and food services (%)
Most Common Industries - Other services, except public administration (%)
Most Common Industries - Public administration (%)
Occupation diversity
Most Common Occupations - Management, business, science, and arts occupations (%)
Most Common Occupations - Management, business, and financial occupations (%)
Most Common Occupations - Management occupations (%)
Most Common Occupations - Business and financial operations occupations (%)
Most Common Occupations - Computer, engineering, and science occupations (%)
Most Common Occupations - Computer and mathematical occupations (%)
Most Common Occupations - Architecture and engineering occupations (%)
Most Common Occupations - Life, physical, and social science occupations (%)
Most Common Occupations - Education, legal, community service, arts, and media occupations (%)
Most Common Occupations - Community and social service occupations (%)
Most Common Occupations - Legal occupations (%)
Most Common Occupations - Education, training, and library occupations (%)
Most Common Occupations - Arts, design, entertainment, sports, and media occupations (%)
Most Common Occupations - Healthcare practitioners and technical occupations (%)
Most Common Occupations - Health diagnosing and treating practitioners and other technical occupations (%)
Most Common Occupations - Health technologists and technicians (%)
Most Common Occupations - Service occupations (%)
Most Common Occupations - Healthcare support occupations (%)
Most Common Occupations - Protective service occupations (%)
Most Common Occupations - Fire fighting and prevention, and other protective service workers including supervisors (%)
Most Common Occupations - Law enforcement workers including supervisors (%)
Most Common Occupations - Food preparation and serving related occupations (%)
Most Common Occupations - Building and grounds cleaning and maintenance occupations (%)
Most Common Occupations - Personal care and service occupations (%)
Most Common Occupations - Sales and office occupations (%)
Most Common Occupations - Sales and related occupations (%)
Most Common Occupations - Office and administrative support occupations (%)
Most Common Occupations - Natural resources, construction, and maintenance occupations (%)
Most Common Occupations - Farming, fishing, and forestry occupations (%)
Most Common Occupations - Construction and extraction occupations (%)
Most Common Occupations - Installation, maintenance, and repair occupations (%)
Most Common Occupations - Production, transportation, and material moving occupations (%)
Most Common Occupations - Production occupations (%)
Most Common Occupations - Transportation occupations (%)
Most Common Occupations - Material moving occupations (%)
People in Group quarters - Institutionalized population (%)
People in Group quarters - Correctional institutions (%)
People in Group quarters - Federal prisons and detention centers (%)
People in Group quarters - Halfway houses (%)
People in Group quarters - Local jails and other confinement facilities (including police lockups) (%)
People in Group quarters - Military disciplinary barracks (%)
People in Group quarters - State prisons (%)
People in Group quarters - Other types of correctional institutions (%)
People in Group quarters - Nursing homes (%)
People in Group quarters - Hospitals/wards, hospices, and schools for the handicapped (%)
People in Group quarters - Hospitals/wards and hospices for chronically ill (%)
People in Group quarters - Hospices or homes for chronically ill (%)
People in Group quarters - Military hospitals or wards for chronically ill (%)
People in Group quarters - Other hospitals or wards for chronically ill (%)
People in Group quarters - Hospitals or wards for drug/alcohol abuse (%)
People in Group quarters - Mental (Psychiatric) hospitals or wards (%)
People in Group quarters - Schools, hospitals, or wards for the mentally retarded (%)
People in Group quarters - Schools, hospitals, or wards for the physically handicapped (%)
People in Group quarters - Institutions for the deaf (%)
People in Group quarters - Institutions for the blind (%)
People in Group quarters - Orthopedic wards and institutions for the physically handicapped (%)
People in Group quarters - Wards in general hospitals for patients who have no usual home elsewhere (%)
People in Group quarters - Wards in military hospitals for patients who have no usual home elsewhere (%)
People in Group quarters - Juvenile institutions (%)
People in Group quarters - Long-term care (%)
People in Group quarters - Homes for abused, dependent, and neglected children (%)
People in Group quarters - Residential treatment centers for emotionally disturbed children (%)
People in Group quarters - Training schools for juvenile delinquents (%)
People in Group quarters - Short-term care, detention or diagnostic centers for delinquent children (%)
People in Group quarters - Type of juvenile institution unknown (%)
People in Group quarters - Noninstitutionalized population (%)
People in Group quarters - College dormitories (includes college quarters off campus) (%)
People in Group quarters - Military quarters (%)
People in Group quarters - On base (%)
People in Group quarters - Barracks, unaccompanied personnel housing (UPH), (Enlisted/Officer), ;and similar group living quarters for military personnel (%)
People in Group quarters - Transient quarters for temporary residents (%)
People in Group quarters - Military ships (%)
People in Group quarters - Group homes (%)
People in Group quarters - Homes or halfway houses for drug/alcohol abuse (%)
People in Group quarters - Homes for the mentally ill (%)
People in Group quarters - Homes for the mentally retarded (%)
People in Group quarters - Homes for the physically handicapped (%)
People in Group quarters - Other group homes (%)
People in Group quarters - Religious group quarters (%)
People in Group quarters - Dormitories (%)
People in Group quarters - Agriculture workers' dormitories on farms (%)
People in Group quarters - Job Corps and vocational training facilities (%)
People in Group quarters - Other workers' dormitories (%)
People in Group quarters - Crews of maritime vessels (%)
People in Group quarters - Other nonhousehold living situations (%)
People in Group quarters - Other noninstitutional group quarters (%)
Residents speaking English at home (%)
Residents speaking English at home - Born in the United States (%)
Residents speaking English at home - Native, born elsewhere (%)
Residents speaking English at home - Foreign born (%)
Residents speaking Spanish at home (%)
Residents speaking Spanish at home - Born in the United States (%)
Residents speaking Spanish at home - Native, born elsewhere (%)
Residents speaking Spanish at home - Foreign born (%)
Residents speaking other language at home (%)
Residents speaking other language at home - Born in the United States (%)
Residents speaking other language at home - Native, born elsewhere (%)
Residents speaking other language at home - Foreign born (%)
Class of Workers - Employee of private company (%)
Class of Workers - Self-employed in own incorporated business (%)
Class of Workers - Private not-for-profit wage and salary workers (%)
Class of Workers - Local government workers (%)
Class of Workers - State government workers (%)
Class of Workers - Federal government workers (%)
Class of Workers - Self-employed workers in own not incorporated business and Unpaid family workers (%)
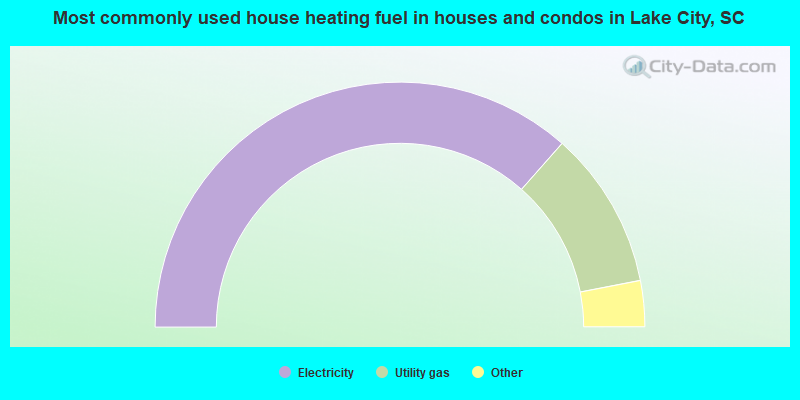
House heating fuel used in houses and condos - Utility gas (%)
House heating fuel used in houses and condos - Bottled, tank, or LP gas (%)
House heating fuel used in houses and condos - Electricity (%)
House heating fuel used in houses and condos - Fuel oil, kerosene, etc. (%)
House heating fuel used in houses and condos - Coal or coke (%)
House heating fuel used in houses and condos - Wood (%)
House heating fuel used in houses and condos - Solar energy (%)
House heating fuel used in houses and condos - Other fuel (%)
House heating fuel used in houses and condos - No fuel used (%)
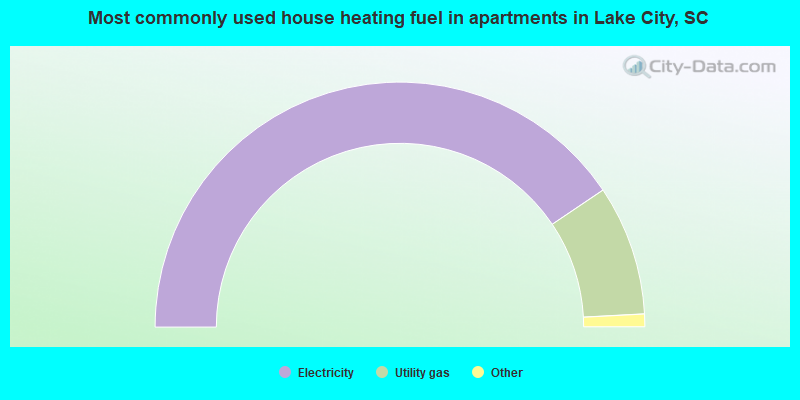
House heating fuel used in apartments - Utility gas (%)
House heating fuel used in apartments - Bottled, tank, or LP gas (%)
House heating fuel used in apartments - Electricity (%)
House heating fuel used in apartments - Fuel oil, kerosene, etc. (%)
House heating fuel used in apartments - Coal or coke (%)
House heating fuel used in apartments - Wood (%)
House heating fuel used in apartments - Solar energy (%)
House heating fuel used in apartments - Other fuel (%)
House heating fuel used in apartments - No fuel used (%)
Armed forces status - In Armed Forces (%)
Armed forces status - Civilian (%)
Armed forces status - Civilian - Veteran (%)
Armed forces status - Civilian - Nonveteran (%)
Fatal accidents locations in years 2005-2021
Fatal accidents locations in 2005
Fatal accidents locations in 2006
Fatal accidents locations in 2007
Fatal accidents locations in 2008
Fatal accidents locations in 2009
Fatal accidents locations in 2010
Fatal accidents locations in 2011
Fatal accidents locations in 2012
Fatal accidents locations in 2013
Fatal accidents locations in 2014
Fatal accidents locations in 2015
Fatal accidents locations in 2016
Fatal accidents locations in 2017
Fatal accidents locations in 2018
Fatal accidents locations in 2019
Fatal accidents locations in 2020
Fatal accidents locations in 2021
Alcohol use - People drinking some alcohol every month (%)
Alcohol use - People not drinking at all (%)
Alcohol use - Average days/month drinking alcohol
Alcohol use - Average drinks/week
Alcohol use - Average days/year people drink much
Audiometry - Average condition of hearing (%)
Audiometry - People that can hear a whisper from across a quiet room (%)
Audiometry - People that can hear normal voice from across a quiet room (%)
Audiometry - Ears ringing, roaring, buzzing (%)
Audiometry - Had a job exposure to loud noise (%)
Audiometry - Had off-work exposure to loud noise (%)
Blood Pressure & Cholesterol - Has high blood pressure (%)
Blood Pressure & Cholesterol - Checking blood pressure at home (%)
Blood Pressure & Cholesterol - Frequently checking blood cholesterol (%)
Blood Pressure & Cholesterol - Has high cholesterol level (%)
Consumer Behavior - Money monthly spent on food at supermarket/grocery store
Consumer Behavior - Money monthly spent on food at other stores
Consumer Behavior - Money monthly spent on eating out
Consumer Behavior - Money monthly spent on carryout/delivered foods
Consumer Behavior - Income spent on food at supermarket/grocery store (%)
Consumer Behavior - Income spent on food at other stores (%)
Consumer Behavior - Income spent on eating out (%)
Consumer Behavior - Income spent on carryout/delivered foods (%)
Current Health Status - General health condition (%)
Current Health Status - Blood donors (%)
Current Health Status - Has blood ever tested for HIV virus (%)
Current Health Status - Left-handed people (%)
Dermatology - People using sunscreen (%)
Diabetes - Diabetics (%)
Diabetes - Had a blood test for high blood sugar (%)
Diabetes - People taking insulin (%)
Diet Behavior & Nutrition - Diet health (%)
Diet Behavior & Nutrition - Milk product consumption (# of products/month)
Diet Behavior & Nutrition - Meals not home prepared (#/week)
Diet Behavior & Nutrition - Meals from fast food or pizza place (#/week)
Diet Behavior & Nutrition - Ready-to-eat foods (#/month)
Diet Behavior & Nutrition - Frozen meals/pizza (#/month)
Drug Use - People that ever used marijuana or hashish (%)
Drug Use - Ever used hard drugs (%)
Drug Use - Ever used any form of cocaine (%)
Drug Use - Ever used heroin (%)
Drug Use - Ever used methamphetamine (%)
Health Insurance - People covered by health insurance (%)
Kidney Conditions-Urology - Avg. # of times urinating at night
Medical Conditions - People with asthma (%)
Medical Conditions - People with anemia (%)
Medical Conditions - People with psoriasis (%)
Medical Conditions - People with overweight (%)
Medical Conditions - Elderly people having difficulties in thinking or remembering (%)
Medical Conditions - People who ever received blood transfusion (%)
Medical Conditions - People having trouble seeing even with glass/contacts (%)
Medical Conditions - People with arthritis (%)
Medical Conditions - People with gout (%)
Medical Conditions - People with congestive heart failure (%)
Medical Conditions - People with coronary heart disease (%)
Medical Conditions - People with angina pectoris (%)
Medical Conditions - People who ever had heart attack (%)
Medical Conditions - People who ever had stroke (%)
Medical Conditions - People with emphysema (%)
Medical Conditions - People with thyroid problem (%)
Medical Conditions - People with chronic bronchitis (%)
Medical Conditions - People with any liver condition (%)
Medical Conditions - People who ever had cancer or malignancy (%)
Mental Health - People who have little interest in doing things (%)
Mental Health - People feeling down, depressed, or hopeless (%)
Mental Health - People who have trouble sleeping or sleeping too much (%)
Mental Health - People feeling tired or having little energy (%)
Mental Health - People with poor appetite or overeating (%)
Mental Health - People feeling bad about themself (%)
Mental Health - People who have trouble concentrating on things (%)
Mental Health - People moving or speaking slowly or too fast (%)
Mental Health - People having thoughts they would be better off dead (%)
Oral Health - Average years since last visit a dentist
Oral Health - People embarrassed because of mouth (%)
Oral Health - People with gum disease (%)
Oral Health - General health of teeth and gums (%)
Oral Health - Average days a week using dental floss/device
Oral Health - Average days a week using mouthwash for dental problem
Oral Health - Average number of teeth
Pesticide Use - Households using pesticides to control insects (%)
Pesticide Use - Households using pesticides to kill weeds (%)
Physical Activity - People doing vigorous-intensity work activities (%)
Physical Activity - People doing moderate-intensity work activities (%)
Physical Activity - People walking or bicycling (%)
Physical Activity - People doing vigorous-intensity recreational activities (%)
Physical Activity - People doing moderate-intensity recreational activities (%)
Physical Activity - Average hours a day doing sedentary activities
Physical Activity - Average hours a day watching TV or videos
Physical Activity - Average hours a day using computer
Physical Functioning - People having limitations keeping them from working (%)
Physical Functioning - People limited in amount of work they can do (%)
Physical Functioning - People that need special equipment to walk (%)
Physical Functioning - People experiencing confusion/memory problems (%)
Physical Functioning - People requiring special healthcare equipment (%)
Prescription Medications - Average number of prescription medicines taking
Preventive Aspirin Use - Adults 40+ taking low-dose aspirin (%)
Reproductive Health - Vaginal deliveries (%)
Reproductive Health - Cesarean deliveries (%)
Reproductive Health - Deliveries resulted in a live birth (%)
Reproductive Health - Pregnancies resulted in a delivery (%)
Reproductive Health - Women breastfeeding newborns (%)
Reproductive Health - Women that had a hysterectomy (%)
Reproductive Health - Women that had both ovaries removed (%)
Reproductive Health - Women that have ever taken birth control pills (%)
Reproductive Health - Women taking birth control pills (%)
Reproductive Health - Women that have ever used Depo-Provera or injectables (%)
Reproductive Health - Women that have ever used female hormones (%)
Sexual Behavior - People 18+ that ever had sex (vaginal, anal, or oral) (%)
Sexual Behavior - Males 18+ that ever had vaginal sex with a woman (%)
Sexual Behavior - Males 18+ that ever performed oral sex on a woman (%)
Sexual Behavior - Males 18+ that ever had anal sex with a woman (%)
Sexual Behavior - Males 18+ that ever had any sex with a man (%)
Sexual Behavior - Females 18+ that ever had vaginal sex with a man (%)
Sexual Behavior - Females 18+ that ever performed oral sex on a man (%)
Sexual Behavior - Females 18+ that ever had anal sex with a man (%)
Sexual Behavior - Females 18+ that ever had any kind of sex with a woman (%)
Sexual Behavior - Average age people first had sex
Sexual Behavior - Average number of female sex partners in lifetime (males 18+)
Sexual Behavior - Average number of female vaginal sex partners in lifetime (males 18+)
Sexual Behavior - Average age people first performed oral sex on a woman (18+)
Sexual Behavior - Average number of woman performed oral sex on in lifetime (18+)
Sexual Behavior - Average number of male sex partners in lifetime (males 18+)
Sexual Behavior - Average number of male anal sex partners in lifetime (males 18+)
Sexual Behavior - Average age people first performed oral sex on a man (18+)
Sexual Behavior - Average number of male oral sex partners in lifetime (18+)
Sexual Behavior - People using protection when performing oral sex (%)
Sexual Behavior - Average number of times people have vaginal or anal sex a year
Sexual Behavior - People having sex without condom (%)
Sexual Behavior - Average number of male sex partners in lifetime (females 18+)
Sexual Behavior - Average number of male vaginal sex partners in lifetime (females 18+)
Sexual Behavior - Average number of female sex partners in lifetime (females 18+)
Sexual Behavior - Circumcised males 18+ (%)
Sleep Disorders - Average hours sleeping at night
Sleep Disorders - People that has trouble sleeping (%)
Smoking-Cigarette Use - People smoking cigarettes (%)
Taste & Smell - People 40+ having problems with smell (%)
Taste & Smell - People 40+ having problems with taste (%)
Taste & Smell - People 40+ that ever had wisdom teeth removed (%)
Taste & Smell - People 40+ that ever had tonsils teeth removed (%)
Taste & Smell - People 40+ that ever had a loss of consciousness because of a head injury (%)
Taste & Smell - People 40+ that ever had a broken nose or other serious injury to face or skull (%)
Taste & Smell - People 40+ that ever had two or more sinus infections (%)
Weight - Average height (inches)
Weight - Average weight (pounds)
Weight - Average BMI
Weight - People that are obese (%)
Weight - People that ever were obese (%)
Weight - People trying to lose weight (%)
Officers per 1,000 residents here:
3.40South Carolina average:
2.34
Latest news from Lake City, SC collected exclusively by city-data.com from local newspapers, TV, and radio stations
Ancestries: European (2.1%), Scotch-Irish (1.9%), American (1.5%).
Current Local Time:
Land area: 4.75 square miles.
Population density: 1,263 people per square mile (low).
32 residents are foreign born
This city:
0.5%South Carolina:
5.3%
Median real estate property taxes paid for housing units with mortgages in 2022: $687 (0.4%)Median real estate property taxes paid for housing units with no mortgage in 2022: $614 (0.5%)
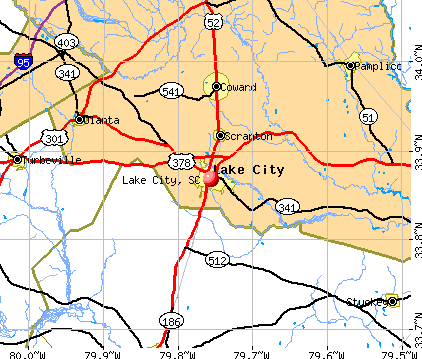
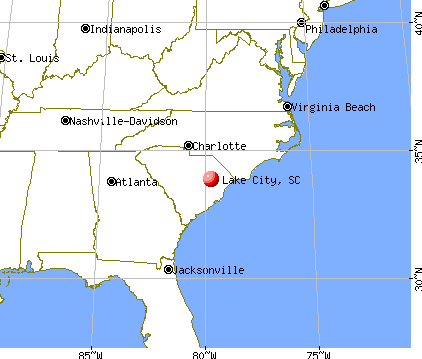
Nearest city with pop. 50,000+: North Charleston, SC
Nearest city with pop. 200,000+: Charlotte, NC
Nearest city with pop. 1,000,000+: Philadelphia, PA
Nearest cities:
Latitude: 33.87 N, Longitude: 79.76 W
Daytime population change due to commuting: +472 (+7.8%)Workers who live and work in this city: 884 (34.3%)
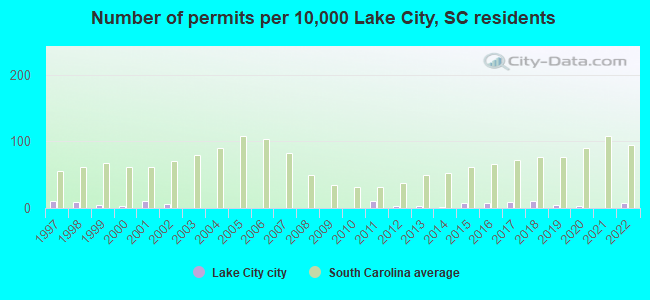
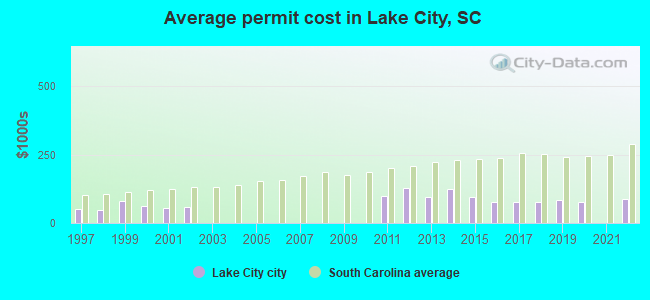
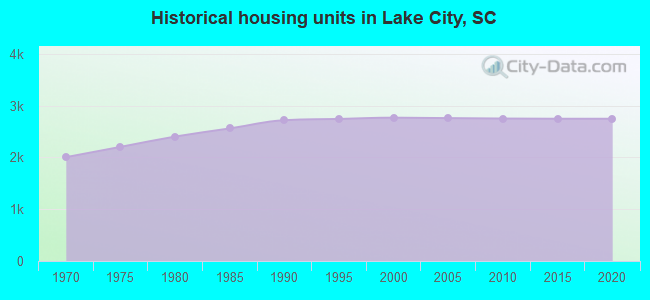
Single-family new house construction building permits:
2022: 5 buildings , average cost: $86,5002020: 2 buildings , average cost: $77,5002019: 3 buildings , average cost: $85,9002018: 7 buildings , average cost: $75,8002017: 6 buildings , average cost: $75,8002016: 5 buildings , average cost: $75,8002015: 5 buildings , average cost: $95,7002014: 1 building , cost: $123,1002013: 2 buildings , average cost: $97,0002012: 2 buildings , average cost: $127,0002011: 7 buildings , average cost: $100,0002002: 4 buildings , average cost: $58,8002001: 7 buildings , average cost: $54,7002000: 2 buildings , average cost: $64,0001999: 3 buildings , average cost: $80,0001998: 6 buildings , average cost: $48,7001997: 7 buildings , average cost: $53,100Unemployment in December 2023: Here:
3.0%South Carolina:
3.1%
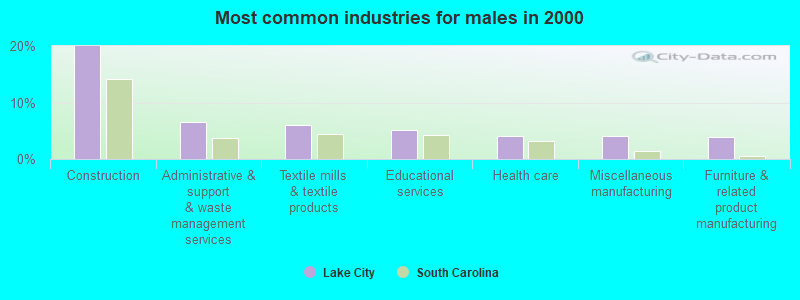
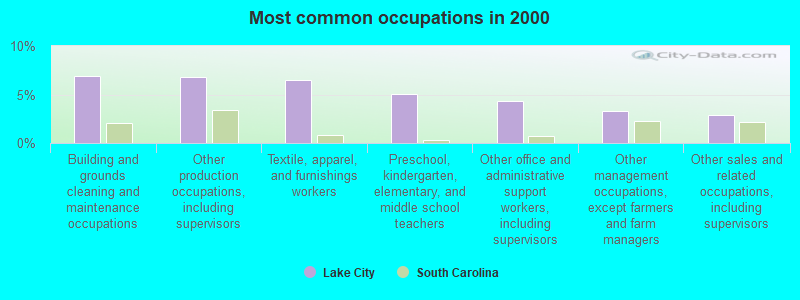
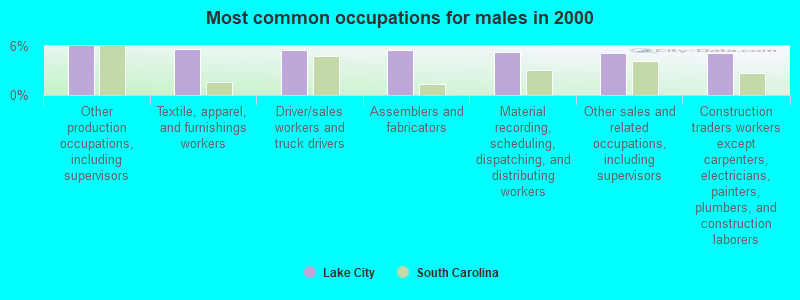
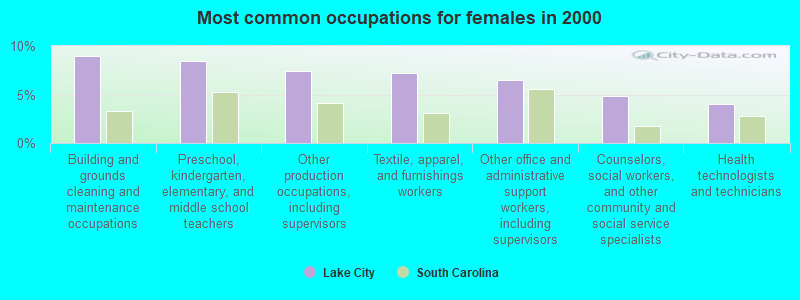
Most common occupations in Lake City, SC (%)
Both Males Females
Building and grounds cleaning and maintenance occupations (6.9%)
Other production occupations, including supervisors (6.8%)
Textile, apparel, and furnishings workers (6.5%)
Preschool, kindergarten, elementary, and middle school teachers (5.0%)
Other office and administrative support workers, including supervisors (4.3%)
Other management occupations, except farmers and farm managers (3.3%)
Other sales and related occupations, including supervisors (2.9%)
Other production occupations, including supervisors (6.0%)
Textile, apparel, and furnishings workers (5.6%)
Driver/sales workers and truck drivers (5.6%)
Assemblers and fabricators (5.5%)
Material recording, scheduling, dispatching, and distributing workers (5.3%)
Other sales and related occupations, including supervisors (5.2%)
Construction traders workers except carpenters, electricians, painters, plumbers, and construction laborers (5.2%)
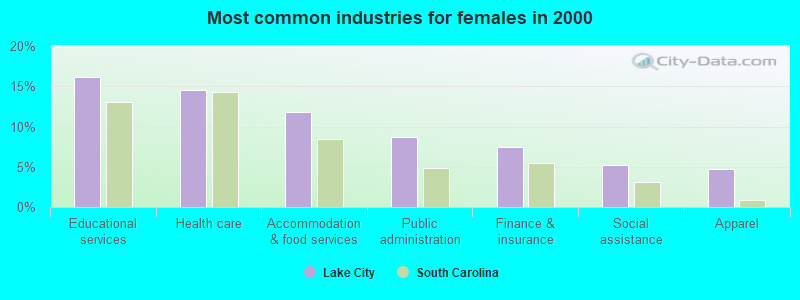
Building and grounds cleaning and maintenance occupations (9.0%)
Preschool, kindergarten, elementary, and middle school teachers (8.5%)
Other production occupations, including supervisors (7.5%)
Textile, apparel, and furnishings workers (7.2%)
Other office and administrative support workers, including supervisors (6.5%)
Counselors, social workers, and other community and social service specialists (4.9%)
Health technologists and technicians (4.0%)
Tornado activity:
Lake City-area historical tornado activity is near South Carolina state average. It is 6% greater than the overall U.S. average.
On 11/7/1995, a category F4 (max. wind speeds 207-260 mph) tornado 31.0 miles away from the Lake City city center injured one person and caused between $500,000 and $5,000,000 in damages.
On 11/24/1967, a category F3 (max. wind speeds 158-206 mph) tornado 31.1 miles away from the city center injured one person and caused between $5000 and $50,000 in damages.
Earthquake activity:
Lake City-area historical earthquake activity is significantly above South Carolina state average. It is 47% smaller than the overall U.S. average. On 11/22/1974 at 05:25:55, a magnitude 4.7 (4.7 MB, Class: Light, Intensity: IV - V) earthquake occurred 70.6 miles away from the city center On 8/23/2011 at 17:51:04, a magnitude 5.8 (5.8 MW, Depth: 3.7 mi, Class: Moderate, Intensity: VI - VII) earthquake occurred 297.6 miles away from the city center On 8/9/2020 at 12:07:37, a magnitude 5.1 (5.1 MW, Depth: 4.7 mi) earthquake occurred 195.6 miles away from Lake City center On 8/2/1974 at 08:52:09, a magnitude 4.9 (4.3 MB, 4.9 LG) earthquake occurred 156.9 miles away from Lake City center On 8/21/1992 at 16:31:55, a magnitude 4.4 (4.1 MB, 4.1 LG, 4.4 LG, Depth: 6.2 mi) earthquake occurred 60.2 miles away from Lake City center On 4/13/1998 at 09:56:11, a magnitude 3.9 (3.5 MB, 3.9 LG, Depth: 3.1 mi, Class: Light, Intensity: II - III) earthquake occurred 65.4 miles away from the city center Magnitude types: regional Lg-wave magnitude (LG), body-wave magnitude (MB), moment magnitude (MW) Natural disasters: The number of natural disasters in Florence County (17) is near the US average (15).Major Disasters (Presidential) Declared: 9Emergencies Declared: 5Hurricanes: 8, Floods: 3, Storms: 3, Winter Storms: 3, Ice Storm: 1, Tropical Storm: 1, Other: 1 (Note: some incidents may be assigned to more than one category). Hospitals and medical centers in Lake City: LAKE CITY COMMUNITY HOSPITAL (Government - Hospital District or Authority, provides emergency services, 258 N RON MCNAIR BLVD) DR RONALD E MCNAIR NURSING AND REHABILITATION CENTER (56 GENESIS DRIVE)
PEE DEE DIALYSIS CENTER (331 ELIZABETH ANNE COURT)
Airports located in Lake City: Amtrak station near Lake City: 15 miles: KINGSTREE (101 E. MAIN ST.) Services: enclosed waiting area, public restrooms, public payphones, call for taxi service, intercity bus service.
Colleges/universities with over 2000 students nearest to Lake City:
Francis Marion University (about 24 miles; Florence, SC ; Full-time enrollment: 3,624)
Florence-Darlington Technical College (about 27 miles; Florence, SC ; FT enrollment: 4,468)
Central Carolina Technical College (about 36 miles; Sumter, SC ; FT enrollment: 3,108)
Coastal Carolina University (about 44 miles; Conway, SC ; FT enrollment: 8,881)
Horry-Georgetown Technical College (about 44 miles; Conway, SC ; FT enrollment: 5,772)
Charleston Southern University (about 64 miles; Charleston, SC ; FT enrollment: 3,012)
University of North Carolina at Pembroke (about 65 miles; Pembroke, NC ; FT enrollment: 5,548)
Public high school in Lake City: LAKE CITY HIGH Students: 849, Location: 652 NORTH MATTHEWS ROAD, Grades: 9-12)Private high school in Lake City: CAROLINA ACADEMY Students: 182, Location: 351 N COUNTRY CLUB RD, Grades: PK-12)
Public elementary/middle schools in Lake City: MAIN STREET ELEMENTARY Students: 375, Location: 318 EAST MAIN STREET, Grades: 3-5)J. PAUL TRULUCK INTERMEDIATE Location: 319 CARLISLE STREET, Grades: 6)
LAKE CITY EARLY CHILDHOOD CENTER Location: 906 MATTHEWS ROAD, Grades: PK-2)
RONALD E. MCNAIR JUNIOR HIGH Location: 311 CARVER STREET, Grades: 7-8)
See full list of schools located in Lake City
Notable locations in Lake City: (A) , Lake City Wastewater Treatment Plant (B) , Lake City City Hall (C) , Lake City Municipal Complex (D) , Lake City Public Library (E) , Robinson Auditorium (F) , Lake City Fire Department (G) , South Lynches Fire Department Station 1 (H) , Lake City Police Department (I) . Display/hide their locations on the map
Shopping Centers: (1) , Lake City Shopping Center (2) . Display/hide their locations on the map
Churches in Lake City include: (A) , Pentecostal Holiness Church (B) , Netties Church (C) , Mount Clair Baptist Church (D) , Lake City United Methodist Church (E) , Lake City Presbyterian Church (F) , First Baptist Church (G) , Church of God (H) , Lake City Pentecostal Holiness Church (I) . Display/hide their locations on the map
Cemeteries: (1) , Lake City Presbyterian Cemetery (2) . Display/hide their locations on the map
Streams, rivers, and creeks: (A) . Display/hide its location on the map
Parks in Lake City include: (1) , Martha Law Municipal Park (2) , Wren Village Municipal Park (3) , Ward Memorial Stadium (4) , Dew Park (5) . Display/hide their locations on the map
Tourist attractions:
Hotel:
Birthplace of: Aubrey Daniels - Psychologist, Darla Moore - Banker, Derrick Burgess - 2005 NFL player (Oakland Raiders, born : Aug 12, 1978), Ronald McNair - Physicist, D. T. Cromer - Baseball player, Tripp Cromer - Baseball player.
Florence County has a predicted average indoor radon screening level less than 2 pCi/L (pico curies per liter) - Low Potential Drinking water stations with addresses in Lake City that have no violations reported:
LAKE CITY CITY OF (2110007) (Population served: 7,879, Primary Water Source Type: Groundwater)
BARRINEAU WATER SYSTEM (1420002) (Population served: 1,747, Primary Water Source Type: Groundwater)
Average household size: This city:
2.6 peopleSouth Carolina:
2.5 people
Percentage of family households: This city:
68.8%Whole state:
67.5%
Percentage of households with unmarried partners: This city:
5.0%Whole state:
6.0%
Likely homosexual households (counted as self-reported same-sex unmarried-partner households)
Lesbian couples: 0.4% of all households Gay men: 0.0% of all households
26 people in other noninstitutional facilities in 2010People in group quarters in Lake City in 2000:
21 people in homes for the mentally retarded
9 people in hospitals/wards and hospices for chronically ill
9 people in other hospitals or wards for chronically ill
4 people in other noninstitutional group quarters
Banks with branches in Lake City (2011 data):
SCBT National Association: Lake City Branch at 266 West Main Street, branch established on 1998/04/08. Info updated 2011/08/01: Bank assets: $3,893.8 mil, Deposits: $3,257.7 mil, headquarters in Orangeburg, SC, positive income , Commercial Lending Specialization, 79 total offices , Holding Company: Scbt Financial Corporation
Wells Fargo Bank, National Association: Lake City Branch at 205 West Main Street, branch established on 1935/03/09. Info updated 2011/04/05: Bank assets: $1,161,490.0 mil, Deposits: $905,653.0 mil, headquarters in Sioux Falls, SD, positive income , 6395 total offices , Holding Company: Wells Fargo & Company
TD Bank, National Association: Lake City Branch at 133 West Main Street, branch established on 1978/07/27. Info updated 2010/10/04: Bank assets: $188,912.6 mil, Deposits: $153,149.8 mil, headquarters in Wilmington, DE, positive income , 1314 total offices , Holding Company: Toronto-Dominion Bank, The
The Citizens Bank: Lake City Branch at 209 East Main Street, branch established on 1987/05/08. Info updated 2011/09/02: Bank assets: $358.7 mil, Deposits: $315.1 mil, headquarters in Olanta, SC, positive income , Commercial Lending Specialization, 16 total offices , Holding Company: Citizens Bancshares Corporation
First Citizens Bank and Trust Company, Inc.: Lake City Branch at 248 West Main Street, branch established on 1934/01/01. Info updated 2011/08/24: Bank assets: $8,104.0 mil, Deposits: $6,880.8 mil, headquarters in Columbia, SC, positive income , 197 total offices , Holding Company: First Citizens Bancorporation, Inc.
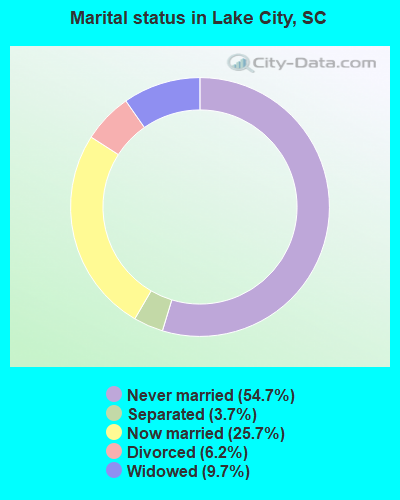
For population 15 years and over in Lake City:
Never married: 54.7%Now married: 25.7%Separated: 3.7%Widowed: 9.7%Divorced: 6.2% For population 25 years and over in Lake City:
High school or higher: 85.2%Bachelor's degree or higher: 21.4%Graduate or professional degree: 4.3%Unemployed: 13.6%Mean travel time to work (commute): 30.2 minutes
Education Gini index (Inequality in education) Here:
11.9South Carolina average:
11.1
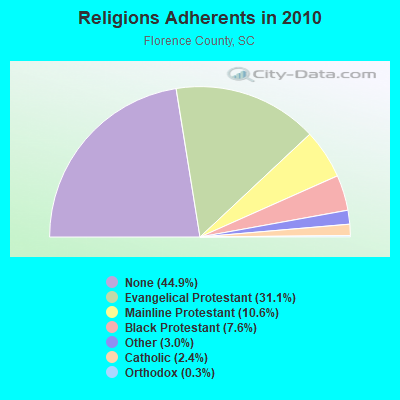
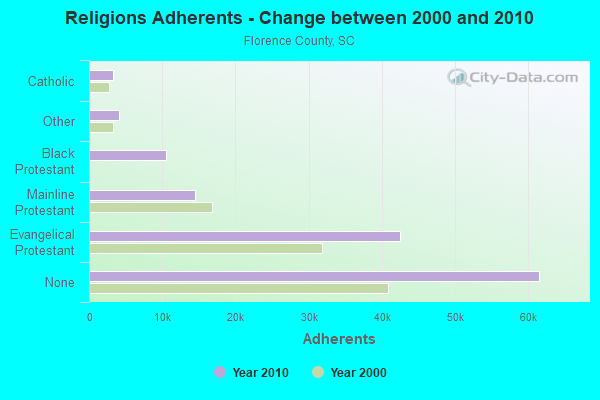
Religion statistics for Lake City, SC (based on Florence County data)
Religion Adherents Congregations Evangelical Protestant 42,527 200 Mainline Protestant 14,522 54 Black Protestant 10,464 36 Other 4,130 7 Catholic 3,320 4 Orthodox 400 1 None 61,522 -
Source: Clifford Grammich, Kirk Hadaway, Richard Houseal, Dale E.Jones, Alexei Krindatch, Richie Stanley and Richard H.Taylor. 2012. 2010 U.S.Religion Census: Religious Congregations & Membership Study. Association of Statisticians of American Religious Bodies. Jones, Dale E., et al. 2002. Congregations and Membership in the United States 2000. Nashville, TN: Glenmary Research Center. Graphs represent county-level data
Food Environment Statistics: Number of grocery stores : 37Florence County :
2.81 / 10,000 pop.State :
1.99 / 10,000 pop.
Number of supercenters and club stores : 2This county :
0.15 / 10,000 pop.South Carolina :
0.15 / 10,000 pop.
Number of convenience stores (no gas) : 14This county :
1.06 / 10,000 pop.State :
0.85 / 10,000 pop.
Number of convenience stores (with gas) : 98Florence County :
7.44 / 10,000 pop.South Carolina :
5.38 / 10,000 pop.
Number of full-service restaurants : 94This county :
7.14 / 10,000 pop.South Carolina :
7.75 / 10,000 pop.
Adult diabetes rate : Florence County :
12.1%South Carolina :
10.6%
Adult obesity rate : This county :
31.7%State :
29.4%
Low-income preschool obesity rate : This county :
15.3%South Carolina :
13.4%
Health and Nutrition: Healthy diet rate : This city:
48.8%South Carolina:
49.2%
Average overall health of teeth and gums : People feeling badly about themselves : Lake City:
18.9%South Carolina:
20.4%
People not drinking alcohol at all : Lake City:
13.7%State:
11.0%
Average hours sleeping at night : Lake City:
6.7South Carolina:
6.8
Overweight people : This city:
36.9%South Carolina:
34.4%
General health condition : Average condition of hearing : This city:
81.5%State:
79.9%
More about Health and Nutrition of Lake City, SC Residents
Local government employment and payroll (March 2022)
Function
Full-time employees
Monthly full-time payroll
Average yearly full-time wage
Part-time employees
Monthly part-time payroll
Streets and Highways
16 $53,903 $40,427 3 $4,634 Police Protection - Officers
16 $60,016 $45,012 0 $0 Firefighters
8 $25,767 $38,651 1 $382 Water Supply
7 $22,355 $38,323 1 $1,749 Financial Administration
6 $28,273 $56,546 0 $0 Police - Other
5 $17,477 $41,945 0 $0 Parks and Recreation
5 $15,616 $37,478 1 $81 Sewerage
5 $20,574 $49,378 0 $0 Fire - Other
2 $11,231 $67,386 0 $0 Judicial and Legal
2 $6,835 $41,010 0 $0 Other Government Administration
2 $8,234 $49,404 0 $0 Housing and Community Development (Local)
2 $6,206 $37,236 0 $0 Solid Waste Management
0 $0 7 $9,221
Totals for Government
76 $276,486 $43,656 13 $16,067
Lake City government finances - Expenditure in 2018 (per resident):
Construction - Regular Highways: $502,000 ($83.72)
General Public Buildings: $106,000 ($17.68)Parks and Recreation: $38,000 ($6.34)Police Protection: $19,000 ($3.17)Current Operations - Electric Utilities: $8,977,000 ($1497.16)
Gas Utilities: $4,731,000 ($789.03)Water Utilities: $1,620,000 ($270.18)Police Protection: $1,430,000 ($238.49)Sewerage: $1,327,000 ($221.31)Local Fire Protection: $758,000 ($126.42)Parks and Recreation: $586,000 ($97.73)General Public Buildings: $512,000 ($85.39)Financial Administration: $461,000 ($76.88)Central Staff Services: $323,000 ($53.87)Regular Highways: $276,000 ($46.03)Solid Waste Management: $257,000 ($42.86)Judicial and Legal Services: $155,000 ($25.85)Miscellaneous Commercial Activities - Other: $57,000 ($9.51)General - Interest on Debt: $641,000 ($106.90)
Intergovernmental to Local - Other - General - Other: $216,000 ($36.02)
Other Capital Outlay - General Public Building: $181,000 ($30.19)
Regular Highways: $122,000 ($20.35)Police Protection: $121,000 ($20.18)Central Staff Services: $100,000 ($16.68)Parks and Recreation: $93,000 ($15.51)Local Fire Protection: $32,000 ($5.34)Financial Administration: $15,000 ($2.50)Total Salaries and Wages: $3,911,000 ($652.27)
Lake City government finances - Revenue in 2018 (per resident):
Charges - Sewerage: $1,593,000 ($265.68)
Solid Waste Management: $262,000 ($43.70)Parks and Recreation: $48,000 ($8.01)Miscellaneous Commercial Activities: $9,000 ($1.50)Federal Intergovernmental - Other: $1,000 ($0.17)
Local Intergovernmental - Electric Utilities: $216,000 ($36.02)
Public Welfare: $82,000 ($13.68)General Local Government Support: $37,000 ($6.17)Other: $26,000 ($4.34)Highways: $25,000 ($4.17)Miscellaneous - Fines and Forfeits: $84,000 ($14.01)
Interest Earnings: $77,000 ($12.84)Sale of Property: $38,000 ($6.34)General Revenue - Other: $22,000 ($3.67)Rents: $17,000 ($2.84)Revenue - Electric Utilities: $9,189,000 ($1532.52)
Gas Utilities: $5,756,000 ($959.97)Water Utilities: $1,955,000 ($326.05)State Intergovernmental - General Local Government Support: $320,000 ($53.37)
Other: $28,000 ($4.67)Tax - Property: $2,661,000 ($443.80)
Occupation and Business License - Other: $1,601,000 ($267.01)Other Selective Sales: $468,000 ($78.05)Other License: $422,000 ($70.38)Public Utility License: $72,000 ($12.01)
Lake City government finances - Debt in 2018 (per resident):
Long Term Debt - Beginning Outstanding - Unspecified Public Purpose: $25,119,000 ($4189.29)
Outstanding Unspecified Public Purpose: $20,726,000 ($3456.64)Retired Unspecified Public Purpose: $4,393,000 ($732.66)
Lake City government finances - Cash and Securities in 2018 (per resident):
Bond Funds - Cash and Securities: $2,656,000 ($442.96)
Other Funds - Cash and Securities: $12,959,000 ($2161.27)
Businesses in Lake City, SC
Name Count Name Count
Advance Auto Parts 1 Nike 3 AutoZone 1 Pizza Hut 1 Burger King 1 RadioShack 1 CVS 1 SONIC Drive-In 1 Days Inn 1 Sears 1 Domino's Pizza 1 Subway 1 FedEx 1 True Value 1 H&R Block 1 U-Haul 1 KFC 1 UPS 1 McDonald's 1 Walmart 1
Strongest AM radio stations in Lake City:
WHYM (1260 AM; 5 kW; LAKE CITY, SC; Owner: GHB OF LAKE CITY, INC.)
WDKD (1310 AM; 5 kW; KINGSTREE, SC; Owner: MILLER COMMUNICATIONS, INC.)
WJMX (970 AM; 10 kW; FLORENCE, SC; Owner: QANTUM OF FLORENCE LICENSE COMPANY, LLC)
WCEO (840 AM; daytime; 50 kW; COLUMBIA, SC; Owner: EASTERN BROADCASTING GROUP, INC.)
WBAJ (890 AM; daytime; 50 kW; BLYTHEWOOD, SC; Owner: FAMILY FIRST)
WQTK (950 AM; 10 kW; MONCKS CORNER, SC; Owner: KIRKMAN BROADCASTING, INC.)
WIQB (1050 AM; 25 kW; CONWAY, SC; Owner: CUMULUS LICENSING CORP.)
WAGL (1560 AM; daytime; 50 kW; LANCASTER, SC; Owner: PALMETTO BROADCASTING SYSTEM, INC.)
WBT (1110 AM; 50 kW; CHARLOTTE, NC; Owner: JEFFERSON-PILOT COMMUNICATNS CO. OF NORTH CAROLINA)
WPTF (680 AM; 50 kW; RALEIGH, NC; Owner: FIRST STATE COMMUNICATIONS)
WJAY (1280 AM; 4 kW; MULLINS, SC; Owner: THE GREATER HWY CHURCH OF CHRIST)
WQJM (1450 AM; 10 kW; MYRTLE BEACH, SC; Owner: NM LICENSING, LLC)
WPJS (1330 AM; 5 kW; CONWAY, SC; Owner: WPJS BROADCASTING, INC.)
Strongest FM radio stations in Lake City:
WMXT (102.1 FM; PAMPLICO, SC; Owner: CUMULUS LICENSING CORP.)
WWFN (100.1 FM; LAKE CITY, SC; Owner: CUMULUS LICENSING CORP.)
WCSQ (92.5 FM; MONCKS CORNER, SC; Owner: APEX BROADCASTING, INC.)
WURV (102.9 FM; SCRANTON, SC; Owner: QANTUM OF FLORENCE LICENSE COMPANY, LLC)
WWKT-FM (99.3 FM; KINGSTREE, SC; Owner: MILLER COMMUNICATIONS, INC.)
WEGX (92.9 FM; DILLON, SC; Owner: QANTUM OF FLORENCE LICENSE COMPANY, LLC)
WRJA-FM (88.1 FM; SUMTER, SC; Owner: SOUTH CAROLINA EDUCATIONAL TV COMMISSION)
WPDT (105.1 FM; JOHNSONVILLE, SC; Owner: GLORY COMMUNICATIONS, INC.)
WGSS (94.1 FM; KINGSTREE, SC; Owner: QANTUM OF FLORENCE LICENSE COMPANY, LLC)
WLPG (91.7 FM; FLORENCE, SC; Owner: AUGUSTA RADIO FELLOWSHIP INSTITUTE, INC.)
WYNN-FM (106.3 FM; FLORENCE, SC; Owner: CUMULUS LICENSING CORP.)
WSIM (93.7 FM; BISHOPVILLE, SC; Owner: MILLER COMMUNICATIONS, INC.)
WLGI (90.9 FM; HEMINGWAY, SC; Owner: LOUIS G. GREGORY BAHA'I INSTITUTE)
TV broadcast stations around Lake City:
WPDE-TV (Channel 15; FLORENCE, SC; Owner: GRAND STRAND COMMUNICATIONS)
WWMB (Channel 21; FLORENCE, SC; Owner: ATLANTIC MEDIA GROUP, INC.)
WRJA-TV (Channel 27; SUMTER, SC; Owner: SOUTH CAROLINA EDUCATIONAL TV COMMISSION)
WBTW (Channel 13; FLORENCE, SC; Owner: MEDIA GENERAL BROADCASTING OF SO. CAROLINA HOLDINGS, INC.)
WPDF-LP (Channel 56; FLORENCE, SC; Owner: GE MEDIA, INC.)
W66DE (Channel 50; FLORENCE, SC; Owner: CAROLINA CHRISTIAN BROADCASTING, INC.)
WJPM-TV (Channel 33; FLORENCE, SC; Owner: SOUTH CAROLINA EDUCATIONAL TV COMMISSION)
WSFX-TV (Channel 26; WILMINGTON, NC; Owner: SOUTHEASTERN MEDIA HOLDINGS, INC.)
WFXB (Channel 43; MYRTLE BEACH, SC; Owner: GE MEDIA, INC.)
WHMC (Channel 23; CONWAY, SC; Owner: SOUTH CAROLINA EDUCATIONAL TV COMMISSION)
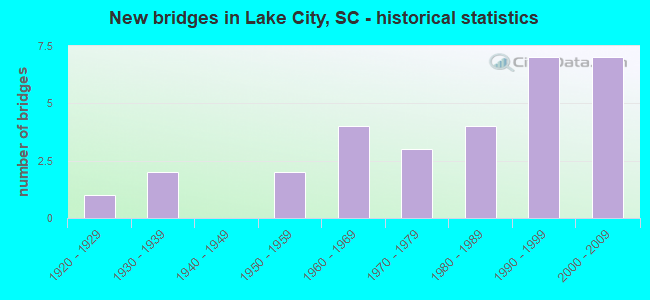
National Bridge Inventory (NBI) Statistics 30 Number of bridges259ft / 78.6m Total length $1,163,000 Total costs93,750 Total average daily traffic7,503 Total average daily truck traffic
New bridges - historical statistics
1 1920-1929 2 1930-1939 2 1950-1959 4 1960-1969 3 1970-1979 4 1980-1989 7 1990-1999 7 2000-2009
See full National Bridge Inventory statistics for Lake City, SC
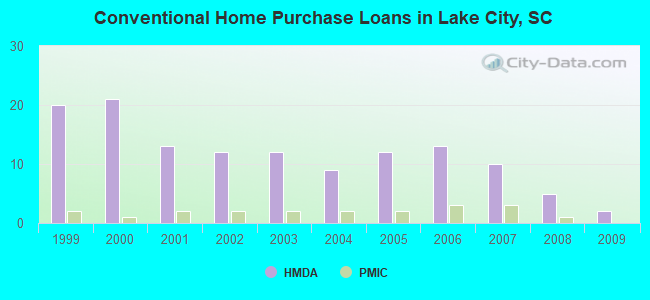
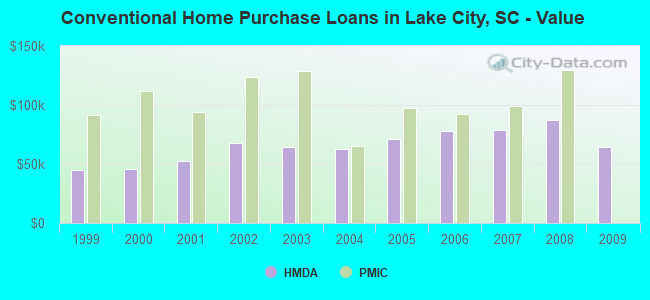
Home Mortgage Disclosure Act Aggregated Statistics For Year 2009(Based on 2 partial tracts) A) FHA, FSA/RHS & VA B) Conventional C) Refinancings D) Home Improvement Loans F) Non-occupant Loans on G) Loans On Manufactured Number Average Value Number Average Value Number Average Value Number Average Value Number Average Value Number Average Value
LOANS ORIGINATED 2 $119,740 2 $64,395 9 $129,143 3 $36,323 2 $54,320 1 $27,920 APPLICATIONS APPROVED, NOT ACCEPTED 0 $0 0 $0 2 $97,270 0 $0 0 $0 0 $0 APPLICATIONS DENIED 1 $40,450 2 $43,035 10 $86,422 0 $0 1 $33,810 1 $51,540 APPLICATIONS WITHDRAWN 1 $130,940 0 $0 3 $157,290 0 $0 0 $0 0 $0 FILES CLOSED FOR INCOMPLETENESS 0 $0 0 $0 1 $79,690 0 $0 0 $0 0 $0
Aggregated Statistics For Year 2008(Based on 2 partial tracts) A) FHA, FSA/RHS & VA B) Conventional C) Refinancings D) Home Improvement Loans F) Non-occupant Loans on G) Loans On Manufactured Number Average Value Number Average Value Number Average Value Number Average Value Number Average Value Number Average Value
LOANS ORIGINATED 2 $75,550 5 $86,974 12 $99,284 4 $26,690 6 $74,502 2 $40,400 APPLICATIONS APPROVED, NOT ACCEPTED 0 $0 0 $0 2 $98,640 0 $0 0 $0 1 $48,760 APPLICATIONS DENIED 0 $0 4 $51,188 13 $82,533 3 $22,480 1 $67,080 2 $34,670 APPLICATIONS WITHDRAWN 1 $79,700 0 $0 5 $87,516 0 $0 0 $0 0 $0 FILES CLOSED FOR INCOMPLETENESS 1 $61,540 0 $0 1 $167,920 0 $0 0 $0 0 $0
Aggregated Statistics For Year 2007(Based on 2 partial tracts) A) FHA, FSA/RHS & VA B) Conventional C) Refinancings D) Home Improvement Loans F) Non-occupant Loans on G) Loans On Manufactured Number Average Value Number Average Value Number Average Value Number Average Value Number Average Value Number Average Value
LOANS ORIGINATED 0 $0 10 $78,963 12 $93,272 4 $39,545 4 $67,785 2 $25,375 APPLICATIONS APPROVED, NOT ACCEPTED 0 $0 1 $94,210 3 $70,397 1 $69,160 1 $41,120 1 $56,050 APPLICATIONS DENIED 0 $0 7 $67,137 21 $77,878 5 $37,000 3 $48,607 2 $50,555 APPLICATIONS WITHDRAWN 1 $92,900 3 $116,197 5 $86,016 0 $0 0 $0 0 $0 FILES CLOSED FOR INCOMPLETENESS 0 $0 1 $90,070 2 $78,215 0 $0 0 $0 0 $0
Aggregated Statistics For Year 2006(Based on 2 partial tracts) A) FHA, FSA/RHS & VA B) Conventional C) Refinancings D) Home Improvement Loans F) Non-occupant Loans on G) Loans On Manufactured Number Average Value Number Average Value Number Average Value Number Average Value Number Average Value Number Average Value
LOANS ORIGINATED 0 $0 13 $78,198 10 $82,526 5 $17,530 5 $61,718 2 $26,030 APPLICATIONS APPROVED, NOT ACCEPTED 0 $0 2 $90,095 4 $76,575 0 $0 0 $0 1 $13,760 APPLICATIONS DENIED 1 $31,540 11 $54,579 15 $85,555 4 $32,888 3 $30,210 5 $39,068 APPLICATIONS WITHDRAWN 0 $0 2 $86,020 8 $83,082 1 $25,620 0 $0 0 $0 FILES CLOSED FOR INCOMPLETENESS 0 $0 0 $0 1 $77,740 0 $0 0 $0 0 $0
Aggregated Statistics For Year 2005(Based on 2 partial tracts) A) FHA, FSA/RHS & VA B) Conventional C) Refinancings D) Home Improvement Loans F) Non-occupant Loans on G) Loans On Manufactured Number Average Value Number Average Value Number Average Value Number Average Value Number Average Value Number Average Value
LOANS ORIGINATED 1 $54,810 12 $71,497 16 $88,232 7 $19,186 5 $55,138 2 $22,680 APPLICATIONS APPROVED, NOT ACCEPTED 0 $0 2 $59,450 5 $79,220 1 $25,110 1 $39,170 1 $37,330 APPLICATIONS DENIED 1 $65,470 13 $51,176 17 $87,575 3 $58,687 1 $87,330 7 $36,579 APPLICATIONS WITHDRAWN 0 $0 4 $97,585 10 $98,026 1 $105,210 2 $88,815 0 $0 FILES CLOSED FOR INCOMPLETENESS 0 $0 0 $0 3 $110,640 0 $0 0 $0 0 $0
Aggregated Statistics For Year 2004(Based on 2 partial tracts) A) FHA, FSA/RHS & VA B) Conventional C) Refinancings D) Home Improvement Loans F) Non-occupant Loans on G) Loans On Manufactured Number Average Value Number Average Value Number Average Value Number Average Value Number Average Value Number Average Value
LOANS ORIGINATED 1 $64,120 9 $62,682 15 $86,740 3 $25,827 5 $47,340 2 $30,715 APPLICATIONS APPROVED, NOT ACCEPTED 0 $0 2 $60,000 5 $74,440 0 $0 1 $76,560 1 $29,200 APPLICATIONS DENIED 0 $0 8 $66,381 21 $76,183 2 $31,835 2 $72,875 3 $42,090 APPLICATIONS WITHDRAWN 0 $0 1 $110,040 5 $100,268 1 $26,100 0 $0 0 $0 FILES CLOSED FOR INCOMPLETENESS 0 $0 0 $0 4 $76,092 0 $0 0 $0 0 $0
Aggregated Statistics For Year 2003(Based on 2 partial tracts) A) FHA, FSA/RHS & VA B) Conventional C) Refinancings D) Home Improvement Loans F) Non-occupant Loans on Number Average Value Number Average Value Number Average Value Number Average Value Number Average Value
LOANS ORIGINATED 1 $82,180 12 $64,743 25 $78,210 5 $18,908 6 $40,997 APPLICATIONS APPROVED, NOT ACCEPTED 0 $0 4 $51,600 9 $73,812 0 $0 0 $0 APPLICATIONS DENIED 0 $0 10 $53,639 20 $66,641 3 $19,313 1 $30,470 APPLICATIONS WITHDRAWN 0 $0 1 $110,900 7 $75,847 0 $0 0 $0 FILES CLOSED FOR INCOMPLETENESS 0 $0 0 $0 1 $101,110 0 $0 0 $0
Aggregated Statistics For Year 2002(Based on 2 partial tracts) A) FHA, FSA/RHS & VA B) Conventional C) Refinancings D) Home Improvement Loans F) Non-occupant Loans on Number Average Value Number Average Value Number Average Value Number Average Value Number Average Value
LOANS ORIGINATED 1 $48,890 12 $68,175 20 $66,042 8 $10,835 5 $40,358 APPLICATIONS APPROVED, NOT ACCEPTED 0 $0 3 $41,747 6 $75,213 0 $0 0 $0 APPLICATIONS DENIED 1 $43,680 17 $38,991 17 $61,789 3 $19,420 1 $64,710 APPLICATIONS WITHDRAWN 0 $0 1 $93,720 5 $66,124 1 $6,720 0 $0 FILES CLOSED FOR INCOMPLETENESS 0 $0 0 $0 2 $81,175 0 $0 0 $0
Aggregated Statistics For Year 2001(Based on 2 partial tracts) A) FHA, FSA/RHS & VA B) Conventional C) Refinancings D) Home Improvement Loans F) Non-occupant Loans on Number Average Value Number Average Value Number Average Value Number Average Value Number Average Value
LOANS ORIGINATED 1 $71,610 13 $52,395 25 $64,234 6 $9,770 7 $33,213 APPLICATIONS APPROVED, NOT ACCEPTED 0 $0 5 $40,580 7 $64,897 0 $0 0 $0 APPLICATIONS DENIED 0 $0 23 $38,069 27 $49,476 3 $15,623 2 $40,550 APPLICATIONS WITHDRAWN 0 $0 1 $104,690 7 $64,191 1 $55,700 0 $0 FILES CLOSED FOR INCOMPLETENESS 0 $0 0 $0 1 $47,110 0 $0 0 $0
Aggregated Statistics For Year 2000(Based on 2 partial tracts) A) FHA, FSA/RHS & VA B) Conventional C) Refinancings D) Home Improvement Loans F) Non-occupant Loans on Number Average Value Number Average Value Number Average Value Number Average Value Number Average Value
LOANS ORIGINATED 0 $0 21 $45,850 18 $52,314 4 $13,942 5 $44,310 APPLICATIONS APPROVED, NOT ACCEPTED 1 $30,880 10 $43,548 7 $50,644 1 $12,640 0 $0 APPLICATIONS DENIED 1 $16,810 59 $32,788 31 $51,397 5 $18,250 1 $48,150 APPLICATIONS WITHDRAWN 0 $0 3 $61,127 9 $49,721 1 $20,330 0 $0 FILES CLOSED FOR INCOMPLETENESS 0 $0 1 $21,750 1 $56,540 0 $0 0 $0
Aggregated Statistics For Year 1999(Based on 2 partial tracts) A) FHA, FSA/RHS & VA B) Conventional C) Refinancings D) Home Improvement Loans F) Non-occupant Loans on Number Average Value Number Average Value Number Average Value Number Average Value Number Average Value
LOANS ORIGINATED 1 $50,930 20 $45,174 22 $49,070 3 $21,557 4 $36,645 APPLICATIONS APPROVED, NOT ACCEPTED 0 $0 12 $42,538 8 $45,809 0 $0 1 $62,590 APPLICATIONS DENIED 0 $0 68 $38,546 31 $50,431 4 $14,992 3 $33,060 APPLICATIONS WITHDRAWN 0 $0 3 $47,890 12 $50,272 1 $40,720 1 $32,960 FILES CLOSED FOR INCOMPLETENESS 0 $0 1 $38,890 3 $58,757 0 $0 0 $0
Detailed HMDA statistics for the following Tracts:
0022.01
, 0022.02
Private Mortgage Insurance Companies Aggregated Statistics For Year 2008(Based on 2 partial tracts) A) Conventional B) Refinancings Number Average Value Number Average Value
LOANS ORIGINATED 1 $129,620 0 $0 APPLICATIONS APPROVED, NOT ACCEPTED 0 $0 1 $99,350 APPLICATIONS DENIED 0 $0 0 $0 APPLICATIONS WITHDRAWN 0 $0 0 $0 FILES CLOSED FOR INCOMPLETENESS 0 $0 0 $0
Aggregated Statistics For Year 2007(Based on 2 partial tracts) A) Conventional B) Refinancings Number Average Value Number Average Value
LOANS ORIGINATED 3 $98,847 1 $127,670 APPLICATIONS APPROVED, NOT ACCEPTED 1 $68,980 0 $0 APPLICATIONS DENIED 0 $0 0 $0 APPLICATIONS WITHDRAWN 0 $0 0 $0 FILES CLOSED FOR INCOMPLETENESS 0 $0 0 $0
Aggregated Statistics For Year 2006(Based on 2 partial tracts) A) Conventional B) Refinancings C) Non-occupant Loans on Number Average Value Number Average Value Number Average Value
LOANS ORIGINATED 3 $91,957 1 $78,670 1 $67,600 APPLICATIONS APPROVED, NOT ACCEPTED 0 $0 0 $0 0 $0 APPLICATIONS DENIED 0 $0 0 $0 0 $0 APPLICATIONS WITHDRAWN 0 $0 0 $0 0 $0 FILES CLOSED FOR INCOMPLETENESS 0 $0 0 $0 0 $0
Aggregated Statistics For Year 2005(Based on 2 partial tracts) A) Conventional B) Refinancings Number Average Value Number Average Value
LOANS ORIGINATED 2 $97,360 2 $114,465 APPLICATIONS APPROVED, NOT ACCEPTED 0 $0 0 $0 APPLICATIONS DENIED 0 $0 0 $0 APPLICATIONS WITHDRAWN 0 $0 0 $0 FILES CLOSED FOR INCOMPLETENESS 0 $0 0 $0
Aggregated Statistics For Year 2004(Based on 2 partial tracts) A) Conventional B) Refinancings Number Average Value Number Average Value
LOANS ORIGINATED 2 $65,290 1 $141,630 APPLICATIONS APPROVED, NOT ACCEPTED 0 $0 0 $0 APPLICATIONS DENIED 0 $0 0 $0 APPLICATIONS WITHDRAWN 0 $0 0 $0 FILES CLOSED FOR INCOMPLETENESS 0 $0 0 $0
Aggregated Statistics For Year 2003(Based on 2 partial tracts) A) Conventional B) Refinancings Number Average Value Number Average Value
LOANS ORIGINATED 2 $129,200 2 $149,900 APPLICATIONS APPROVED, NOT ACCEPTED 1 $124,630 0 $0 APPLICATIONS DENIED 0 $0 0 $0 APPLICATIONS WITHDRAWN 0 $0 0 $0 FILES CLOSED FOR INCOMPLETENESS 0 $0 0 $0
Aggregated Statistics For Year 2002(Based on 2 partial tracts) A) Conventional B) Refinancings Number Average Value Number Average Value
LOANS ORIGINATED 2 $123,575 3 $113,013 APPLICATIONS APPROVED, NOT ACCEPTED 0 $0 1 $104,220 APPLICATIONS DENIED 0 $0 0 $0 APPLICATIONS WITHDRAWN 0 $0 0 $0 FILES CLOSED FOR INCOMPLETENESS 0 $0 0 $0
Aggregated Statistics For Year 2001(Based on 2 partial tracts) A) Conventional B) Refinancings Number Average Value Number Average Value
LOANS ORIGINATED 2 $94,420 3 $90,103 APPLICATIONS APPROVED, NOT ACCEPTED 0 $0 1 $51,320 APPLICATIONS DENIED 0 $0 1 $61,950 APPLICATIONS WITHDRAWN 0 $0 0 $0 FILES CLOSED FOR INCOMPLETENESS 0 $0 0 $0
Aggregated Statistics For Year 2000(Based on 2 partial tracts) A) Conventional Number Average Value
LOANS ORIGINATED 1 $111,820 APPLICATIONS APPROVED, NOT ACCEPTED 0 $0 APPLICATIONS DENIED 0 $0 APPLICATIONS WITHDRAWN 0 $0 FILES CLOSED FOR INCOMPLETENESS 0 $0
Aggregated Statistics For Year 1999(Based on 2 partial tracts) A) Conventional B) Refinancings Number Average Value Number Average Value
LOANS ORIGINATED 2 $91,490 2 $109,815 APPLICATIONS APPROVED, NOT ACCEPTED 0 $0 0 $0 APPLICATIONS DENIED 0 $0 0 $0 APPLICATIONS WITHDRAWN 0 $0 0 $0 FILES CLOSED FOR INCOMPLETENESS 0 $0 0 $0
Detailed PMIC statistics for the following Tracts:
0022.01
, 0022.02
Most common first names in Lake City, SC among deceased individuals Name Count Lived (average)
James 128 66.3 years John 111 69.3 years Mary 102 76.1 years William 86 69.7 years Willie 81 66.8 years Robert 56 68.3 years Henry 44 71.7 years Annie 41 76.2 years Samuel 35 66.3 years David 35 62.5 years
Most common last names in Lake City, SC among deceased individuals Last name Count Lived (average)
Graham 147 71.8 years Brown 125 71.1 years Singletary 102 70.8 years Floyd 102 70.6 years Cooper 99 72.1 years Mcfadden 89 70.6 years Burgess 71 69.5 years Mckenzie 69 70.1 years Hanna 66 72.2 years Fulmore 57 68.7 years
Lake City compared to South Carolina state average:
Median household income below state average. Median house value below state average. Black race population percentage above state average. Hispanic race population percentage significantly below state average. Foreign-born population percentage significantly below state average. Renting percentage above state average. Length of stay since moving in significantly above state average. House age above state average. Number of college students below state average.
#22 on the list of "Top 101 cities with largest percentage of females in industries: information (population 5,000+)"
#23 on the list of "Top 101 cities with the least cars per house, population 5,000+"
#30 on the list of "Top 101 cities with the largest household incomes disparities (population 5,000+)"
#67 on the list of "Top 101 cities with the largest percentage of people in dormitories (population 1,000+)"
#67 on the list of "Top 101 cities with the largest percentage of people in group homes (population 1,000+)"
#67 on the list of "Top 101 cities with the largest percentage of people in hospitals/wards, hospices, and schools for the handicapped (population 1,000+)"
#67 on the list of "Top 101 cities with the largest percentage of people in long-term care (population 1,000+)"
#67 on the list of "Top 101 cities with the largest percentage of people in military quarters (population 1,000+)"
#67 on the list of "Top 101 cities with the largest percentage of people in noninstitutionalized settings (population 1,000+)"
#67 on the list of "Top 101 cities with the largest percentage of people in on base quarters (population 1,000+)"
#67 on the list of "Top 101 cities with the largest percentage of people in schools, hospitals, or wards for the physically handicapped (population 1,000+)"
#74 on the list of "Top 101 cities with the largest percentage of people in wards in military hospitals for patients who have no usual home elsewhere (population 1,000+)"
#78 on the list of "Top 101 cities with the highest percentage of English-only speaking households, population 5,000+"
#82 on the list of "Top 101 cities with the largest percentage of people in military disciplinary barracks (population 1,000+)"
#84 on the list of "Top 101 cities with the largest percentage of people in military hospitals or wards for chronically ill (population 1,000+)"
#86 on the list of "Top 101 cities with the largest percentage of people in institutions for the deaf (population 1,000+)"
#89 on the list of "Top 101 cities with the largest percentage of people in crews of maritime vessels (population 1,000+)"
#90 on the list of "Top 101 cities with the largest percentage of people in institutions for the blind (population 1,000+)"
#95 on the list of "Top 100 least-safe cities (highest city-data.com crime index) (pop. 5,000+)"
#99 on the list of "Top 101 cities with the largest percentage of people in military ships (population 1,000+)"
#23 (29560) on the list of "Top 101 zip codes with the largest percentage of Scotch-Irish first ancestries (pop 5,000+)"
#55 on the list of "Top 101 counties with the smallest number of people without health insurance coverage in 2000 (pop. 50,000+)"
#62 on the list of "Top 101 counties with the smallest number of children under 18 without health insurance coverage in 2000 (pop. 50,000+)"
#89 on the list of "Top 101 counties with the most Black Protestant adherents"
#101 on the list of "Top 101 counties with the most Black Protestant congregations"
There are 13 pilots and no other airmen in this city.


 Recent articles from our blog. Our writers, many of them Ph.D. graduates or candidates, create easy-to-read articles on a wide variety of topics.

 (69.6 miles
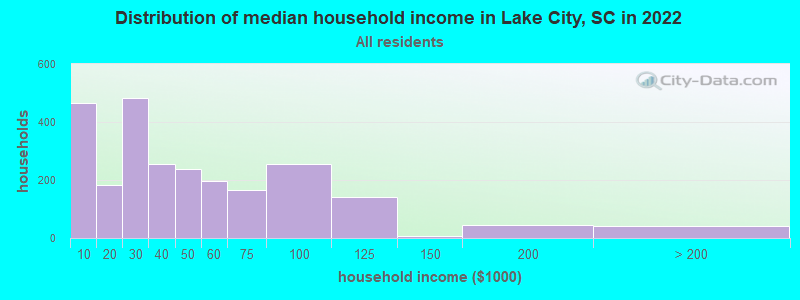


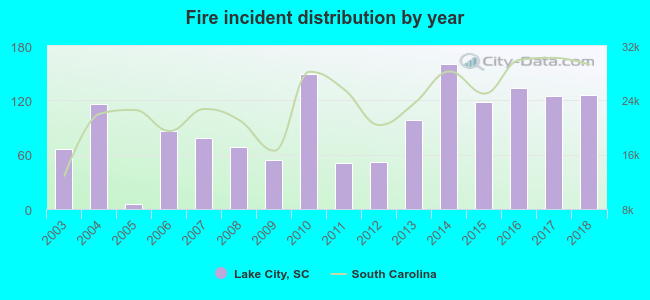 Based on the data from the years 2003 - 2018 the average number of fire incidents per year is 93. The highest number of reported fire incidents - 160 took place in 2014, and the least - 6 in 2005. The data has a rising trend.
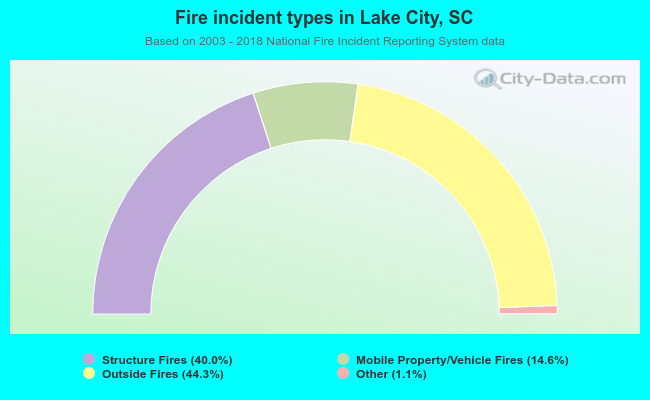 When looking into fire subcategories, the most reports belonged to: Outside Fires (44.3%), and Structure Fires (40.0%).