Yaphank, New York Submit your own pictures of this place and show them to the world
OSM Map
General Map
Google Map
MSN Map
OSM Map
General Map
Google Map
MSN Map
OSM Map
General Map
Google Map
MSN Map
OSM Map
General Map
Google Map
MSN Map
Please wait while loading the map...
Population in 2010: 5,945. Population change since 2000: +18.3%Males: 3,180 Females: 2,765
March 2022 cost of living index in Yaphank: 150.8 (very high, U.S. average is 100) Percentage of residents living in poverty in 2022: 2.7%for White Non-Hispanic residents , 1.1% for Black residents , 4.3% for Hispanic or Latino residents , 12.9% for other race residents , 4.3% for two or more races residents )
Profiles of local businesses
Business Search - 14 Million verified businesses
Data:
Median household income ($)
Median household income (% change since 2000)
Household income diversity
Ratio of average income to average house value (%)
Ratio of average income to average rent
Median household income ($) - White
Median household income ($) - Black or African American
Median household income ($) - Asian
Median household income ($) - Hispanic or Latino
Median household income ($) - American Indian and Alaska Native
Median household income ($) - Multirace
Median household income ($) - Other Race
Median household income for houses/condos with a mortgage ($)
Median household income for apartments without a mortgage ($)
Races - White alone (%)
Races - White alone (% change since 2000)
Races - Black alone (%)
Races - Black alone (% change since 2000)
Races - American Indian alone (%)
Races - American Indian alone (% change since 2000)
Races - Asian alone (%)
Races - Asian alone (% change since 2000)
Races - Hispanic (%)
Races - Hispanic (% change since 2000)
Races - Native Hawaiian and Other Pacific Islander alone (%)
Races - Native Hawaiian and Other Pacific Islander alone (% change since 2000)
Races - Two or more races (%)
Races - Two or more races (% change since 2000)
Races - Other race alone (%)
Races - Other race alone (% change since 2000)
Racial diversity
Unemployment (%)
Unemployment (% change since 2000)
Unemployment (%) - White
Unemployment (%) - Black or African American
Unemployment (%) - Asian
Unemployment (%) - Hispanic or Latino
Unemployment (%) - American Indian and Alaska Native
Unemployment (%) - Multirace
Unemployment (%) - Other Race
Population density (people per square mile)
Population - Males (%)
Population - Females (%)
Population - Males (%) - White
Population - Males (%) - Black or African American
Population - Males (%) - Asian
Population - Males (%) - Hispanic or Latino
Population - Males (%) - American Indian and Alaska Native
Population - Males (%) - Multirace
Population - Males (%) - Other Race
Population - Females (%) - White
Population - Females (%) - Black or African American
Population - Females (%) - Asian
Population - Females (%) - Hispanic or Latino
Population - Females (%) - American Indian and Alaska Native
Population - Females (%) - Multirace
Population - Females (%) - Other Race
Coronavirus confirmed cases (Jul 02, 2024)
Deaths caused by coronavirus (Jul 02, 2024)
Coronavirus confirmed cases (per 100k population) (Jul 02, 2024)
Deaths caused by coronavirus (per 100k population) (Jul 02, 2024)
Daily increase in number of cases (Jul 02, 2024)
Weekly increase in number of cases (Jul 02, 2024)
Cases doubled (in days) (Jul 02, 2024)
Hospitalized patients (Apr 18, 2022)
Negative test results (Apr 18, 2022)
Total test results (Apr 18, 2022)
COVID Vaccine doses distributed (per 100k population) (Sep 19, 2023)
COVID Vaccine doses administered (per 100k population) (Sep 19, 2023)
COVID Vaccine doses distributed (Sep 19, 2023)
COVID Vaccine doses administered (Sep 19, 2023)
Likely homosexual households (%)
Likely homosexual households (% change since 2000)
Likely homosexual households - Lesbian couples (%)
Likely homosexual households - Lesbian couples (% change since 2000)
Likely homosexual households - Gay men (%)
Likely homosexual households - Gay men (% change since 2000)
Cost of living index
Median gross rent ($)
Median contract rent ($)
Median monthly housing costs ($)
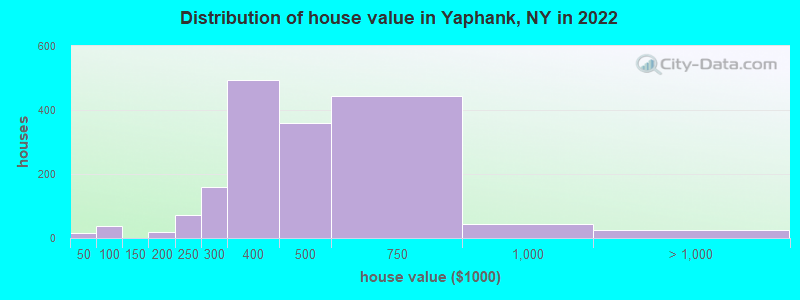
Median house or condo value ($)
Median house or condo value ($ change since 2000)
Mean house or condo value by units in structure - 1, detached ($)
Mean house or condo value by units in structure - 1, attached ($)
Mean house or condo value by units in structure - 2 ($)
Mean house or condo value by units in structure by units in structure - 3 or 4 ($)
Mean house or condo value by units in structure - 5 or more ($)
Mean house or condo value by units in structure - Boat, RV, van, etc. ($)
Mean house or condo value by units in structure - Mobile home ($)
Median house or condo value ($) - White
Median house or condo value ($) - Black or African American
Median house or condo value ($) - Asian
Median house or condo value ($) - Hispanic or Latino
Median house or condo value ($) - American Indian and Alaska Native
Median house or condo value ($) - Multirace
Median house or condo value ($) - Other Race
Median resident age
Resident age diversity
Median resident age - Males
Median resident age - Females
Median resident age - White
Median resident age - Black or African American
Median resident age - Asian
Median resident age - Hispanic or Latino
Median resident age - American Indian and Alaska Native
Median resident age - Multirace
Median resident age - Other Race
Median resident age - Males - White
Median resident age - Males - Black or African American
Median resident age - Males - Asian
Median resident age - Males - Hispanic or Latino
Median resident age - Males - American Indian and Alaska Native
Median resident age - Males - Multirace
Median resident age - Males - Other Race
Median resident age - Females - White
Median resident age - Females - Black or African American
Median resident age - Females - Asian
Median resident age - Females - Hispanic or Latino
Median resident age - Females - American Indian and Alaska Native
Median resident age - Females - Multirace
Median resident age - Females - Other Race
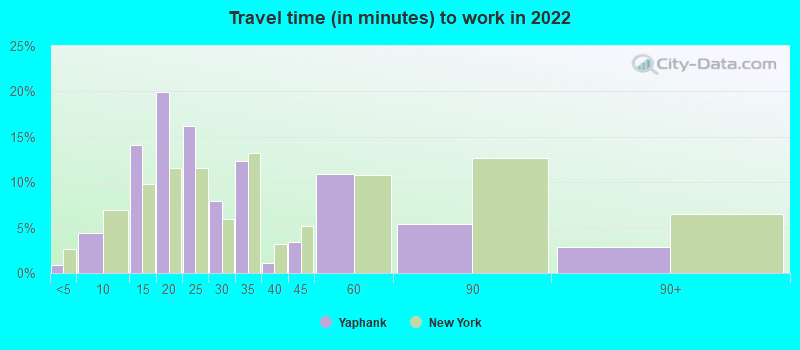
Commute - mean travel time to work (minutes)
Travel time to work - Less than 5 minutes (%)
Travel time to work - Less than 5 minutes (% change since 2000)
Travel time to work - 5 to 9 minutes (%)
Travel time to work - 5 to 9 minutes (% change since 2000)
Travel time to work - 10 to 19 minutes (%)
Travel time to work - 10 to 19 minutes (% change since 2000)
Travel time to work - 20 to 29 minutes (%)
Travel time to work - 20 to 29 minutes (% change since 2000)
Travel time to work - 30 to 39 minutes (%)
Travel time to work - 30 to 39 minutes (% change since 2000)
Travel time to work - 40 to 59 minutes (%)
Travel time to work - 40 to 59 minutes (% change since 2000)
Travel time to work - 60 to 89 minutes (%)
Travel time to work - 60 to 89 minutes (% change since 2000)
Travel time to work - 90 or more minutes (%)
Travel time to work - 90 or more minutes (% change since 2000)
Marital status - Never married (%)
Marital status - Now married (%)
Marital status - Separated (%)
Marital status - Widowed (%)
Marital status - Divorced (%)
Median family income ($)
Median family income (% change since 2000)
Median non-family income ($)
Median non-family income (% change since 2000)
Median per capita income ($)
Median per capita income (% change since 2000)
Median family income ($) - White
Median family income ($) - Black or African American
Median family income ($) - Asian
Median family income ($) - Hispanic or Latino
Median family income ($) - American Indian and Alaska Native
Median family income ($) - Multirace
Median family income ($) - Other Race
Median year house/condo built
Median year apartment built
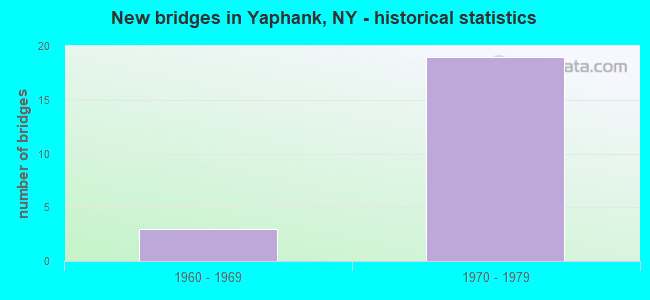
Year house built - Built 2005 or later (%)
Year house built - Built 2000 to 2004 (%)
Year house built - Built 1990 to 1999 (%)
Year house built - Built 1980 to 1989 (%)
Year house built - Built 1970 to 1979 (%)
Year house built - Built 1960 to 1969 (%)
Year house built - Built 1950 to 1959 (%)
Year house built - Built 1940 to 1949 (%)
Year house built - Built 1939 or earlier (%)
Average household size
Household density (households per square mile)
Average household size - White
Average household size - Black or African American
Average household size - Asian
Average household size - Hispanic or Latino
Average household size - American Indian and Alaska Native
Average household size - Multirace
Average household size - Other Race
Occupied housing units (%)
Vacant housing units (%)
Owner occupied housing units (%)
Renter occupied housing units (%)
Vacancy status - For rent (%)
Vacancy status - For sale only (%)
Vacancy status - Rented or sold, not occupied (%)
Vacancy status - For seasonal, recreational, or occasional use (%)
Vacancy status - For migrant workers (%)
Vacancy status - Other vacant (%)
Residents with income below the poverty level (%)
Residents with income below 50% of the poverty level (%)
Children below poverty level (%)
Poor families by family type - Married-couple family (%)
Poor families by family type - Male, no wife present (%)
Poor families by family type - Female, no husband present (%)
Poverty status for native-born residents (%)
Poverty status for foreign-born residents (%)
Poverty among high school graduates not in families (%)
Poverty among people who did not graduate high school not in families (%)
Residents with income below the poverty level (%) - White
Residents with income below the poverty level (%) - Black or African American
Residents with income below the poverty level (%) - Asian
Residents with income below the poverty level (%) - Hispanic or Latino
Residents with income below the poverty level (%) - American Indian and Alaska Native
Residents with income below the poverty level (%) - Multirace
Residents with income below the poverty level (%) - Other Race
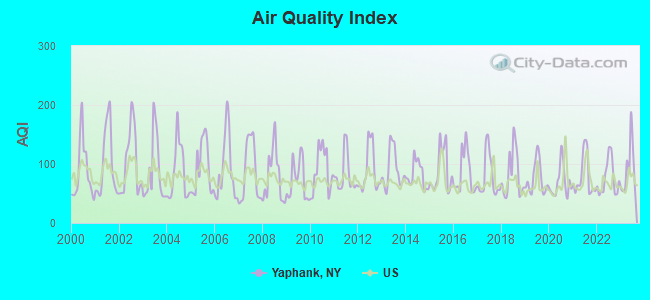
Air pollution - Air Quality Index (AQI)
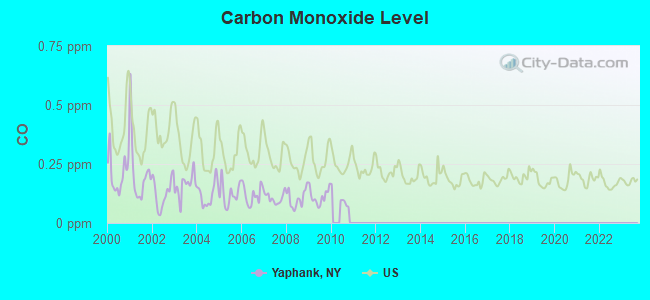
Air pollution - CO
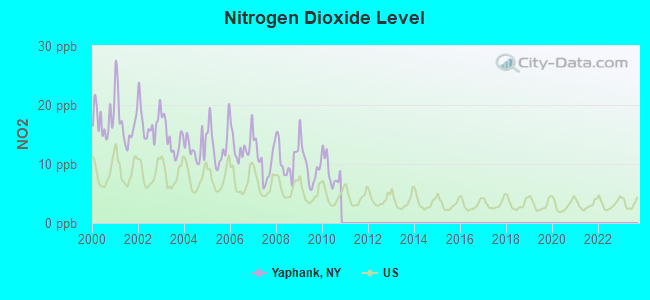
Air pollution - NO2
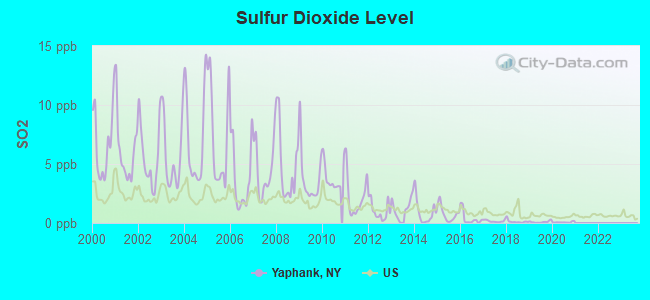
Air pollution - SO2
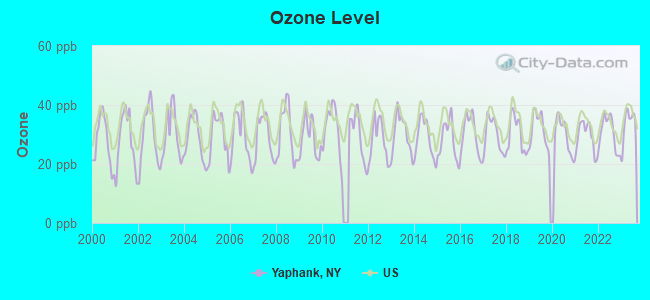
Air pollution - Ozone
Air pollution - PM10
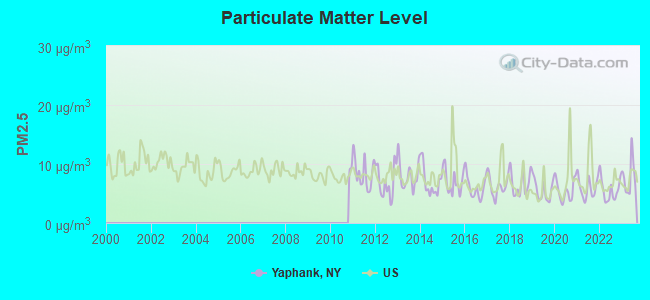
Air pollution - PM25
Air pollution - Pb
Crime - Murders per 100,000 population
Crime - Rapes per 100,000 population
Crime - Robberies per 100,000 population
Crime - Assaults per 100,000 population
Crime - Burglaries per 100,000 population
Crime - Thefts per 100,000 population
Crime - Auto thefts per 100,000 population
Crime - Arson per 100,000 population
Crime - City-data.com crime index
Crime - Violent crime index
Crime - Property crime index
Crime - Murders per 100,000 population (5 year average)
Crime - Rapes per 100,000 population (5 year average)
Crime - Robberies per 100,000 population (5 year average)
Crime - Assaults per 100,000 population (5 year average)
Crime - Burglaries per 100,000 population (5 year average)
Crime - Thefts per 100,000 population (5 year average)
Crime - Auto thefts per 100,000 population (5 year average)
Crime - Arson per 100,000 population (5 year average)
Crime - City-data.com crime index (5 year average)
Crime - Violent crime index (5 year average)
Crime - Property crime index (5 year average)
1996 Presidential Elections Results (%) - Democratic Party (Clinton)
1996 Presidential Elections Results (%) - Republican Party (Dole)
1996 Presidential Elections Results (%) - Other
2000 Presidential Elections Results (%) - Democratic Party (Gore)
2000 Presidential Elections Results (%) - Republican Party (Bush)
2000 Presidential Elections Results (%) - Other
2004 Presidential Elections Results (%) - Democratic Party (Kerry)
2004 Presidential Elections Results (%) - Republican Party (Bush)
2004 Presidential Elections Results (%) - Other
2008 Presidential Elections Results (%) - Democratic Party (Obama)
2008 Presidential Elections Results (%) - Republican Party (McCain)
2008 Presidential Elections Results (%) - Other
2012 Presidential Elections Results (%) - Democratic Party (Obama)
2012 Presidential Elections Results (%) - Republican Party (Romney)
2012 Presidential Elections Results (%) - Other
2016 Presidential Elections Results (%) - Democratic Party (Clinton)
2016 Presidential Elections Results (%) - Republican Party (Trump)
2016 Presidential Elections Results (%) - Other
2020 Presidential Elections Results (%) - Democratic Party (Biden)
2020 Presidential Elections Results (%) - Republican Party (Trump)
2020 Presidential Elections Results (%) - Other
Ancestries Reported - Arab (%)
Ancestries Reported - Czech (%)
Ancestries Reported - Danish (%)
Ancestries Reported - Dutch (%)
Ancestries Reported - English (%)
Ancestries Reported - French (%)
Ancestries Reported - French Canadian (%)
Ancestries Reported - German (%)
Ancestries Reported - Greek (%)
Ancestries Reported - Hungarian (%)
Ancestries Reported - Irish (%)
Ancestries Reported - Italian (%)
Ancestries Reported - Lithuanian (%)
Ancestries Reported - Norwegian (%)
Ancestries Reported - Polish (%)
Ancestries Reported - Portuguese (%)
Ancestries Reported - Russian (%)
Ancestries Reported - Scotch-Irish (%)
Ancestries Reported - Scottish (%)
Ancestries Reported - Slovak (%)
Ancestries Reported - Subsaharan African (%)
Ancestries Reported - Swedish (%)
Ancestries Reported - Swiss (%)
Ancestries Reported - Ukrainian (%)
Ancestries Reported - United States (%)
Ancestries Reported - Welsh (%)
Ancestries Reported - West Indian (%)
Ancestries Reported - Other (%)
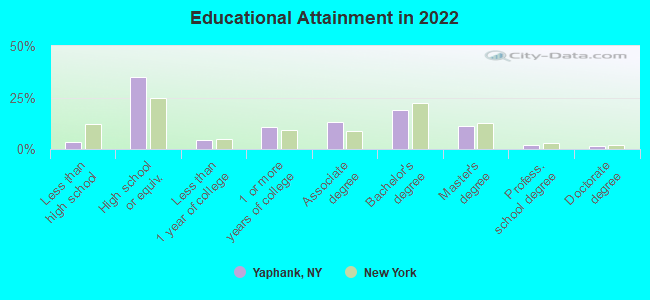
Educational Attainment - No schooling completed (%)
Educational Attainment - Less than high school (%)
Educational Attainment - High school or equivalent (%)
Educational Attainment - Less than 1 year of college (%)
Educational Attainment - 1 or more years of college (%)
Educational Attainment - Associate degree (%)
Educational Attainment - Bachelor's degree (%)
Educational Attainment - Master's degree (%)
Educational Attainment - Professional school degree (%)
Educational Attainment - Doctorate degree (%)
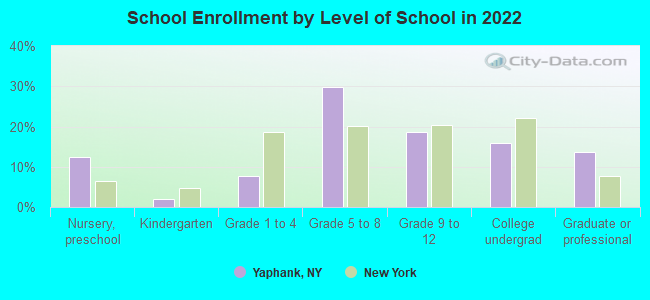
School Enrollment - Nursery, preschool (%)
School Enrollment - Kindergarten (%)
School Enrollment - Grade 1 to 4 (%)
School Enrollment - Grade 5 to 8 (%)
School Enrollment - Grade 9 to 12 (%)
School Enrollment - College undergrad (%)
School Enrollment - Graduate or professional (%)
School Enrollment - Not enrolled in school (%)
School enrollment - Public schools (%)
School enrollment - Private schools (%)
School enrollment - Not enrolled (%)
Median number of rooms in houses and condos
Median number of rooms in apartments
Housing units lacking complete plumbing facilities (%)
Housing units lacking complete kitchen facilities (%)
Density of houses
Urban houses (%)
Rural houses (%)
Households with people 60 years and over (%)
Households with people 65 years and over (%)
Households with people 75 years and over (%)
Households with one or more nonrelatives (%)
Households with no nonrelatives (%)
Population in households (%)
Family households (%)
Nonfamily households (%)
Population in families (%)
Family households with own children (%)
Median number of bedrooms in owner occupied houses
Mean number of bedrooms in owner occupied houses
Median number of bedrooms in renter occupied houses
Mean number of bedrooms in renter occupied houses
Median number of vehichles in owner occupied houses
Mean number of vehichles in owner occupied houses
Median number of vehichles in renter occupied houses
Mean number of vehichles in renter occupied houses
Mortgage status - with mortgage (%)
Mortgage status - with second mortgage (%)
Mortgage status - with home equity loan (%)
Mortgage status - with both second mortgage and home equity loan (%)
Mortgage status - without a mortgage (%)
Average family size
Average family size - White
Average family size - Black or African American
Average family size - Asian
Average family size - Hispanic or Latino
Average family size - American Indian and Alaska Native
Average family size - Multirace
Average family size - Other Race
Geographical mobility - Same house 1 year ago (%)
Geographical mobility - Moved within same county (%)
Geographical mobility - Moved from different county within same state (%)
Geographical mobility - Moved from different state (%)
Geographical mobility - Moved from abroad (%)
Place of birth - Born in state of residence (%)
Place of birth - Born in other state (%)
Place of birth - Native, outside of US (%)
Place of birth - Foreign born (%)
Housing units in structures - 1, detached (%)
Housing units in structures - 1, attached (%)
Housing units in structures - 2 (%)
Housing units in structures - 3 or 4 (%)
Housing units in structures - 5 to 9 (%)
Housing units in structures - 10 to 19 (%)
Housing units in structures - 20 to 49 (%)
Housing units in structures - 50 or more (%)
Housing units in structures - Mobile home (%)
Housing units in structures - Boat, RV, van, etc. (%)
House/condo owner moved in on average (years ago)
Renter moved in on average (years ago)
Year householder moved into unit - Moved in 1999 to March 2000 (%)
Year householder moved into unit - Moved in 1995 to 1998 (%)
Year householder moved into unit - Moved in 1990 to 1994 (%)
Year householder moved into unit - Moved in 1980 to 1989 (%)
Year householder moved into unit - Moved in 1970 to 1979 (%)
Year householder moved into unit - Moved in 1969 or earlier (%)
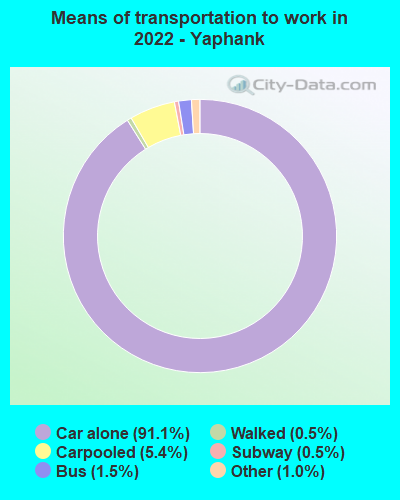
Means of transportation to work - Drove car alone (%)
Means of transportation to work - Carpooled (%)
Means of transportation to work - Public transportation (%)
Means of transportation to work - Bus or trolley bus (%)
Means of transportation to work - Streetcar or trolley car (%)
Means of transportation to work - Subway or elevated (%)
Means of transportation to work - Railroad (%)
Means of transportation to work - Ferryboat (%)
Means of transportation to work - Taxicab (%)
Means of transportation to work - Motorcycle (%)
Means of transportation to work - Bicycle (%)
Means of transportation to work - Walked (%)
Means of transportation to work - Other means (%)
Working at home (%)
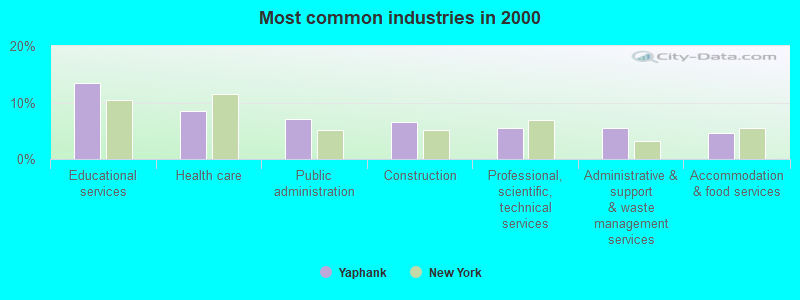
Industry diversity
Most Common Industries - Agriculture, forestry, fishing and hunting, and mining (%)
Most Common Industries - Agriculture, forestry, fishing and hunting (%)
Most Common Industries - Mining, quarrying, and oil and gas extraction (%)
Most Common Industries - Construction (%)
Most Common Industries - Manufacturing (%)
Most Common Industries - Wholesale trade (%)
Most Common Industries - Retail trade (%)
Most Common Industries - Transportation and warehousing, and utilities (%)
Most Common Industries - Transportation and warehousing (%)
Most Common Industries - Utilities (%)
Most Common Industries - Information (%)
Most Common Industries - Finance and insurance, and real estate and rental and leasing (%)
Most Common Industries - Finance and insurance (%)
Most Common Industries - Real estate and rental and leasing (%)
Most Common Industries - Professional, scientific, and management, and administrative and waste management services (%)
Most Common Industries - Professional, scientific, and technical services (%)
Most Common Industries - Management of companies and enterprises (%)
Most Common Industries - Administrative and support and waste management services (%)
Most Common Industries - Educational services, and health care and social assistance (%)
Most Common Industries - Educational services (%)
Most Common Industries - Health care and social assistance (%)
Most Common Industries - Arts, entertainment, and recreation, and accommodation and food services (%)
Most Common Industries - Arts, entertainment, and recreation (%)
Most Common Industries - Accommodation and food services (%)
Most Common Industries - Other services, except public administration (%)
Most Common Industries - Public administration (%)
Occupation diversity
Most Common Occupations - Management, business, science, and arts occupations (%)
Most Common Occupations - Management, business, and financial occupations (%)
Most Common Occupations - Management occupations (%)
Most Common Occupations - Business and financial operations occupations (%)
Most Common Occupations - Computer, engineering, and science occupations (%)
Most Common Occupations - Computer and mathematical occupations (%)
Most Common Occupations - Architecture and engineering occupations (%)
Most Common Occupations - Life, physical, and social science occupations (%)
Most Common Occupations - Education, legal, community service, arts, and media occupations (%)
Most Common Occupations - Community and social service occupations (%)
Most Common Occupations - Legal occupations (%)
Most Common Occupations - Education, training, and library occupations (%)
Most Common Occupations - Arts, design, entertainment, sports, and media occupations (%)
Most Common Occupations - Healthcare practitioners and technical occupations (%)
Most Common Occupations - Health diagnosing and treating practitioners and other technical occupations (%)
Most Common Occupations - Health technologists and technicians (%)
Most Common Occupations - Service occupations (%)
Most Common Occupations - Healthcare support occupations (%)
Most Common Occupations - Protective service occupations (%)
Most Common Occupations - Fire fighting and prevention, and other protective service workers including supervisors (%)
Most Common Occupations - Law enforcement workers including supervisors (%)
Most Common Occupations - Food preparation and serving related occupations (%)
Most Common Occupations - Building and grounds cleaning and maintenance occupations (%)
Most Common Occupations - Personal care and service occupations (%)
Most Common Occupations - Sales and office occupations (%)
Most Common Occupations - Sales and related occupations (%)
Most Common Occupations - Office and administrative support occupations (%)
Most Common Occupations - Natural resources, construction, and maintenance occupations (%)
Most Common Occupations - Farming, fishing, and forestry occupations (%)
Most Common Occupations - Construction and extraction occupations (%)
Most Common Occupations - Installation, maintenance, and repair occupations (%)
Most Common Occupations - Production, transportation, and material moving occupations (%)
Most Common Occupations - Production occupations (%)
Most Common Occupations - Transportation occupations (%)
Most Common Occupations - Material moving occupations (%)
People in Group quarters - Institutionalized population (%)
People in Group quarters - Correctional institutions (%)
People in Group quarters - Federal prisons and detention centers (%)
People in Group quarters - Halfway houses (%)
People in Group quarters - Local jails and other confinement facilities (including police lockups) (%)
People in Group quarters - Military disciplinary barracks (%)
People in Group quarters - State prisons (%)
People in Group quarters - Other types of correctional institutions (%)
People in Group quarters - Nursing homes (%)
People in Group quarters - Hospitals/wards, hospices, and schools for the handicapped (%)
People in Group quarters - Hospitals/wards and hospices for chronically ill (%)
People in Group quarters - Hospices or homes for chronically ill (%)
People in Group quarters - Military hospitals or wards for chronically ill (%)
People in Group quarters - Other hospitals or wards for chronically ill (%)
People in Group quarters - Hospitals or wards for drug/alcohol abuse (%)
People in Group quarters - Mental (Psychiatric) hospitals or wards (%)
People in Group quarters - Schools, hospitals, or wards for the mentally retarded (%)
People in Group quarters - Schools, hospitals, or wards for the physically handicapped (%)
People in Group quarters - Institutions for the deaf (%)
People in Group quarters - Institutions for the blind (%)
People in Group quarters - Orthopedic wards and institutions for the physically handicapped (%)
People in Group quarters - Wards in general hospitals for patients who have no usual home elsewhere (%)
People in Group quarters - Wards in military hospitals for patients who have no usual home elsewhere (%)
People in Group quarters - Juvenile institutions (%)
People in Group quarters - Long-term care (%)
People in Group quarters - Homes for abused, dependent, and neglected children (%)
People in Group quarters - Residential treatment centers for emotionally disturbed children (%)
People in Group quarters - Training schools for juvenile delinquents (%)
People in Group quarters - Short-term care, detention or diagnostic centers for delinquent children (%)
People in Group quarters - Type of juvenile institution unknown (%)
People in Group quarters - Noninstitutionalized population (%)
People in Group quarters - College dormitories (includes college quarters off campus) (%)
People in Group quarters - Military quarters (%)
People in Group quarters - On base (%)
People in Group quarters - Barracks, unaccompanied personnel housing (UPH), (Enlisted/Officer), ;and similar group living quarters for military personnel (%)
People in Group quarters - Transient quarters for temporary residents (%)
People in Group quarters - Military ships (%)
People in Group quarters - Group homes (%)
People in Group quarters - Homes or halfway houses for drug/alcohol abuse (%)
People in Group quarters - Homes for the mentally ill (%)
People in Group quarters - Homes for the mentally retarded (%)
People in Group quarters - Homes for the physically handicapped (%)
People in Group quarters - Other group homes (%)
People in Group quarters - Religious group quarters (%)
People in Group quarters - Dormitories (%)
People in Group quarters - Agriculture workers' dormitories on farms (%)
People in Group quarters - Job Corps and vocational training facilities (%)
People in Group quarters - Other workers' dormitories (%)
People in Group quarters - Crews of maritime vessels (%)
People in Group quarters - Other nonhousehold living situations (%)
People in Group quarters - Other noninstitutional group quarters (%)
Residents speaking English at home (%)
Residents speaking English at home - Born in the United States (%)
Residents speaking English at home - Native, born elsewhere (%)
Residents speaking English at home - Foreign born (%)
Residents speaking Spanish at home (%)
Residents speaking Spanish at home - Born in the United States (%)
Residents speaking Spanish at home - Native, born elsewhere (%)
Residents speaking Spanish at home - Foreign born (%)
Residents speaking other language at home (%)
Residents speaking other language at home - Born in the United States (%)
Residents speaking other language at home - Native, born elsewhere (%)
Residents speaking other language at home - Foreign born (%)
Class of Workers - Employee of private company (%)
Class of Workers - Self-employed in own incorporated business (%)
Class of Workers - Private not-for-profit wage and salary workers (%)
Class of Workers - Local government workers (%)
Class of Workers - State government workers (%)
Class of Workers - Federal government workers (%)
Class of Workers - Self-employed workers in own not incorporated business and Unpaid family workers (%)
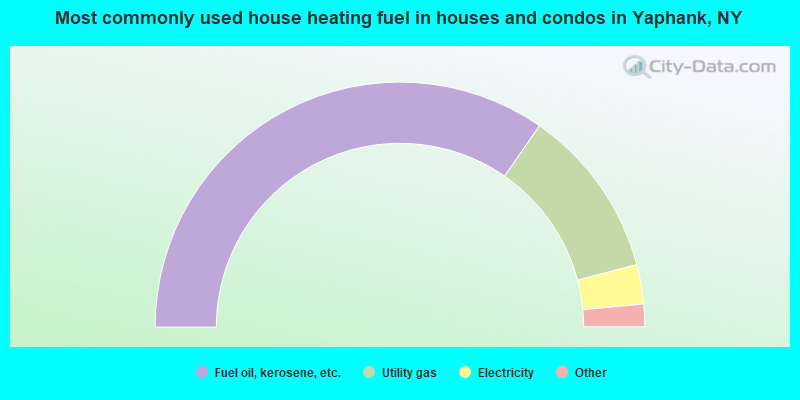
House heating fuel used in houses and condos - Utility gas (%)
House heating fuel used in houses and condos - Bottled, tank, or LP gas (%)
House heating fuel used in houses and condos - Electricity (%)
House heating fuel used in houses and condos - Fuel oil, kerosene, etc. (%)
House heating fuel used in houses and condos - Coal or coke (%)
House heating fuel used in houses and condos - Wood (%)
House heating fuel used in houses and condos - Solar energy (%)
House heating fuel used in houses and condos - Other fuel (%)
House heating fuel used in houses and condos - No fuel used (%)
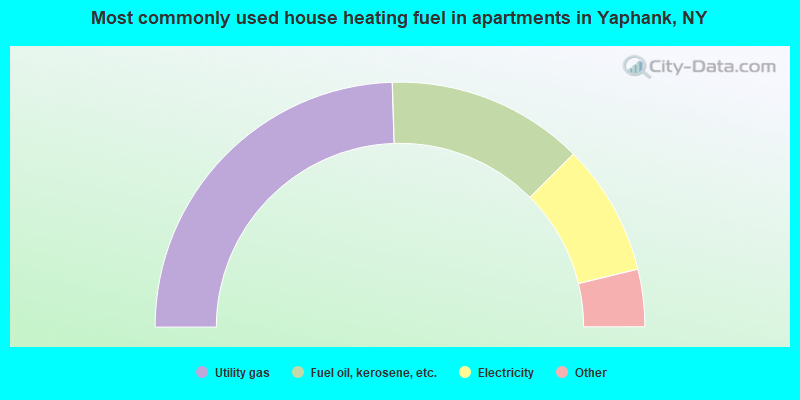
House heating fuel used in apartments - Utility gas (%)
House heating fuel used in apartments - Bottled, tank, or LP gas (%)
House heating fuel used in apartments - Electricity (%)
House heating fuel used in apartments - Fuel oil, kerosene, etc. (%)
House heating fuel used in apartments - Coal or coke (%)
House heating fuel used in apartments - Wood (%)
House heating fuel used in apartments - Solar energy (%)
House heating fuel used in apartments - Other fuel (%)
House heating fuel used in apartments - No fuel used (%)
Armed forces status - In Armed Forces (%)
Armed forces status - Civilian (%)
Armed forces status - Civilian - Veteran (%)
Armed forces status - Civilian - Nonveteran (%)
Fatal accidents locations in years 2005-2021
Fatal accidents locations in 2005
Fatal accidents locations in 2006
Fatal accidents locations in 2007
Fatal accidents locations in 2008
Fatal accidents locations in 2009
Fatal accidents locations in 2010
Fatal accidents locations in 2011
Fatal accidents locations in 2012
Fatal accidents locations in 2013
Fatal accidents locations in 2014
Fatal accidents locations in 2015
Fatal accidents locations in 2016
Fatal accidents locations in 2017
Fatal accidents locations in 2018
Fatal accidents locations in 2019
Fatal accidents locations in 2020
Fatal accidents locations in 2021
Alcohol use - People drinking some alcohol every month (%)
Alcohol use - People not drinking at all (%)
Alcohol use - Average days/month drinking alcohol
Alcohol use - Average drinks/week
Alcohol use - Average days/year people drink much
Audiometry - Average condition of hearing (%)
Audiometry - People that can hear a whisper from across a quiet room (%)
Audiometry - People that can hear normal voice from across a quiet room (%)
Audiometry - Ears ringing, roaring, buzzing (%)
Audiometry - Had a job exposure to loud noise (%)
Audiometry - Had off-work exposure to loud noise (%)
Blood Pressure & Cholesterol - Has high blood pressure (%)
Blood Pressure & Cholesterol - Checking blood pressure at home (%)
Blood Pressure & Cholesterol - Frequently checking blood cholesterol (%)
Blood Pressure & Cholesterol - Has high cholesterol level (%)
Consumer Behavior - Money monthly spent on food at supermarket/grocery store
Consumer Behavior - Money monthly spent on food at other stores
Consumer Behavior - Money monthly spent on eating out
Consumer Behavior - Money monthly spent on carryout/delivered foods
Consumer Behavior - Income spent on food at supermarket/grocery store (%)
Consumer Behavior - Income spent on food at other stores (%)
Consumer Behavior - Income spent on eating out (%)
Consumer Behavior - Income spent on carryout/delivered foods (%)
Current Health Status - General health condition (%)
Current Health Status - Blood donors (%)
Current Health Status - Has blood ever tested for HIV virus (%)
Current Health Status - Left-handed people (%)
Dermatology - People using sunscreen (%)
Diabetes - Diabetics (%)
Diabetes - Had a blood test for high blood sugar (%)
Diabetes - People taking insulin (%)
Diet Behavior & Nutrition - Diet health (%)
Diet Behavior & Nutrition - Milk product consumption (# of products/month)
Diet Behavior & Nutrition - Meals not home prepared (#/week)
Diet Behavior & Nutrition - Meals from fast food or pizza place (#/week)
Diet Behavior & Nutrition - Ready-to-eat foods (#/month)
Diet Behavior & Nutrition - Frozen meals/pizza (#/month)
Drug Use - People that ever used marijuana or hashish (%)
Drug Use - Ever used hard drugs (%)
Drug Use - Ever used any form of cocaine (%)
Drug Use - Ever used heroin (%)
Drug Use - Ever used methamphetamine (%)
Health Insurance - People covered by health insurance (%)
Kidney Conditions-Urology - Avg. # of times urinating at night
Medical Conditions - People with asthma (%)
Medical Conditions - People with anemia (%)
Medical Conditions - People with psoriasis (%)
Medical Conditions - People with overweight (%)
Medical Conditions - Elderly people having difficulties in thinking or remembering (%)
Medical Conditions - People who ever received blood transfusion (%)
Medical Conditions - People having trouble seeing even with glass/contacts (%)
Medical Conditions - People with arthritis (%)
Medical Conditions - People with gout (%)
Medical Conditions - People with congestive heart failure (%)
Medical Conditions - People with coronary heart disease (%)
Medical Conditions - People with angina pectoris (%)
Medical Conditions - People who ever had heart attack (%)
Medical Conditions - People who ever had stroke (%)
Medical Conditions - People with emphysema (%)
Medical Conditions - People with thyroid problem (%)
Medical Conditions - People with chronic bronchitis (%)
Medical Conditions - People with any liver condition (%)
Medical Conditions - People who ever had cancer or malignancy (%)
Mental Health - People who have little interest in doing things (%)
Mental Health - People feeling down, depressed, or hopeless (%)
Mental Health - People who have trouble sleeping or sleeping too much (%)
Mental Health - People feeling tired or having little energy (%)
Mental Health - People with poor appetite or overeating (%)
Mental Health - People feeling bad about themself (%)
Mental Health - People who have trouble concentrating on things (%)
Mental Health - People moving or speaking slowly or too fast (%)
Mental Health - People having thoughts they would be better off dead (%)
Oral Health - Average years since last visit a dentist
Oral Health - People embarrassed because of mouth (%)
Oral Health - People with gum disease (%)
Oral Health - General health of teeth and gums (%)
Oral Health - Average days a week using dental floss/device
Oral Health - Average days a week using mouthwash for dental problem
Oral Health - Average number of teeth
Pesticide Use - Households using pesticides to control insects (%)
Pesticide Use - Households using pesticides to kill weeds (%)
Physical Activity - People doing vigorous-intensity work activities (%)
Physical Activity - People doing moderate-intensity work activities (%)
Physical Activity - People walking or bicycling (%)
Physical Activity - People doing vigorous-intensity recreational activities (%)
Physical Activity - People doing moderate-intensity recreational activities (%)
Physical Activity - Average hours a day doing sedentary activities
Physical Activity - Average hours a day watching TV or videos
Physical Activity - Average hours a day using computer
Physical Functioning - People having limitations keeping them from working (%)
Physical Functioning - People limited in amount of work they can do (%)
Physical Functioning - People that need special equipment to walk (%)
Physical Functioning - People experiencing confusion/memory problems (%)
Physical Functioning - People requiring special healthcare equipment (%)
Prescription Medications - Average number of prescription medicines taking
Preventive Aspirin Use - Adults 40+ taking low-dose aspirin (%)
Reproductive Health - Vaginal deliveries (%)
Reproductive Health - Cesarean deliveries (%)
Reproductive Health - Deliveries resulted in a live birth (%)
Reproductive Health - Pregnancies resulted in a delivery (%)
Reproductive Health - Women breastfeeding newborns (%)
Reproductive Health - Women that had a hysterectomy (%)
Reproductive Health - Women that had both ovaries removed (%)
Reproductive Health - Women that have ever taken birth control pills (%)
Reproductive Health - Women taking birth control pills (%)
Reproductive Health - Women that have ever used Depo-Provera or injectables (%)
Reproductive Health - Women that have ever used female hormones (%)
Sexual Behavior - People 18+ that ever had sex (vaginal, anal, or oral) (%)
Sexual Behavior - Males 18+ that ever had vaginal sex with a woman (%)
Sexual Behavior - Males 18+ that ever performed oral sex on a woman (%)
Sexual Behavior - Males 18+ that ever had anal sex with a woman (%)
Sexual Behavior - Males 18+ that ever had any sex with a man (%)
Sexual Behavior - Females 18+ that ever had vaginal sex with a man (%)
Sexual Behavior - Females 18+ that ever performed oral sex on a man (%)
Sexual Behavior - Females 18+ that ever had anal sex with a man (%)
Sexual Behavior - Females 18+ that ever had any kind of sex with a woman (%)
Sexual Behavior - Average age people first had sex
Sexual Behavior - Average number of female sex partners in lifetime (males 18+)
Sexual Behavior - Average number of female vaginal sex partners in lifetime (males 18+)
Sexual Behavior - Average age people first performed oral sex on a woman (18+)
Sexual Behavior - Average number of woman performed oral sex on in lifetime (18+)
Sexual Behavior - Average number of male sex partners in lifetime (males 18+)
Sexual Behavior - Average number of male anal sex partners in lifetime (males 18+)
Sexual Behavior - Average age people first performed oral sex on a man (18+)
Sexual Behavior - Average number of male oral sex partners in lifetime (18+)
Sexual Behavior - People using protection when performing oral sex (%)
Sexual Behavior - Average number of times people have vaginal or anal sex a year
Sexual Behavior - People having sex without condom (%)
Sexual Behavior - Average number of male sex partners in lifetime (females 18+)
Sexual Behavior - Average number of male vaginal sex partners in lifetime (females 18+)
Sexual Behavior - Average number of female sex partners in lifetime (females 18+)
Sexual Behavior - Circumcised males 18+ (%)
Sleep Disorders - Average hours sleeping at night
Sleep Disorders - People that has trouble sleeping (%)
Smoking-Cigarette Use - People smoking cigarettes (%)
Taste & Smell - People 40+ having problems with smell (%)
Taste & Smell - People 40+ having problems with taste (%)
Taste & Smell - People 40+ that ever had wisdom teeth removed (%)
Taste & Smell - People 40+ that ever had tonsils teeth removed (%)
Taste & Smell - People 40+ that ever had a loss of consciousness because of a head injury (%)
Taste & Smell - People 40+ that ever had a broken nose or other serious injury to face or skull (%)
Taste & Smell - People 40+ that ever had two or more sinus infections (%)
Weight - Average height (inches)
Weight - Average weight (pounds)
Weight - Average BMI
Weight - People that are obese (%)
Weight - People that ever were obese (%)
Weight - People trying to lose weight (%)
According to our research of New York and other state lists, there were 6 registered sex offenders living in Yaphank, New York as of July 02, 2024 . The ratio of all residents to sex offenders in Yaphank is 1,059 to 1.The ratio of registered sex offenders to all residents in this city is near the state average.
Latest news from Yaphank, NY collected exclusively by city-data.com from local newspapers, TV, and radio stations
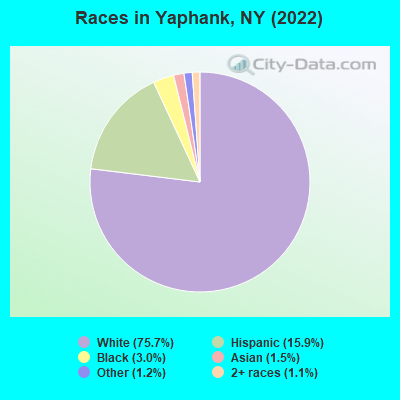
Ancestries: Italian (20.3%), German (15.6%), Irish (13.9%), American (5.3%), European (3.8%), Guyanese (2.9%).
Current Local Time:
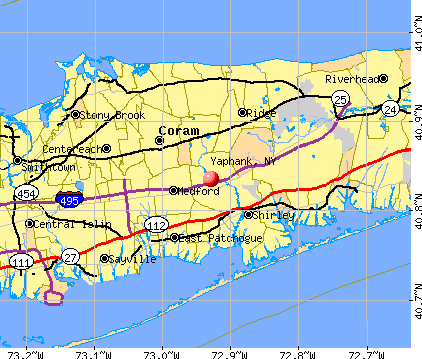
Land area: 14.0 square miles.
Population density: 425 people per square mile (low).
612 residents are foreign born (6.1% Latin America , 1.8% Asia , 1.2% Europe ).
This place:
9.8%New York:
22.6%
Median real estate property taxes paid for housing units with mortgages in 2022: $8,178 (1.9%)Median real estate property taxes paid for housing units with no mortgage in 2022: $7,507 (1.8%)
Nearest city with pop. 50,000+: Brentwood, NY
Nearest city with pop. 200,000+: North Hempstead, NY
Nearest city with pop. 1,000,000+: Queens, NY
Nearest cities:
Latitude: 40.84 N, Longitude: 72.93 W
Daytime population change due to commuting: +2,767 (+44.4%)Workers who live and work in this place: 444 (11.5%)
Unemployment in December 2023:
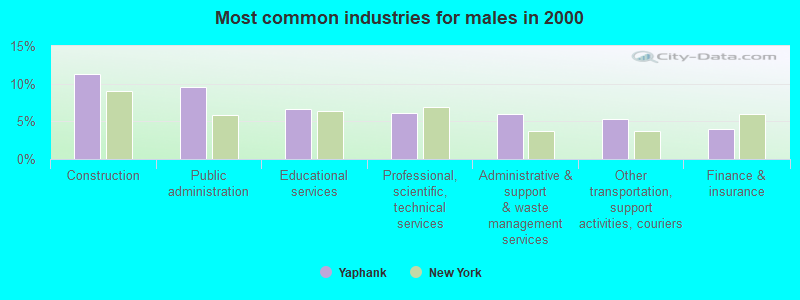
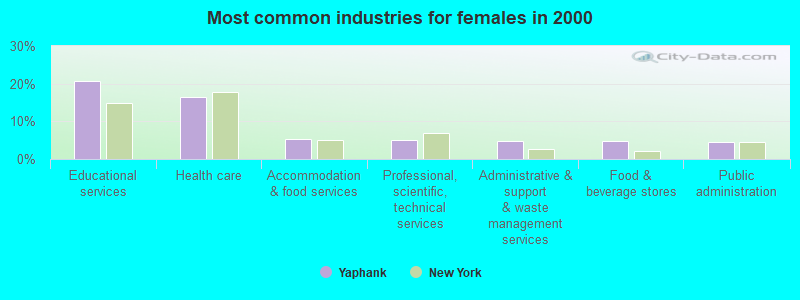
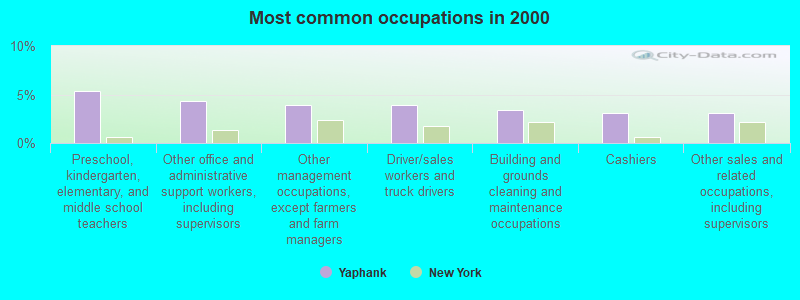
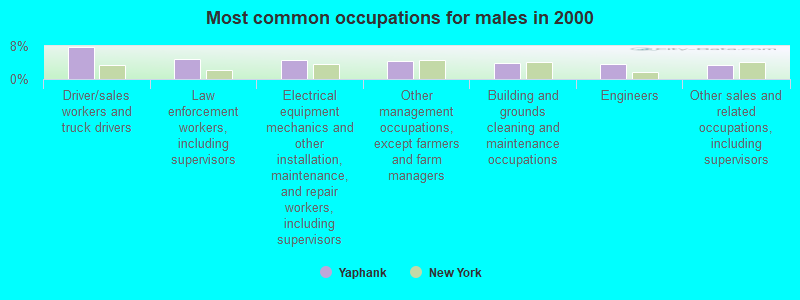
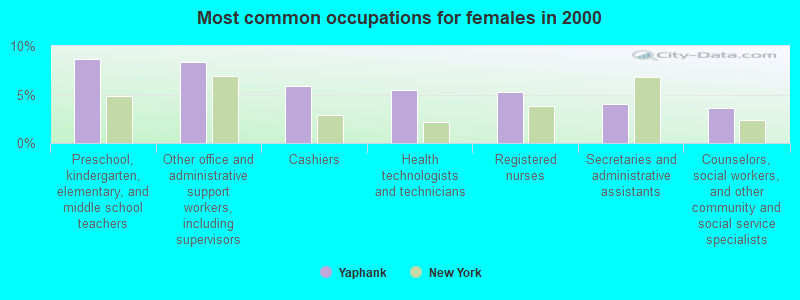
Most common occupations in Yaphank, NY (%)
Both Males Females
Preschool, kindergarten, elementary, and middle school teachers (5.3%)
Other office and administrative support workers, including supervisors (4.3%)
Other management occupations, except farmers and farm managers (3.9%)
Driver/sales workers and truck drivers (3.9%)
Building and grounds cleaning and maintenance occupations (3.4%)
Cashiers (3.1%)
Other sales and related occupations, including supervisors (3.1%)
Driver/sales workers and truck drivers (7.6%)
Law enforcement workers, including supervisors (4.9%)
Electrical equipment mechanics and other installation, maintenance, and repair workers, including supervisors (4.5%)
Other management occupations, except farmers and farm managers (4.4%)
Building and grounds cleaning and maintenance occupations (3.8%)
Engineers (3.6%)
Other sales and related occupations, including supervisors (3.3%)
Preschool, kindergarten, elementary, and middle school teachers (8.6%)
Other office and administrative support workers, including supervisors (8.4%)
Cashiers (5.9%)
Health technologists and technicians (5.4%)
Registered nurses (5.3%)
Secretaries and administrative assistants (4.0%)
Counselors, social workers, and other community and social service specialists (3.6%)
Tornado activity:
Yaphank-area historical tornado activity is near New York state average. It is 62% smaller than the overall U.S. average.
On 7/10/1989, a category F4 (max. wind speeds 207-260 mph) tornado 33.5 miles away from the Yaphank place center injured 40 people and caused between $50,000,000 and $500,000,000 in damages.
On 7/10/1989, a category F2 (max. wind speeds 113-157 mph) tornado 7.9 miles away from the place center injured one person .
Earthquake activity:
Yaphank-area historical earthquake activity is significantly above New York state average. It is 72% smaller than the overall U.S. average. On 10/7/1983 at 10:18:46, a magnitude 5.3 (5.1 MB, 5.3 LG, 5.1 ML, Class: Moderate, Intensity: VI - VII) earthquake occurred 227.4 miles away from Yaphank center On 8/23/2011 at 17:51:04, a magnitude 5.8 (5.8 MW, Depth: 3.7 mi) earthquake occurred 335.5 miles away from the city center On 4/20/2002 at 10:50:47, a magnitude 5.3 (5.3 ML, Depth: 3.0 mi) earthquake occurred 257.3 miles away from Yaphank center On 4/20/2002 at 10:50:47, a magnitude 5.2 (5.2 MB, 4.2 MS, 5.2 MW, 5.0 MW) earthquake occurred 255.7 miles away from Yaphank center On 8/22/1992 at 12:20:32, a magnitude 4.8 (4.8 MB, 3.8 MS, 4.7 LG, Depth: 6.2 mi, Class: Light, Intensity: IV - V) earthquake occurred 182.9 miles away from Yaphank center On 1/16/1994 at 01:49:16, a magnitude 4.6 (4.6 MB, 4.6 LG, Depth: 3.1 mi) earthquake occurred 166.9 miles away from Yaphank center Magnitude types: regional Lg-wave magnitude (LG), body-wave magnitude (MB), local magnitude (ML), surface-wave magnitude (MS), moment magnitude (MW) Natural disasters: The number of natural disasters in Suffolk County (28) is a lot greater than the US average (15).Major Disasters (Presidential) Declared: 19Emergencies Declared: 7Hurricanes: 9, Floods: 7, Storms: 7, Snowstorms: 4, Winter Storms: 3, Blizzards: 2, Heavy Rain: 1, Power Outage: 1, Tropical Depression: 1, Tropical Storm: 1, Water Shortage: 1, Other: 3 (Note: some incidents may be assigned to more than one category). Hospitals and medical centers in Yaphank: JOHN J FOLEY SKILLED NURSING FACILITY (14 GLOVER DRIVE)
Other hospitals and medical centers near Yaphank: INDEPENDENT GROUP HOME LIVING PROGRAM, INC (Hospital, about 3 miles away; MIDDLE ISLAND, NY)
MEDFORD MULTICARE CENTER FOR LIVING (Nursing Home, about 4 miles away; MEDFORD, NY)
FREE, INC (Hospital, about 4 miles away; MASTIC, NY)
BELLHAVEN NURSING AND REHAB CENTER (Nursing Home, about 5 miles away; BROOKHAVEN, NY)
LAKEVIEW REHABILITATION AND CARE CENTER (Nursing Home, about 5 miles away; MIDDLE ISLAND, NY)
OAK HOLLOW NURSING CENTER (Nursing Home, about 5 miles away; MIDDLE ISLAND, NY)
BROOKHAVEN HEALTH CARE FACILITY L L C (Nursing Home, about 5 miles away; EAST PATCHOGUE, NY)
Colleges/universities with over 2000 students nearest to Yaphank:
Suffolk County Community College (about 7 miles; Selden, NY ; Full-time enrollment: 18,540)
Stony Brook University (about 12 miles; Stony Brook, NY ; FT enrollment: 22,071)
Dowling College (about 14 miles; Oakdale, NY ; FT enrollment: 2,598)
Porter and Chester Institute of Stratford (about 26 miles; Stratford, CT ; FT enrollment: 2,822)
University of Bridgeport (about 27 miles; Bridgeport, CT ; FT enrollment: 3,708)
Farmingdale State College (about 27 miles; Farmingdale, NY ; FT enrollment: 6,956)
Housatonic Community College (about 28 miles; Bridgeport, CT ; FT enrollment: 3,677)
Public elementary/middle school in Yaphank:
See full list of schools located in Yaphank
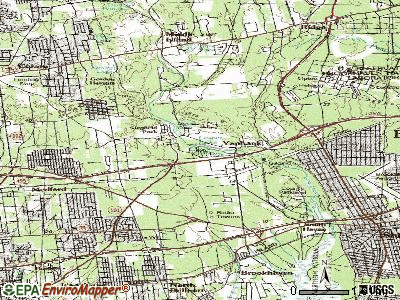
Notable locations in Yaphank: (A) , Mill Pond Golf Course (B) , Middle Island Country Club (C) , Suffolk County Alms House And Childrens Home (D) , Yaphank Fire Department (E) . Display/hide their locations on the map
Churches in Yaphank include: (A) , Community Church (B) , Mary Church (C) . Display/hide their locations on the map
Cemeteries: (1) , Old Baptist Cemetery (2) , Yaphank Village Cemetery (3) , Presbyterian Cemetery (4) , Saint Andrew's Episcopal Cemetery (5) , County Home Cemetery (6) . Display/hide their locations on the map
Reservoirs: (A) , Lower Lake (B) , Upper Lake (C) . Display/hide their locations on the map
Parks in Yaphank include: (1) , Granny Road Park (2) . Display/hide their locations on the map
Birthplace of: Fred Hembeck - Cartoonist.
Suffolk County has a predicted average indoor radon screening level less than 2 pCi/L (pico curies per liter) - Low Potential Average household size: This place:
2.7 peopleNew York:
2.6 people
Percentage of family households: This place:
70.8%Whole state:
63.5%
Percentage of households with unmarried partners: This place:
6.7%Whole state:
6.8%
Likely homosexual households (counted as self-reported same-sex unmarried-partner households)
Lesbian couples: 0.4% of all households Gay men: 0.4% of all households
People in group quarters in Yaphank in 2010:
618 people in local jails and other municipal confinement facilities
251 people in nursing facilities/skilled-nursing facilities
55 people in group homes intended for adults
People in group quarters in Yaphank in 2000:
499 people in local jails and other confinement facilities (including police lockups)
257 people in nursing homes
26 people in other group homes
13 people in homes for the mentally retarded
9 people in other noninstitutional group quarters
6 people in religious group quarters
Banks with branches in Yaphank (2011 data):
JPMorgan Chase Bank, National Association: Yaphank Branch at 128 Main Street, branch established on 1976/06/26. Info updated 2011/11/10: Bank assets: $1,811,678.0 mil, Deposits: $1,190,738.0 mil, headquarters in Columbus, OH, positive income , International Specialization, 5577 total offices , Holding Company: Jpmorgan Chase & Co.
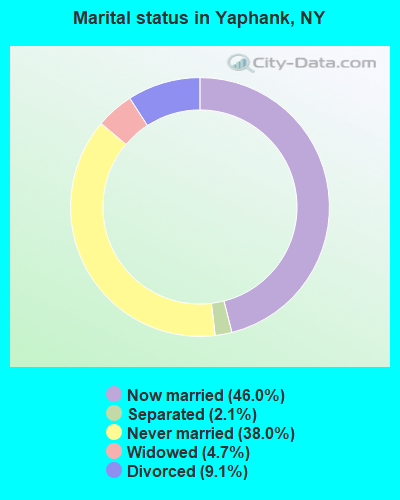
For population 15 years and over in Yaphank:
Never married: 38.0%Now married: 46.0%Separated: 2.1%Widowed: 4.7%Divorced: 9.1% For population 25 years and over in Yaphank:
High school or higher: 96.5%Bachelor's degree or higher: 32.5%Graduate or professional degree: 14.3%Unemployed: 3.9%Mean travel time to work (commute): 31.2 minutes
Education Gini index (Inequality in education) Here:
10.4New York average:
13.9
Religion statistics for Yaphank, NY (based on Suffolk County data)
Religion Adherents Congregations Catholic 879,457 75 Mainline Protestant 69,205 182 Evangelical Protestant 58,909 264 Other 50,771 124 Orthodox 10,190 10 Black Protestant 8,298 49 None 416,520 -
Source: Clifford Grammich, Kirk Hadaway, Richard Houseal, Dale E.Jones, Alexei Krindatch, Richie Stanley and Richard H.Taylor. 2012. 2010 U.S.Religion Census: Religious Congregations & Membership Study. Association of Statisticians of American Religious Bodies. Jones, Dale E., et al. 2002. Congregations and Membership in the United States 2000. Nashville, TN: Glenmary Research Center. Graphs represent county-level data
Food Environment Statistics: Number of grocery stores : 514Suffolk County :
3.40 / 10,000 pop.New York :
4.13 / 10,000 pop.
Number of supercenters and club stores : 9Suffolk County :
0.06 / 10,000 pop.New York :
0.06 / 10,000 pop.
Number of convenience stores (no gas) : 217Suffolk County :
1.44 / 10,000 pop.New York :
0.92 / 10,000 pop.
Number of convenience stores (with gas) : 256Suffolk County :
1.69 / 10,000 pop.New York :
1.68 / 10,000 pop.
Number of full-service restaurants : 1,232Here :
8.15 / 10,000 pop.New York :
8.82 / 10,000 pop.
Adult diabetes rate : Suffolk County :
8.1%New York :
8.2%
Adult obesity rate : Suffolk County :
23.4%New York :
23.8%
Low-income preschool obesity rate : This county :
22.3%State :
15.6%
Health and Nutrition:
Average overall health of teeth and gums : This city:
47.2%New York:
48.1%
People feeling badly about themselves : This city:
20.4%State:
20.3%
People not drinking alcohol at all : This city:
9.9%State:
11.1%
Average hours sleeping at night : General health condition : Yaphank:
57.5%New York:
56.5%
Average condition of hearing : More about Health and Nutrition of Yaphank, NY Residents
4.14% of this county's 2021 resident taxpayers lived in other counties in 2020 ($206,656 average adjusted gross income )
Here:
4.14%New York average:
5.29%
0.01% of residents moved from foreign countries ($74 average AGI )Suffolk County:
0.01%New York average:
0.01%
Top counties from which taxpayers relocated into this county between 2020 and 2021:
4.28% of this county's 2020 resident taxpayers moved to other counties in 2021 ($141,172 average adjusted gross income )
Here:
4.28%New York average:
6.93%
0.01% of residents moved to foreign countries ($169 average AGI )Suffolk County:
0.01%New York average:
0.02%
Top counties to which taxpayers relocated from this county between 2020 and 2021: Businesses in Yaphank, NY
Strongest AM radio stations in Yaphank:
WLIM (1580 AM; 10 kW; PATCHOGUE, NY; Owner: POLNET COMMUNICATIONS, LTD.)
WGSM (740 AM; 25 kW; HUNTINGTON, NY; Owner: K RADIO LICENSEE, INC.)
WFAN (660 AM; 50 kW; NEW YORK, NY; Owner: INFINITY BROADCASTING OPERATIONS, INC.)
WCBS (880 AM; 50 kW; NEW YORK, NY; Owner: INFINITY BROADCASTING OPERATIONS, INC.)
WMCA (570 AM; 50 kW; NEW YORK, NY; Owner: SALEM MEDIA OF NEW YORK, LLC)
WOR (710 AM; 50 kW; NEW YORK, NY; Owner: BUCKLEY BROADCASTING CORPORATION)
WABC (770 AM; 50 kW; NEW YORK, NY; Owner: WABC-AM RADIO, INC.)
WLIE (540 AM; 2 kW; ISLIP, NY; Owner: LONG ISLAND MULTIMEDIA, LLC.)
WEPN (1050 AM; 50 kW; NEW YORK, NY; Owner: NEW YORK AM RADIO, LLC)
WBBR (1130 AM; 50 kW; NEW YORK, NY; Owner: BLOOMBERG COMMUNICATIONS INC.)
WINS (1010 AM; 50 kW; NEW YORK, NY; Owner: INFINITY BROADCASTING OPERATIONS, INC.)
WQEW (1560 AM; 50 kW; NEW YORK, NY; Owner: THE NEW YORK TIMES ELECTRONIC MEDIA COMPANY)
WADO (1280 AM; 50 kW; NEW YORK, NY; Owner: WADO-AM LICENSE CORP.)
Strongest FM radio stations in Yaphank:
WALK-FM (97.5 FM; PATCHOGUE, NY; Owner: AMFM RADIO LICENSES, L.L.C.)
WBLI (106.1 FM; PATCHOGUE, NY; Owner: CXR HOLDINGS, INC.)
WUSB (90.1 FM; STONY BROOK, NY; Owner: STATE UNIVERSITY OF NEW YORK)
W289AD (105.7 FM; SELDEN, NY; Owner: SACRED HEART UNIVERSITY, INC.)
WLIU (88.3 FM; SOUTHAMPTON, NY; Owner: LONG ISLAND UNIVERSITY PUBLIC RADIO NETWORK)
WXXP (105.3 FM; CALVERTON-ROANOKE, NY; Owner: JARAD BROADCASTING CO. OF CALVERTON, INC)
WRCN-FM (103.9 FM; RIVERHEAD, NY; Owner: IW LIMITED LIABILITY COMPANY)
WDRE (98.5 FM; WESTHAMPTON, NY; Owner: JARAD BROADCATING COMPANY OF WESTHAMPTON, INC.)
WLVG (96.1 FM; CENTER MORICHES, NY; Owner: WAY BROADCASTING, INC.)
WFRS (88.9 FM; SMITHTOWN, NY; Owner: FAMILY STATIONS, INC.)
WBZO (103.1 FM; BAY SHORE, NY; Owner: MID-ISLAND BROADCASTING LIMITED PARTNERSHIP)
WSHR (91.9 FM; LAKE RONKONKOMA, NY; Owner: SACHEM CENTRAL SCH DIST HOLBROOK)
WMJC (94.3 FM; SMITHTOWN, NY; Owner: IW LIMITED LIABILITY COMPANY)
WKCI-FM (101.3 FM; HAMDEN, CT; Owner: CLEAR CHANNEL BROADCASTING LICENSES, INC.)
WPLR (99.1 FM; NEW HAVEN, CT; Owner: COX RADIO, INC.)
WEZN-FM (99.9 FM; BRIDGEPORT, CT; Owner: CXR HOLDINGS, INC.)
W217AF (91.3 FM; HUNTINGTON STATION, NY; Owner: SACRED HEART UNIVERSITY, INC.)
WSHU-FM (91.1 FM; FAIRFIELD, CT; Owner: SACRED HEART UNIVERSITY, INC.)
WBON (107.1 FM; HAMPTON BAYS, NY; Owner: NASSAU BROADCASTING HOLDINGS, INC.)
WEBE (107.9 FM; WESTPORT, CT; Owner: CUMULUS LICENSING CORP.)
TV broadcast stations around Yaphank:
WFTY (Channel 67; SMITHTOWN, NY; Owner: UNIVISION NEW YORK LLC)
WLNY (Channel 55; RIVERHEAD, NY; Owner: WLNY-TV, INC.)
W26CE (Channel 26; NEW YORK, NY; Owner: ATLANTIC COAST COMMUNICATIONS, INC.)
WNYW (Channel 5; NEW YORK, NY; Owner: FOX TELEVISION STATIONS, INC.)
WTNH (Channel 8; NEW HAVEN, CT; Owner: WTNH BROADCASTING, INC.)
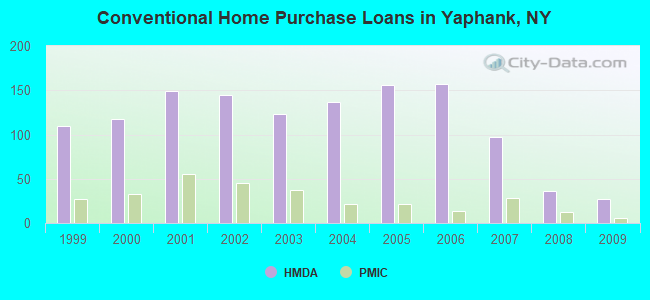
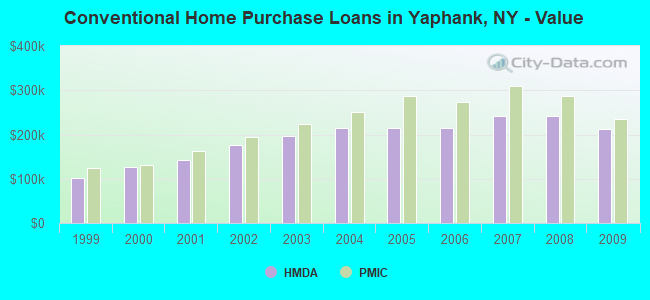
Home Mortgage Disclosure Act Aggregated Statistics For Year 2009(Based on 2 full and 1 partial tracts) A) FHA, FSA/RHS & VA B) Conventional C) Refinancings D) Home Improvement Loans F) Non-occupant Loans on Number Average Value Number Average Value Number Average Value Number Average Value Number Average Value
LOANS ORIGINATED 27 $276,330 27 $211,369 99 $208,750 10 $364,454 6 $507,868 APPLICATIONS APPROVED, NOT ACCEPTED 4 $327,460 4 $235,250 14 $252,239 2 $323,000 0 $0 APPLICATIONS DENIED 5 $298,806 11 $185,235 63 $267,225 9 $122,294 1 $130,000 APPLICATIONS WITHDRAWN 6 $241,882 4 $260,090 37 $254,518 4 $73,030 3 $113,000 FILES CLOSED FOR INCOMPLETENESS 2 $314,585 1 $96,110 9 $285,448 2 $64,325 1 $167,510
Aggregated Statistics For Year 2008(Based on 2 full and 1 partial tracts) A) FHA, FSA/RHS & VA B) Conventional C) Refinancings D) Home Improvement Loans F) Non-occupant Loans on Number Average Value Number Average Value Number Average Value Number Average Value Number Average Value
LOANS ORIGINATED 7 $320,736 36 $242,576 70 $205,864 22 $55,100 4 $189,750 APPLICATIONS APPROVED, NOT ACCEPTED 2 $277,500 6 $292,770 13 $241,912 6 $82,155 0 $0 APPLICATIONS DENIED 4 $281,228 16 $306,461 73 $268,176 25 $136,201 9 $176,076 APPLICATIONS WITHDRAWN 1 $161,330 5 $278,880 39 $291,841 4 $323,278 2 $65,595 FILES CLOSED FOR INCOMPLETENESS 0 $0 3 $287,000 7 $260,131 0 $0 0 $0
Aggregated Statistics For Year 2007(Based on 2 full and 1 partial tracts) A) FHA, FSA/RHS & VA B) Conventional C) Refinancings D) Home Improvement Loans E) Loans on Dwellings For 5+ Families F) Non-occupant Loans on G) Loans On Manufactured Number Average Value Number Average Value Number Average Value Number Average Value Number Average Value Number Average Value Number Average Value
LOANS ORIGINATED 5 $303,718 97 $242,547 121 $218,641 45 $76,175 2 $68,993,250 6 $242,622 0 $0 APPLICATIONS APPROVED, NOT ACCEPTED 0 $0 27 $209,556 34 $191,221 8 $145,939 0 $0 0 $0 2 $80,500 APPLICATIONS DENIED 0 $0 40 $283,869 125 $258,108 30 $101,446 0 $0 4 $138,190 0 $0 APPLICATIONS WITHDRAWN 0 $0 24 $244,107 45 $249,299 11 $59,185 0 $0 0 $0 0 $0 FILES CLOSED FOR INCOMPLETENESS 0 $0 6 $298,825 18 $290,728 1 $25,000 0 $0 0 $0 0 $0
Aggregated Statistics For Year 2006(Based on 2 full and 1 partial tracts) A) FHA, FSA/RHS & VA B) Conventional C) Refinancings D) Home Improvement Loans F) Non-occupant Loans on Number Average Value Number Average Value Number Average Value Number Average Value Number Average Value
LOANS ORIGINATED 2 $181,625 157 $214,223 220 $213,809 48 $105,534 12 $245,277 APPLICATIONS APPROVED, NOT ACCEPTED 1 $122,200 27 $203,052 46 $216,456 15 $62,861 3 $238,673 APPLICATIONS DENIED 0 $0 54 $258,602 137 $256,430 34 $134,969 7 $367,919 APPLICATIONS WITHDRAWN 0 $0 30 $228,261 105 $235,108 10 $84,770 5 $219,580 FILES CLOSED FOR INCOMPLETENESS 0 $0 7 $215,330 46 $307,961 1 $96,000 1 $157,900
Aggregated Statistics For Year 2005(Based on 2 full and 1 partial tracts) A) FHA, FSA/RHS & VA B) Conventional C) Refinancings D) Home Improvement Loans F) Non-occupant Loans on Number Average Value Number Average Value Number Average Value Number Average Value Number Average Value
LOANS ORIGINATED 1 $260,000 156 $215,200 237 $208,857 52 $93,707 18 $184,143 APPLICATIONS APPROVED, NOT ACCEPTED 0 $0 19 $261,879 37 $198,392 10 $101,206 3 $250,257 APPLICATIONS DENIED 0 $0 40 $236,675 116 $215,491 37 $99,426 9 $241,333 APPLICATIONS WITHDRAWN 1 $413,270 37 $230,864 107 $196,930 11 $221,640 10 $269,215 FILES CLOSED FOR INCOMPLETENESS 0 $0 8 $244,676 81 $255,395 2 $104,660 2 $256,295
Aggregated Statistics For Year 2004(Based on 2 full and 1 partial tracts) A) FHA, FSA/RHS & VA B) Conventional C) Refinancings D) Home Improvement Loans F) Non-occupant Loans on G) Loans On Manufactured Number Average Value Number Average Value Number Average Value Number Average Value Number Average Value Number Average Value
LOANS ORIGINATED 4 $269,395 137 $214,949 294 $177,308 58 $94,427 21 $132,167 3 $49,327 APPLICATIONS APPROVED, NOT ACCEPTED 1 $204,000 19 $221,123 64 $192,373 14 $59,068 10 $168,677 0 $0 APPLICATIONS DENIED 2 $269,500 35 $212,796 123 $202,820 30 $100,428 11 $212,102 0 $0 APPLICATIONS WITHDRAWN 3 $228,183 18 $224,461 102 $185,163 13 $81,672 5 $253,638 0 $0 FILES CLOSED FOR INCOMPLETENESS 1 $236,000 6 $291,208 70 $197,433 2 $12,650 4 $118,722 0 $0
Aggregated Statistics For Year 2003(Based on 2 full and 1 partial tracts) A) FHA, FSA/RHS & VA B) Conventional C) Refinancings D) Home Improvement Loans E) Loans on Dwellings For 5+ Families F) Non-occupant Loans on Number Average Value Number Average Value Number Average Value Number Average Value Number Average Value Number Average Value
LOANS ORIGINATED 8 $221,089 123 $196,509 513 $157,237 47 $41,346 0 $0 21 $151,550 APPLICATIONS APPROVED, NOT ACCEPTED 2 $178,250 19 $208,551 89 $170,848 7 $46,536 1 $185,360 3 $160,527 APPLICATIONS DENIED 1 $170,250 24 $214,115 189 $162,888 20 $38,658 0 $0 14 $160,639 APPLICATIONS WITHDRAWN 1 $286,960 15 $233,081 138 $170,848 11 $40,885 1 $15,446,250 2 $155,490 FILES CLOSED FOR INCOMPLETENESS 1 $133,180 1 $363,850 29 $183,490 1 $100,000 0 $0 0 $0
Aggregated Statistics For Year 2002(Based on 2 full and 1 partial tracts) A) FHA, FSA/RHS & VA B) Conventional C) Refinancings D) Home Improvement Loans F) Non-occupant Loans on Number Average Value Number Average Value Number Average Value Number Average Value Number Average Value
LOANS ORIGINATED 23 $178,741 145 $176,727 345 $131,862 60 $42,420 14 $120,662 APPLICATIONS APPROVED, NOT ACCEPTED 1 $127,690 26 $186,298 54 $118,137 13 $45,003 2 $178,785 APPLICATIONS DENIED 4 $203,795 20 $171,304 117 $136,605 28 $38,143 1 $142,790 APPLICATIONS WITHDRAWN 6 $160,960 13 $210,085 95 $137,444 21 $43,345 0 $0 FILES CLOSED FOR INCOMPLETENESS 1 $130,000 5 $183,354 39 $149,479 1 $75,000 3 $122,883
Aggregated Statistics For Year 2001(Based on 2 full and 1 partial tracts) A) FHA, FSA/RHS & VA B) Conventional C) Refinancings D) Home Improvement Loans F) Non-occupant Loans on Number Average Value Number Average Value Number Average Value Number Average Value Number Average Value
LOANS ORIGINATED 32 $160,815 149 $142,410 190 $115,569 48 $31,774 7 $116,627 APPLICATIONS APPROVED, NOT ACCEPTED 3 $154,150 22 $140,830 36 $93,330 13 $33,303 0 $0 APPLICATIONS DENIED 6 $158,958 26 $188,922 111 $108,307 30 $44,798 6 $230,573 APPLICATIONS WITHDRAWN 8 $166,910 18 $151,330 91 $125,247 14 $38,645 0 $0 FILES CLOSED FOR INCOMPLETENESS 1 $133,180 4 $207,075 15 $133,343 6 $31,907 0 $0
Aggregated Statistics For Year 2000(Based on 2 full and 1 partial tracts) A) FHA, FSA/RHS & VA B) Conventional C) Refinancings D) Home Improvement Loans F) Non-occupant Loans on Number Average Value Number Average Value Number Average Value Number Average Value Number Average Value
LOANS ORIGINATED 29 $135,157 117 $125,491 58 $78,404 39 $30,176 3 $90,667 APPLICATIONS APPROVED, NOT ACCEPTED 2 $107,465 16 $242,357 16 $88,655 12 $24,928 1 $62,470 APPLICATIONS DENIED 6 $161,207 33 $149,052 71 $88,732 20 $40,832 0 $0 APPLICATIONS WITHDRAWN 4 $175,738 18 $132,247 75 $86,839 6 $43,620 3 $45,910 FILES CLOSED FOR INCOMPLETENESS 0 $0 6 $132,762 8 $141,130 0 $0 0 $0
Aggregated Statistics For Year 1999(Based on 2 full and 2 partial tracts) A) FHA, FSA/RHS & VA B) Conventional C) Refinancings D) Home Improvement Loans F) Non-occupant Loans on Number Average Value Number Average Value Number Average Value Number Average Value Number Average Value
LOANS ORIGINATED 37 $119,623 110 $101,178 92 $82,218 27 $22,327 13 $67,575 APPLICATIONS APPROVED, NOT ACCEPTED 5 $128,984 13 $107,787 41 $93,684 9 $26,082 3 $77,207 APPLICATIONS DENIED 6 $117,912 29 $122,948 80 $73,081 27 $26,870 6 $69,623 APPLICATIONS WITHDRAWN 11 $138,866 13 $111,531 54 $79,408 6 $55,963 2 $52,575 FILES CLOSED FOR INCOMPLETENESS 1 $154,220 6 $109,912 11 $100,152 0 $0 2 $47,540
Detailed HMDA statistics for the following Tracts:
1587.07
, 1587.09 , 1591.06
Private Mortgage Insurance Companies Aggregated Statistics For Year 2009(Based on 2 full and 1 partial tracts) A) Conventional B) Refinancings Number Average Value Number Average Value
LOANS ORIGINATED 6 $234,670 2 $214,000 APPLICATIONS APPROVED, NOT ACCEPTED 4 $339,300 3 $210,147 APPLICATIONS DENIED 3 $236,667 2 $209,960 APPLICATIONS WITHDRAWN 1 $198,000 2 $268,500 FILES CLOSED FOR INCOMPLETENESS 2 $261,630 0 $0
Aggregated Statistics For Year 2008(Based on 2 full and 1 partial tracts) A) Conventional B) Refinancings C) Non-occupant Loans on Number Average Value Number Average Value Number Average Value
LOANS ORIGINATED 12 $288,036 7 $267,563 0 $0 APPLICATIONS APPROVED, NOT ACCEPTED 7 $329,256 7 $329,983 0 $0 APPLICATIONS DENIED 2 $252,065 1 $202,520 0 $0 APPLICATIONS WITHDRAWN 1 $242,000 2 $307,000 1 $307,000 FILES CLOSED FOR INCOMPLETENESS 0 $0 0 $0 0 $0
Aggregated Statistics For Year 2007(Based on 2 full and 1 partial tracts) A) Conventional B) Refinancings C) Non-occupant Loans on Number Average Value Number Average Value Number Average Value
LOANS ORIGINATED 28 $308,768 8 $323,391 1 $267,000 APPLICATIONS APPROVED, NOT ACCEPTED 6 $308,018 1 $458,580 0 $0 APPLICATIONS DENIED 1 $334,000 0 $0 0 $0 APPLICATIONS WITHDRAWN 1 $484,670 2 $246,610 1 $192,220 FILES CLOSED FOR INCOMPLETENESS 0 $0 0 $0 0 $0
Aggregated Statistics For Year 2006(Based on 2 full and 1 partial tracts) A) Conventional B) Refinancings C) Non-occupant Loans on Number Average Value Number Average Value Number Average Value
LOANS ORIGINATED 13 $272,737 6 $301,132 1 $306,000 APPLICATIONS APPROVED, NOT ACCEPTED 3 $299,103 4 $321,308 0 $0 APPLICATIONS DENIED 0 $0 1 $275,000 0 $0 APPLICATIONS WITHDRAWN 5 $282,862 0 $0 1 $264,000 FILES CLOSED FOR INCOMPLETENESS 0 $0 0 $0 0 $0
Aggregated Statistics For Year 2005(Based on 2 full and 1 partial tracts) A) Conventional B) Refinancings C) Non-occupant Loans on Number Average Value Number Average Value Number Average Value
LOANS ORIGINATED 21 $287,688 5 $253,806 1 $240,000 APPLICATIONS APPROVED, NOT ACCEPTED 3 $287,357 1 $208,000 0 $0 APPLICATIONS DENIED 0 $0 0 $0 0 $0 APPLICATIONS WITHDRAWN 4 $256,935 0 $0 0 $0 FILES CLOSED FOR INCOMPLETENESS 1 $233,000 0 $0 0 $0
Aggregated Statistics For Year 2004(Based on 2 full and 1 partial tracts) A) Conventional B) Refinancings C) Non-occupant Loans on Number Average Value Number Average Value Number Average Value
LOANS ORIGINATED 22 $249,793 10 $226,847 1 $138,670 APPLICATIONS APPROVED, NOT ACCEPTED 7 $212,320 7 $230,901 0 $0 APPLICATIONS DENIED 1 $111,210 0 $0 1 $111,210 APPLICATIONS WITHDRAWN 0 $0 1 $207,000 0 $0 FILES CLOSED FOR INCOMPLETENESS 0 $0 0 $0 0 $0
Aggregated Statistics For Year 2003(Based on 2 full and 1 partial tracts) A) Conventional B) Refinancings C) Non-occupant Loans on Number Average Value Number Average Value Number Average Value
LOANS ORIGINATED 37 $223,717 13 $226,182 2 $228,950 APPLICATIONS APPROVED, NOT ACCEPTED 9 $207,368 9 $180,447 1 $145,000 APPLICATIONS DENIED 0 $0 0 $0 0 $0 APPLICATIONS WITHDRAWN 2 $239,685 4 $244,045 0 $0 FILES CLOSED FOR INCOMPLETENESS 1 $114,650 0 $0 1 $114,650
Aggregated Statistics For Year 2002(Based on 2 full and 1 partial tracts) A) Conventional B) Refinancings C) Non-occupant Loans on Number Average Value Number Average Value Number Average Value
LOANS ORIGINATED 45 $195,121 26 $163,977 2 $158,875 APPLICATIONS APPROVED, NOT ACCEPTED 15 $191,458 11 $149,428 0 $0 APPLICATIONS DENIED 2 $228,500 0 $0 1 $234,000 APPLICATIONS WITHDRAWN 4 $154,578 3 $142,047 0 $0 FILES CLOSED FOR INCOMPLETENESS 0 $0 0 $0 0 $0
Aggregated Statistics For Year 2001(Based on 2 full and 1 partial tracts) A) Conventional B) Refinancings Number Average Value Number Average Value
LOANS ORIGINATED 55 $162,837 17 $146,432 APPLICATIONS APPROVED, NOT ACCEPTED 12 $171,298 9 $129,251 APPLICATIONS DENIED 0 $0 0 $0 APPLICATIONS WITHDRAWN 2 $157,525 4 $125,750 FILES CLOSED FOR INCOMPLETENESS 2 $122,000 0 $0
Aggregated Statistics For Year 2000(Based on 2 full and 1 partial tracts) A) Conventional B) Refinancings C) Non-occupant Loans on Number Average Value Number Average Value Number Average Value
LOANS ORIGINATED 33 $130,733 2 $127,375 2 $61,470 APPLICATIONS APPROVED, NOT ACCEPTED 3 $165,930 2 $111,785 0 $0 APPLICATIONS DENIED 2 $157,500 0 $0 0 $0 APPLICATIONS WITHDRAWN 2 $179,500 0 $0 0 $0 FILES CLOSED FOR INCOMPLETENESS 0 $0 0 $0 0 $0
Aggregated Statistics For Year 1999(Based on 2 full and 2 partial tracts) A) Conventional B) Refinancings C) Non-occupant Loans on Number Average Value Number Average Value Number Average Value
LOANS ORIGINATED 27 $124,540 18 $112,423 1 $46,120 APPLICATIONS APPROVED, NOT ACCEPTED 5 $124,746 4 $133,790 2 $133,330 APPLICATIONS DENIED 0 $0 0 $0 0 $0 APPLICATIONS WITHDRAWN 1 $94,950 2 $98,990 0 $0 FILES CLOSED FOR INCOMPLETENESS 1 $109,870 0 $0 0 $0
Detailed PMIC statistics for the following Tracts:
1587.07
, 1587.09 , 1591.06
Most common first names in Yaphank, NY among deceased individuals Name Count Lived (average)
John 74 74.9 years Mary 62 80.4 years William 42 74.6 years Joseph 34 72.4 years James 32 76.4 years Helen 30 82.6 years Margaret 28 85.6 years Anna 27 84.9 years George 24 76.9 years Charles 21 76.2 years
Most common last names in Yaphank, NY among deceased individuals Last name Count Lived (average)
Smith 15 79.1 years Brown 11 79.5 years Jones 11 85.7 years Johnson 10 80.1 years Thomas 7 75.0 years Williams 7 72.9 years Davis 6 77.3 years White 6 77.0 years Klimek 5 79.8 years Hololob 5 79.4 years
Yaphank compared to New York state average:
Unemployed percentage significantly below state average. Black race population percentage significantly below state average. Foreign-born population percentage below state average. Renting percentage significantly below state average. House age significantly below state average. Institutionalized population percentage significantly above state average.
#11 on the list of "Top 101 cities with the most users submitting photos to our site per 10,000 residents (population 5,000+)"
#30 on the list of "Top 101 cities with largest percentage of males in occupations: law enforcement workers including supervisors (population 5,000+)"
#38 on the list of "Top 101 cities with the largest percentage of people in local jails and other confinement facilities (including police lockups) (population 1,000+)"
#3 on the list of "Top 101 counties with the most Catholic adherents"
#6 on the list of "Top 101 counties with the lowest percentage of residents relocating from other counties between 2010 and 2011"
#7 on the list of "Top 101 counties with the lowest surface withdrawal of fresh water for public supply (pop. 50,000+)"
#9 on the list of "Top 101 counties with the lowest percentage of residents relocating to other counties in 2011"
#19 on the list of "Top 101 counties with the highest ground withdrawal of fresh water for public supply (pop. 50,000+)"
Top Patent Applicants
F. Avraham Dilmanian (4)
Suzanne M. Pane (3)
Jack Zito (2)
Dennis W. Allmer (2)
Aaron Kapner (2)
Jack E. Zito (1)
Jennifer Paul (1)
Suzanne M. Parie (1)
James Byron Burke (1)
Fred Bayrami (1)
Total of 21 patent applications in 2008-2024.


 Recent articles from our blog. Our writers, many of them Ph.D. graduates or candidates, create easy-to-read articles on a wide variety of topics.

 (16.9 miles
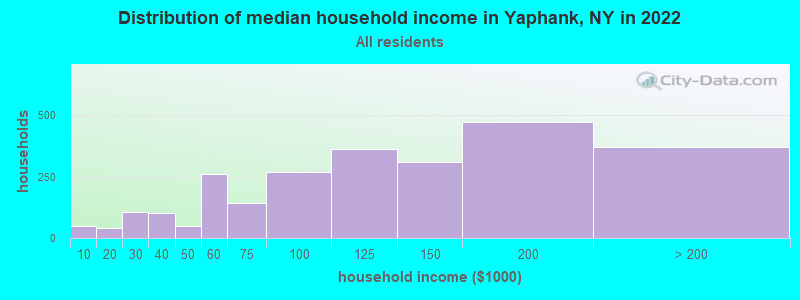


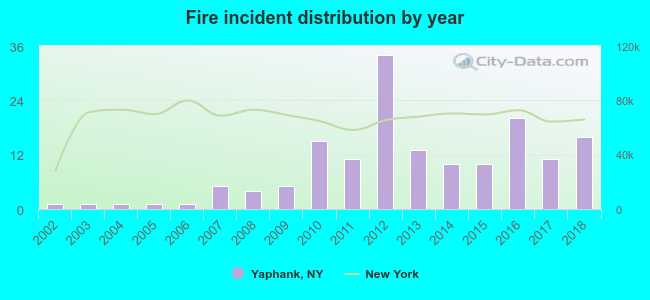 According to the data from the years 2002 - 2018 the average number of fire incidents per year is 9. The highest number of fires - 34 took place in 2012, and the least - 1 in 2002. The data has a growing trend.
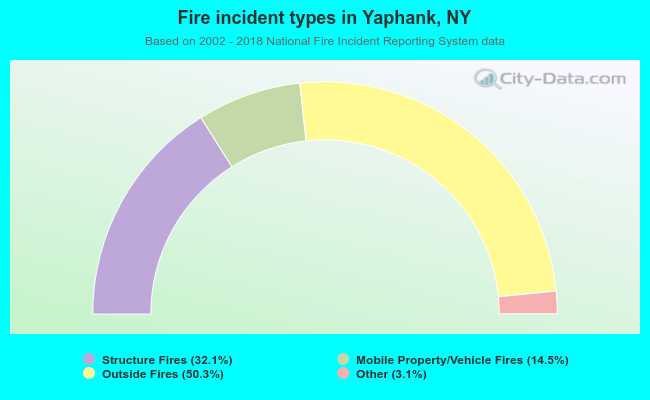 When looking into fire subcategories, the most incidents belonged to: Outside Fires (50.3%), and Structure Fires (32.1%).