Warner Robins, Georgia Submit your own pictures of this city and show them to the world
OSM Map
General Map
Google Map
MSN Map
OSM Map
General Map
Google Map
MSN Map
OSM Map
General Map
Google Map
MSN Map
OSM Map
General Map
Google Map
MSN Map
Please wait while loading the map...
Population in 2022: 82,175 (100% urban, 0% rural). Population change since 2000: +68.4%Males: 38,262 Females: 43,913
March 2022 cost of living index in Warner Robins: 90.2 (less than average, U.S. average is 100) Percentage of residents living in poverty in 2022: 13.2%for White Non-Hispanic residents , 12.2% for Black residents , 25.4% for Hispanic or Latino residents , 1.7% for American Indian residents , 13.7% for other race residents , 15.3% for two or more races residents )
Profiles of local businesses
Business Search - 14 Million verified businesses
Data:
Median household income ($)
Median household income (% change since 2000)
Household income diversity
Ratio of average income to average house value (%)
Ratio of average income to average rent
Median household income ($) - White
Median household income ($) - Black or African American
Median household income ($) - Asian
Median household income ($) - Hispanic or Latino
Median household income ($) - American Indian and Alaska Native
Median household income ($) - Multirace
Median household income ($) - Other Race
Median household income for houses/condos with a mortgage ($)
Median household income for apartments without a mortgage ($)
Races - White alone (%)
Races - White alone (% change since 2000)
Races - Black alone (%)
Races - Black alone (% change since 2000)
Races - American Indian alone (%)
Races - American Indian alone (% change since 2000)
Races - Asian alone (%)
Races - Asian alone (% change since 2000)
Races - Hispanic (%)
Races - Hispanic (% change since 2000)
Races - Native Hawaiian and Other Pacific Islander alone (%)
Races - Native Hawaiian and Other Pacific Islander alone (% change since 2000)
Races - Two or more races (%)
Races - Two or more races (% change since 2000)
Races - Other race alone (%)
Races - Other race alone (% change since 2000)
Racial diversity
Unemployment (%)
Unemployment (% change since 2000)
Unemployment (%) - White
Unemployment (%) - Black or African American
Unemployment (%) - Asian
Unemployment (%) - Hispanic or Latino
Unemployment (%) - American Indian and Alaska Native
Unemployment (%) - Multirace
Unemployment (%) - Other Race
Population density (people per square mile)
Population - Males (%)
Population - Females (%)
Population - Males (%) - White
Population - Males (%) - Black or African American
Population - Males (%) - Asian
Population - Males (%) - Hispanic or Latino
Population - Males (%) - American Indian and Alaska Native
Population - Males (%) - Multirace
Population - Males (%) - Other Race
Population - Females (%) - White
Population - Females (%) - Black or African American
Population - Females (%) - Asian
Population - Females (%) - Hispanic or Latino
Population - Females (%) - American Indian and Alaska Native
Population - Females (%) - Multirace
Population - Females (%) - Other Race
Coronavirus confirmed cases (Jul 02, 2024)
Deaths caused by coronavirus (Jul 02, 2024)
Coronavirus confirmed cases (per 100k population) (Jul 02, 2024)
Deaths caused by coronavirus (per 100k population) (Jul 02, 2024)
Daily increase in number of cases (Jul 02, 2024)
Weekly increase in number of cases (Jul 02, 2024)
Cases doubled (in days) (Jul 02, 2024)
Hospitalized patients (Apr 18, 2022)
Negative test results (Apr 18, 2022)
Total test results (Apr 18, 2022)
COVID Vaccine doses distributed (per 100k population) (Sep 19, 2023)
COVID Vaccine doses administered (per 100k population) (Sep 19, 2023)
COVID Vaccine doses distributed (Sep 19, 2023)
COVID Vaccine doses administered (Sep 19, 2023)
Likely homosexual households (%)
Likely homosexual households (% change since 2000)
Likely homosexual households - Lesbian couples (%)
Likely homosexual households - Lesbian couples (% change since 2000)
Likely homosexual households - Gay men (%)
Likely homosexual households - Gay men (% change since 2000)
Cost of living index
Median gross rent ($)
Median contract rent ($)
Median monthly housing costs ($)
Median house or condo value ($)
Median house or condo value ($ change since 2000)
Mean house or condo value by units in structure - 1, detached ($)
Mean house or condo value by units in structure - 1, attached ($)
Mean house or condo value by units in structure - 2 ($)
Mean house or condo value by units in structure by units in structure - 3 or 4 ($)
Mean house or condo value by units in structure - 5 or more ($)
Mean house or condo value by units in structure - Boat, RV, van, etc. ($)
Mean house or condo value by units in structure - Mobile home ($)
Median house or condo value ($) - White
Median house or condo value ($) - Black or African American
Median house or condo value ($) - Asian
Median house or condo value ($) - Hispanic or Latino
Median house or condo value ($) - American Indian and Alaska Native
Median house or condo value ($) - Multirace
Median house or condo value ($) - Other Race
Median resident age
Resident age diversity
Median resident age - Males
Median resident age - Females
Median resident age - White
Median resident age - Black or African American
Median resident age - Asian
Median resident age - Hispanic or Latino
Median resident age - American Indian and Alaska Native
Median resident age - Multirace
Median resident age - Other Race
Median resident age - Males - White
Median resident age - Males - Black or African American
Median resident age - Males - Asian
Median resident age - Males - Hispanic or Latino
Median resident age - Males - American Indian and Alaska Native
Median resident age - Males - Multirace
Median resident age - Males - Other Race
Median resident age - Females - White
Median resident age - Females - Black or African American
Median resident age - Females - Asian
Median resident age - Females - Hispanic or Latino
Median resident age - Females - American Indian and Alaska Native
Median resident age - Females - Multirace
Median resident age - Females - Other Race
Commute - mean travel time to work (minutes)
Travel time to work - Less than 5 minutes (%)
Travel time to work - Less than 5 minutes (% change since 2000)
Travel time to work - 5 to 9 minutes (%)
Travel time to work - 5 to 9 minutes (% change since 2000)
Travel time to work - 10 to 19 minutes (%)
Travel time to work - 10 to 19 minutes (% change since 2000)
Travel time to work - 20 to 29 minutes (%)
Travel time to work - 20 to 29 minutes (% change since 2000)
Travel time to work - 30 to 39 minutes (%)
Travel time to work - 30 to 39 minutes (% change since 2000)
Travel time to work - 40 to 59 minutes (%)
Travel time to work - 40 to 59 minutes (% change since 2000)
Travel time to work - 60 to 89 minutes (%)
Travel time to work - 60 to 89 minutes (% change since 2000)
Travel time to work - 90 or more minutes (%)
Travel time to work - 90 or more minutes (% change since 2000)
Marital status - Never married (%)
Marital status - Now married (%)
Marital status - Separated (%)
Marital status - Widowed (%)
Marital status - Divorced (%)
Median family income ($)
Median family income (% change since 2000)
Median non-family income ($)
Median non-family income (% change since 2000)
Median per capita income ($)
Median per capita income (% change since 2000)
Median family income ($) - White
Median family income ($) - Black or African American
Median family income ($) - Asian
Median family income ($) - Hispanic or Latino
Median family income ($) - American Indian and Alaska Native
Median family income ($) - Multirace
Median family income ($) - Other Race
Median year house/condo built
Median year apartment built
Year house built - Built 2005 or later (%)
Year house built - Built 2000 to 2004 (%)
Year house built - Built 1990 to 1999 (%)
Year house built - Built 1980 to 1989 (%)
Year house built - Built 1970 to 1979 (%)
Year house built - Built 1960 to 1969 (%)
Year house built - Built 1950 to 1959 (%)
Year house built - Built 1940 to 1949 (%)
Year house built - Built 1939 or earlier (%)
Average household size
Household density (households per square mile)
Average household size - White
Average household size - Black or African American
Average household size - Asian
Average household size - Hispanic or Latino
Average household size - American Indian and Alaska Native
Average household size - Multirace
Average household size - Other Race
Occupied housing units (%)
Vacant housing units (%)
Owner occupied housing units (%)
Renter occupied housing units (%)
Vacancy status - For rent (%)
Vacancy status - For sale only (%)
Vacancy status - Rented or sold, not occupied (%)
Vacancy status - For seasonal, recreational, or occasional use (%)
Vacancy status - For migrant workers (%)
Vacancy status - Other vacant (%)
Residents with income below the poverty level (%)
Residents with income below 50% of the poverty level (%)
Children below poverty level (%)
Poor families by family type - Married-couple family (%)
Poor families by family type - Male, no wife present (%)
Poor families by family type - Female, no husband present (%)
Poverty status for native-born residents (%)
Poverty status for foreign-born residents (%)
Poverty among high school graduates not in families (%)
Poverty among people who did not graduate high school not in families (%)
Residents with income below the poverty level (%) - White
Residents with income below the poverty level (%) - Black or African American
Residents with income below the poverty level (%) - Asian
Residents with income below the poverty level (%) - Hispanic or Latino
Residents with income below the poverty level (%) - American Indian and Alaska Native
Residents with income below the poverty level (%) - Multirace
Residents with income below the poverty level (%) - Other Race
Air pollution - Air Quality Index (AQI)
Air pollution - CO
Air pollution - NO2
Air pollution - SO2
Air pollution - Ozone
Air pollution - PM10
Air pollution - PM25
Air pollution - Pb
Crime - Murders per 100,000 population
Crime - Rapes per 100,000 population
Crime - Robberies per 100,000 population
Crime - Assaults per 100,000 population
Crime - Burglaries per 100,000 population
Crime - Thefts per 100,000 population
Crime - Auto thefts per 100,000 population
Crime - Arson per 100,000 population
Crime - City-data.com crime index
Crime - Violent crime index
Crime - Property crime index
Crime - Murders per 100,000 population (5 year average)
Crime - Rapes per 100,000 population (5 year average)
Crime - Robberies per 100,000 population (5 year average)
Crime - Assaults per 100,000 population (5 year average)
Crime - Burglaries per 100,000 population (5 year average)
Crime - Thefts per 100,000 population (5 year average)
Crime - Auto thefts per 100,000 population (5 year average)
Crime - Arson per 100,000 population (5 year average)
Crime - City-data.com crime index (5 year average)
Crime - Violent crime index (5 year average)
Crime - Property crime index (5 year average)
1996 Presidential Elections Results (%) - Democratic Party (Clinton)
1996 Presidential Elections Results (%) - Republican Party (Dole)
1996 Presidential Elections Results (%) - Other
2000 Presidential Elections Results (%) - Democratic Party (Gore)
2000 Presidential Elections Results (%) - Republican Party (Bush)
2000 Presidential Elections Results (%) - Other
2004 Presidential Elections Results (%) - Democratic Party (Kerry)
2004 Presidential Elections Results (%) - Republican Party (Bush)
2004 Presidential Elections Results (%) - Other
2008 Presidential Elections Results (%) - Democratic Party (Obama)
2008 Presidential Elections Results (%) - Republican Party (McCain)
2008 Presidential Elections Results (%) - Other
2012 Presidential Elections Results (%) - Democratic Party (Obama)
2012 Presidential Elections Results (%) - Republican Party (Romney)
2012 Presidential Elections Results (%) - Other
2016 Presidential Elections Results (%) - Democratic Party (Clinton)
2016 Presidential Elections Results (%) - Republican Party (Trump)
2016 Presidential Elections Results (%) - Other
2020 Presidential Elections Results (%) - Democratic Party (Biden)
2020 Presidential Elections Results (%) - Republican Party (Trump)
2020 Presidential Elections Results (%) - Other
Ancestries Reported - Arab (%)
Ancestries Reported - Czech (%)
Ancestries Reported - Danish (%)
Ancestries Reported - Dutch (%)
Ancestries Reported - English (%)
Ancestries Reported - French (%)
Ancestries Reported - French Canadian (%)
Ancestries Reported - German (%)
Ancestries Reported - Greek (%)
Ancestries Reported - Hungarian (%)
Ancestries Reported - Irish (%)
Ancestries Reported - Italian (%)
Ancestries Reported - Lithuanian (%)
Ancestries Reported - Norwegian (%)
Ancestries Reported - Polish (%)
Ancestries Reported - Portuguese (%)
Ancestries Reported - Russian (%)
Ancestries Reported - Scotch-Irish (%)
Ancestries Reported - Scottish (%)
Ancestries Reported - Slovak (%)
Ancestries Reported - Subsaharan African (%)
Ancestries Reported - Swedish (%)
Ancestries Reported - Swiss (%)
Ancestries Reported - Ukrainian (%)
Ancestries Reported - United States (%)
Ancestries Reported - Welsh (%)
Ancestries Reported - West Indian (%)
Ancestries Reported - Other (%)
Educational Attainment - No schooling completed (%)
Educational Attainment - Less than high school (%)
Educational Attainment - High school or equivalent (%)
Educational Attainment - Less than 1 year of college (%)
Educational Attainment - 1 or more years of college (%)
Educational Attainment - Associate degree (%)
Educational Attainment - Bachelor's degree (%)
Educational Attainment - Master's degree (%)
Educational Attainment - Professional school degree (%)
Educational Attainment - Doctorate degree (%)
School Enrollment - Nursery, preschool (%)
School Enrollment - Kindergarten (%)
School Enrollment - Grade 1 to 4 (%)
School Enrollment - Grade 5 to 8 (%)
School Enrollment - Grade 9 to 12 (%)
School Enrollment - College undergrad (%)
School Enrollment - Graduate or professional (%)
School Enrollment - Not enrolled in school (%)
School enrollment - Public schools (%)
School enrollment - Private schools (%)
School enrollment - Not enrolled (%)
Median number of rooms in houses and condos
Median number of rooms in apartments
Housing units lacking complete plumbing facilities (%)
Housing units lacking complete kitchen facilities (%)
Density of houses
Urban houses (%)
Rural houses (%)
Households with people 60 years and over (%)
Households with people 65 years and over (%)
Households with people 75 years and over (%)
Households with one or more nonrelatives (%)
Households with no nonrelatives (%)
Population in households (%)
Family households (%)
Nonfamily households (%)
Population in families (%)
Family households with own children (%)
Median number of bedrooms in owner occupied houses
Mean number of bedrooms in owner occupied houses
Median number of bedrooms in renter occupied houses
Mean number of bedrooms in renter occupied houses
Median number of vehichles in owner occupied houses
Mean number of vehichles in owner occupied houses
Median number of vehichles in renter occupied houses
Mean number of vehichles in renter occupied houses
Mortgage status - with mortgage (%)
Mortgage status - with second mortgage (%)
Mortgage status - with home equity loan (%)
Mortgage status - with both second mortgage and home equity loan (%)
Mortgage status - without a mortgage (%)
Average family size
Average family size - White
Average family size - Black or African American
Average family size - Asian
Average family size - Hispanic or Latino
Average family size - American Indian and Alaska Native
Average family size - Multirace
Average family size - Other Race
Geographical mobility - Same house 1 year ago (%)
Geographical mobility - Moved within same county (%)
Geographical mobility - Moved from different county within same state (%)
Geographical mobility - Moved from different state (%)
Geographical mobility - Moved from abroad (%)
Place of birth - Born in state of residence (%)
Place of birth - Born in other state (%)
Place of birth - Native, outside of US (%)
Place of birth - Foreign born (%)
Housing units in structures - 1, detached (%)
Housing units in structures - 1, attached (%)
Housing units in structures - 2 (%)
Housing units in structures - 3 or 4 (%)
Housing units in structures - 5 to 9 (%)
Housing units in structures - 10 to 19 (%)
Housing units in structures - 20 to 49 (%)
Housing units in structures - 50 or more (%)
Housing units in structures - Mobile home (%)
Housing units in structures - Boat, RV, van, etc. (%)
House/condo owner moved in on average (years ago)
Renter moved in on average (years ago)
Year householder moved into unit - Moved in 1999 to March 2000 (%)
Year householder moved into unit - Moved in 1995 to 1998 (%)
Year householder moved into unit - Moved in 1990 to 1994 (%)
Year householder moved into unit - Moved in 1980 to 1989 (%)
Year householder moved into unit - Moved in 1970 to 1979 (%)
Year householder moved into unit - Moved in 1969 or earlier (%)
Means of transportation to work - Drove car alone (%)
Means of transportation to work - Carpooled (%)
Means of transportation to work - Public transportation (%)
Means of transportation to work - Bus or trolley bus (%)
Means of transportation to work - Streetcar or trolley car (%)
Means of transportation to work - Subway or elevated (%)
Means of transportation to work - Railroad (%)
Means of transportation to work - Ferryboat (%)
Means of transportation to work - Taxicab (%)
Means of transportation to work - Motorcycle (%)
Means of transportation to work - Bicycle (%)
Means of transportation to work - Walked (%)
Means of transportation to work - Other means (%)
Working at home (%)
Industry diversity
Most Common Industries - Agriculture, forestry, fishing and hunting, and mining (%)
Most Common Industries - Agriculture, forestry, fishing and hunting (%)
Most Common Industries - Mining, quarrying, and oil and gas extraction (%)
Most Common Industries - Construction (%)
Most Common Industries - Manufacturing (%)
Most Common Industries - Wholesale trade (%)
Most Common Industries - Retail trade (%)
Most Common Industries - Transportation and warehousing, and utilities (%)
Most Common Industries - Transportation and warehousing (%)
Most Common Industries - Utilities (%)
Most Common Industries - Information (%)
Most Common Industries - Finance and insurance, and real estate and rental and leasing (%)
Most Common Industries - Finance and insurance (%)
Most Common Industries - Real estate and rental and leasing (%)
Most Common Industries - Professional, scientific, and management, and administrative and waste management services (%)
Most Common Industries - Professional, scientific, and technical services (%)
Most Common Industries - Management of companies and enterprises (%)
Most Common Industries - Administrative and support and waste management services (%)
Most Common Industries - Educational services, and health care and social assistance (%)
Most Common Industries - Educational services (%)
Most Common Industries - Health care and social assistance (%)
Most Common Industries - Arts, entertainment, and recreation, and accommodation and food services (%)
Most Common Industries - Arts, entertainment, and recreation (%)
Most Common Industries - Accommodation and food services (%)
Most Common Industries - Other services, except public administration (%)
Most Common Industries - Public administration (%)
Occupation diversity
Most Common Occupations - Management, business, science, and arts occupations (%)
Most Common Occupations - Management, business, and financial occupations (%)
Most Common Occupations - Management occupations (%)
Most Common Occupations - Business and financial operations occupations (%)
Most Common Occupations - Computer, engineering, and science occupations (%)
Most Common Occupations - Computer and mathematical occupations (%)
Most Common Occupations - Architecture and engineering occupations (%)
Most Common Occupations - Life, physical, and social science occupations (%)
Most Common Occupations - Education, legal, community service, arts, and media occupations (%)
Most Common Occupations - Community and social service occupations (%)
Most Common Occupations - Legal occupations (%)
Most Common Occupations - Education, training, and library occupations (%)
Most Common Occupations - Arts, design, entertainment, sports, and media occupations (%)
Most Common Occupations - Healthcare practitioners and technical occupations (%)
Most Common Occupations - Health diagnosing and treating practitioners and other technical occupations (%)
Most Common Occupations - Health technologists and technicians (%)
Most Common Occupations - Service occupations (%)
Most Common Occupations - Healthcare support occupations (%)
Most Common Occupations - Protective service occupations (%)
Most Common Occupations - Fire fighting and prevention, and other protective service workers including supervisors (%)
Most Common Occupations - Law enforcement workers including supervisors (%)
Most Common Occupations - Food preparation and serving related occupations (%)
Most Common Occupations - Building and grounds cleaning and maintenance occupations (%)
Most Common Occupations - Personal care and service occupations (%)
Most Common Occupations - Sales and office occupations (%)
Most Common Occupations - Sales and related occupations (%)
Most Common Occupations - Office and administrative support occupations (%)
Most Common Occupations - Natural resources, construction, and maintenance occupations (%)
Most Common Occupations - Farming, fishing, and forestry occupations (%)
Most Common Occupations - Construction and extraction occupations (%)
Most Common Occupations - Installation, maintenance, and repair occupations (%)
Most Common Occupations - Production, transportation, and material moving occupations (%)
Most Common Occupations - Production occupations (%)
Most Common Occupations - Transportation occupations (%)
Most Common Occupations - Material moving occupations (%)
People in Group quarters - Institutionalized population (%)
People in Group quarters - Correctional institutions (%)
People in Group quarters - Federal prisons and detention centers (%)
People in Group quarters - Halfway houses (%)
People in Group quarters - Local jails and other confinement facilities (including police lockups) (%)
People in Group quarters - Military disciplinary barracks (%)
People in Group quarters - State prisons (%)
People in Group quarters - Other types of correctional institutions (%)
People in Group quarters - Nursing homes (%)
People in Group quarters - Hospitals/wards, hospices, and schools for the handicapped (%)
People in Group quarters - Hospitals/wards and hospices for chronically ill (%)
People in Group quarters - Hospices or homes for chronically ill (%)
People in Group quarters - Military hospitals or wards for chronically ill (%)
People in Group quarters - Other hospitals or wards for chronically ill (%)
People in Group quarters - Hospitals or wards for drug/alcohol abuse (%)
People in Group quarters - Mental (Psychiatric) hospitals or wards (%)
People in Group quarters - Schools, hospitals, or wards for the mentally retarded (%)
People in Group quarters - Schools, hospitals, or wards for the physically handicapped (%)
People in Group quarters - Institutions for the deaf (%)
People in Group quarters - Institutions for the blind (%)
People in Group quarters - Orthopedic wards and institutions for the physically handicapped (%)
People in Group quarters - Wards in general hospitals for patients who have no usual home elsewhere (%)
People in Group quarters - Wards in military hospitals for patients who have no usual home elsewhere (%)
People in Group quarters - Juvenile institutions (%)
People in Group quarters - Long-term care (%)
People in Group quarters - Homes for abused, dependent, and neglected children (%)
People in Group quarters - Residential treatment centers for emotionally disturbed children (%)
People in Group quarters - Training schools for juvenile delinquents (%)
People in Group quarters - Short-term care, detention or diagnostic centers for delinquent children (%)
People in Group quarters - Type of juvenile institution unknown (%)
People in Group quarters - Noninstitutionalized population (%)
People in Group quarters - College dormitories (includes college quarters off campus) (%)
People in Group quarters - Military quarters (%)
People in Group quarters - On base (%)
People in Group quarters - Barracks, unaccompanied personnel housing (UPH), (Enlisted/Officer), ;and similar group living quarters for military personnel (%)
People in Group quarters - Transient quarters for temporary residents (%)
People in Group quarters - Military ships (%)
People in Group quarters - Group homes (%)
People in Group quarters - Homes or halfway houses for drug/alcohol abuse (%)
People in Group quarters - Homes for the mentally ill (%)
People in Group quarters - Homes for the mentally retarded (%)
People in Group quarters - Homes for the physically handicapped (%)
People in Group quarters - Other group homes (%)
People in Group quarters - Religious group quarters (%)
People in Group quarters - Dormitories (%)
People in Group quarters - Agriculture workers' dormitories on farms (%)
People in Group quarters - Job Corps and vocational training facilities (%)
People in Group quarters - Other workers' dormitories (%)
People in Group quarters - Crews of maritime vessels (%)
People in Group quarters - Other nonhousehold living situations (%)
People in Group quarters - Other noninstitutional group quarters (%)
Residents speaking English at home (%)
Residents speaking English at home - Born in the United States (%)
Residents speaking English at home - Native, born elsewhere (%)
Residents speaking English at home - Foreign born (%)
Residents speaking Spanish at home (%)
Residents speaking Spanish at home - Born in the United States (%)
Residents speaking Spanish at home - Native, born elsewhere (%)
Residents speaking Spanish at home - Foreign born (%)
Residents speaking other language at home (%)
Residents speaking other language at home - Born in the United States (%)
Residents speaking other language at home - Native, born elsewhere (%)
Residents speaking other language at home - Foreign born (%)
Class of Workers - Employee of private company (%)
Class of Workers - Self-employed in own incorporated business (%)
Class of Workers - Private not-for-profit wage and salary workers (%)
Class of Workers - Local government workers (%)
Class of Workers - State government workers (%)
Class of Workers - Federal government workers (%)
Class of Workers - Self-employed workers in own not incorporated business and Unpaid family workers (%)
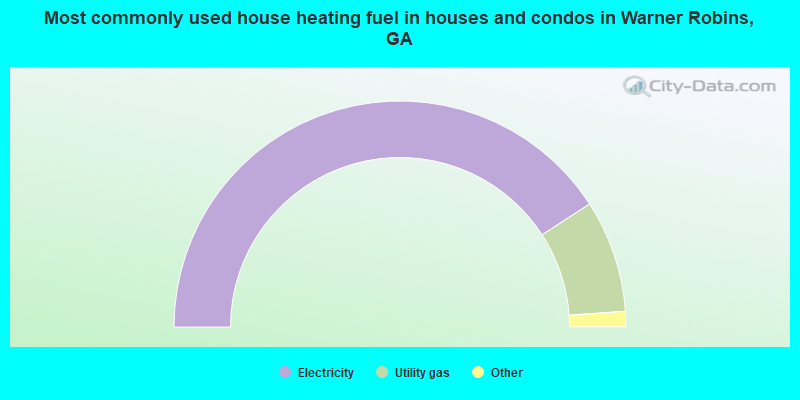
House heating fuel used in houses and condos - Utility gas (%)
House heating fuel used in houses and condos - Bottled, tank, or LP gas (%)
House heating fuel used in houses and condos - Electricity (%)
House heating fuel used in houses and condos - Fuel oil, kerosene, etc. (%)
House heating fuel used in houses and condos - Coal or coke (%)
House heating fuel used in houses and condos - Wood (%)
House heating fuel used in houses and condos - Solar energy (%)
House heating fuel used in houses and condos - Other fuel (%)
House heating fuel used in houses and condos - No fuel used (%)
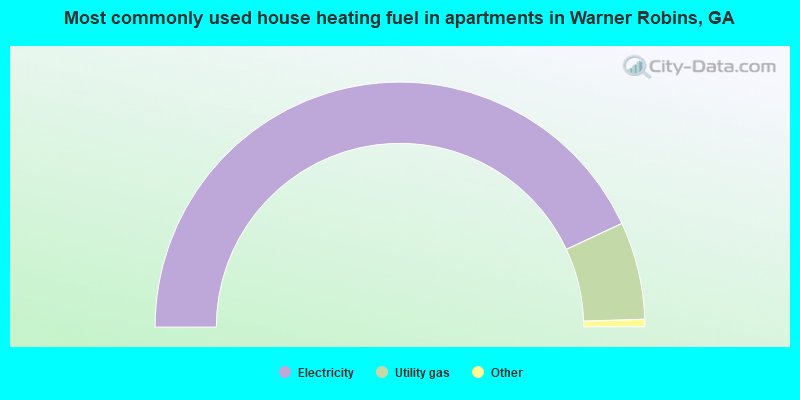
House heating fuel used in apartments - Utility gas (%)
House heating fuel used in apartments - Bottled, tank, or LP gas (%)
House heating fuel used in apartments - Electricity (%)
House heating fuel used in apartments - Fuel oil, kerosene, etc. (%)
House heating fuel used in apartments - Coal or coke (%)
House heating fuel used in apartments - Wood (%)
House heating fuel used in apartments - Solar energy (%)
House heating fuel used in apartments - Other fuel (%)
House heating fuel used in apartments - No fuel used (%)
Armed forces status - In Armed Forces (%)
Armed forces status - Civilian (%)
Armed forces status - Civilian - Veteran (%)
Armed forces status - Civilian - Nonveteran (%)
Fatal accidents locations in years 2005-2021
Fatal accidents locations in 2005
Fatal accidents locations in 2006
Fatal accidents locations in 2007
Fatal accidents locations in 2008
Fatal accidents locations in 2009
Fatal accidents locations in 2010
Fatal accidents locations in 2011
Fatal accidents locations in 2012
Fatal accidents locations in 2013
Fatal accidents locations in 2014
Fatal accidents locations in 2015
Fatal accidents locations in 2016
Fatal accidents locations in 2017
Fatal accidents locations in 2018
Fatal accidents locations in 2019
Fatal accidents locations in 2020
Fatal accidents locations in 2021
Alcohol use - People drinking some alcohol every month (%)
Alcohol use - People not drinking at all (%)
Alcohol use - Average days/month drinking alcohol
Alcohol use - Average drinks/week
Alcohol use - Average days/year people drink much
Audiometry - Average condition of hearing (%)
Audiometry - People that can hear a whisper from across a quiet room (%)
Audiometry - People that can hear normal voice from across a quiet room (%)
Audiometry - Ears ringing, roaring, buzzing (%)
Audiometry - Had a job exposure to loud noise (%)
Audiometry - Had off-work exposure to loud noise (%)
Blood Pressure & Cholesterol - Has high blood pressure (%)
Blood Pressure & Cholesterol - Checking blood pressure at home (%)
Blood Pressure & Cholesterol - Frequently checking blood cholesterol (%)
Blood Pressure & Cholesterol - Has high cholesterol level (%)
Consumer Behavior - Money monthly spent on food at supermarket/grocery store
Consumer Behavior - Money monthly spent on food at other stores
Consumer Behavior - Money monthly spent on eating out
Consumer Behavior - Money monthly spent on carryout/delivered foods
Consumer Behavior - Income spent on food at supermarket/grocery store (%)
Consumer Behavior - Income spent on food at other stores (%)
Consumer Behavior - Income spent on eating out (%)
Consumer Behavior - Income spent on carryout/delivered foods (%)
Current Health Status - General health condition (%)
Current Health Status - Blood donors (%)
Current Health Status - Has blood ever tested for HIV virus (%)
Current Health Status - Left-handed people (%)
Dermatology - People using sunscreen (%)
Diabetes - Diabetics (%)
Diabetes - Had a blood test for high blood sugar (%)
Diabetes - People taking insulin (%)
Diet Behavior & Nutrition - Diet health (%)
Diet Behavior & Nutrition - Milk product consumption (# of products/month)
Diet Behavior & Nutrition - Meals not home prepared (#/week)
Diet Behavior & Nutrition - Meals from fast food or pizza place (#/week)
Diet Behavior & Nutrition - Ready-to-eat foods (#/month)
Diet Behavior & Nutrition - Frozen meals/pizza (#/month)
Drug Use - People that ever used marijuana or hashish (%)
Drug Use - Ever used hard drugs (%)
Drug Use - Ever used any form of cocaine (%)
Drug Use - Ever used heroin (%)
Drug Use - Ever used methamphetamine (%)
Health Insurance - People covered by health insurance (%)
Kidney Conditions-Urology - Avg. # of times urinating at night
Medical Conditions - People with asthma (%)
Medical Conditions - People with anemia (%)
Medical Conditions - People with psoriasis (%)
Medical Conditions - People with overweight (%)
Medical Conditions - Elderly people having difficulties in thinking or remembering (%)
Medical Conditions - People who ever received blood transfusion (%)
Medical Conditions - People having trouble seeing even with glass/contacts (%)
Medical Conditions - People with arthritis (%)
Medical Conditions - People with gout (%)
Medical Conditions - People with congestive heart failure (%)
Medical Conditions - People with coronary heart disease (%)
Medical Conditions - People with angina pectoris (%)
Medical Conditions - People who ever had heart attack (%)
Medical Conditions - People who ever had stroke (%)
Medical Conditions - People with emphysema (%)
Medical Conditions - People with thyroid problem (%)
Medical Conditions - People with chronic bronchitis (%)
Medical Conditions - People with any liver condition (%)
Medical Conditions - People who ever had cancer or malignancy (%)
Mental Health - People who have little interest in doing things (%)
Mental Health - People feeling down, depressed, or hopeless (%)
Mental Health - People who have trouble sleeping or sleeping too much (%)
Mental Health - People feeling tired or having little energy (%)
Mental Health - People with poor appetite or overeating (%)
Mental Health - People feeling bad about themself (%)
Mental Health - People who have trouble concentrating on things (%)
Mental Health - People moving or speaking slowly or too fast (%)
Mental Health - People having thoughts they would be better off dead (%)
Oral Health - Average years since last visit a dentist
Oral Health - People embarrassed because of mouth (%)
Oral Health - People with gum disease (%)
Oral Health - General health of teeth and gums (%)
Oral Health - Average days a week using dental floss/device
Oral Health - Average days a week using mouthwash for dental problem
Oral Health - Average number of teeth
Pesticide Use - Households using pesticides to control insects (%)
Pesticide Use - Households using pesticides to kill weeds (%)
Physical Activity - People doing vigorous-intensity work activities (%)
Physical Activity - People doing moderate-intensity work activities (%)
Physical Activity - People walking or bicycling (%)
Physical Activity - People doing vigorous-intensity recreational activities (%)
Physical Activity - People doing moderate-intensity recreational activities (%)
Physical Activity - Average hours a day doing sedentary activities
Physical Activity - Average hours a day watching TV or videos
Physical Activity - Average hours a day using computer
Physical Functioning - People having limitations keeping them from working (%)
Physical Functioning - People limited in amount of work they can do (%)
Physical Functioning - People that need special equipment to walk (%)
Physical Functioning - People experiencing confusion/memory problems (%)
Physical Functioning - People requiring special healthcare equipment (%)
Prescription Medications - Average number of prescription medicines taking
Preventive Aspirin Use - Adults 40+ taking low-dose aspirin (%)
Reproductive Health - Vaginal deliveries (%)
Reproductive Health - Cesarean deliveries (%)
Reproductive Health - Deliveries resulted in a live birth (%)
Reproductive Health - Pregnancies resulted in a delivery (%)
Reproductive Health - Women breastfeeding newborns (%)
Reproductive Health - Women that had a hysterectomy (%)
Reproductive Health - Women that had both ovaries removed (%)
Reproductive Health - Women that have ever taken birth control pills (%)
Reproductive Health - Women taking birth control pills (%)
Reproductive Health - Women that have ever used Depo-Provera or injectables (%)
Reproductive Health - Women that have ever used female hormones (%)
Sexual Behavior - People 18+ that ever had sex (vaginal, anal, or oral) (%)
Sexual Behavior - Males 18+ that ever had vaginal sex with a woman (%)
Sexual Behavior - Males 18+ that ever performed oral sex on a woman (%)
Sexual Behavior - Males 18+ that ever had anal sex with a woman (%)
Sexual Behavior - Males 18+ that ever had any sex with a man (%)
Sexual Behavior - Females 18+ that ever had vaginal sex with a man (%)
Sexual Behavior - Females 18+ that ever performed oral sex on a man (%)
Sexual Behavior - Females 18+ that ever had anal sex with a man (%)
Sexual Behavior - Females 18+ that ever had any kind of sex with a woman (%)
Sexual Behavior - Average age people first had sex
Sexual Behavior - Average number of female sex partners in lifetime (males 18+)
Sexual Behavior - Average number of female vaginal sex partners in lifetime (males 18+)
Sexual Behavior - Average age people first performed oral sex on a woman (18+)
Sexual Behavior - Average number of woman performed oral sex on in lifetime (18+)
Sexual Behavior - Average number of male sex partners in lifetime (males 18+)
Sexual Behavior - Average number of male anal sex partners in lifetime (males 18+)
Sexual Behavior - Average age people first performed oral sex on a man (18+)
Sexual Behavior - Average number of male oral sex partners in lifetime (18+)
Sexual Behavior - People using protection when performing oral sex (%)
Sexual Behavior - Average number of times people have vaginal or anal sex a year
Sexual Behavior - People having sex without condom (%)
Sexual Behavior - Average number of male sex partners in lifetime (females 18+)
Sexual Behavior - Average number of male vaginal sex partners in lifetime (females 18+)
Sexual Behavior - Average number of female sex partners in lifetime (females 18+)
Sexual Behavior - Circumcised males 18+ (%)
Sleep Disorders - Average hours sleeping at night
Sleep Disorders - People that has trouble sleeping (%)
Smoking-Cigarette Use - People smoking cigarettes (%)
Taste & Smell - People 40+ having problems with smell (%)
Taste & Smell - People 40+ having problems with taste (%)
Taste & Smell - People 40+ that ever had wisdom teeth removed (%)
Taste & Smell - People 40+ that ever had tonsils teeth removed (%)
Taste & Smell - People 40+ that ever had a loss of consciousness because of a head injury (%)
Taste & Smell - People 40+ that ever had a broken nose or other serious injury to face or skull (%)
Taste & Smell - People 40+ that ever had two or more sinus infections (%)
Weight - Average height (inches)
Weight - Average weight (pounds)
Weight - Average BMI
Weight - People that are obese (%)
Weight - People that ever were obese (%)
Weight - People trying to lose weight (%)
The City-Data.com crime index weighs serious crimes and violent crimes more heavily. Higher means more crime, U.S. average is 246.1. It adjusts for the number of visitors and daily workers commuting into cities.
- means the value is smaller than the state average.
- means the value is about the same as the state average.
- means the value is bigger than the state average.
- means the value is much bigger than the state average.
Crime rate in Warner Robins detailed stats: murders, rapes, robberies, assaults, burglaries, thefts, arson Officers per 1,000 residents here:
1.36Georgia average:
2.45
Latest news from Warner Robins, GA collected exclusively by city-data.com from local newspapers, TV, and radio stations
Ancestries: American (15.8%), English (8.3%), German (4.1%), Irish (3.9%), Italian (1.9%), European (1.9%).
Current Local Time:
Land area: 22.8 square miles.
Population density: 3,610 people per square mile (average).
6,626 residents are foreign born (3.2% Latin America , 2.5% Asia , 1.2% Africa ).
This city:
8.0%Georgia:
10.4%
Median real estate property taxes paid for housing units with mortgages in 2022: $1,747 (0.9%)Median real estate property taxes paid for housing units with no mortgage in 2022: $1,037 (0.8%)
Nearest city with pop. 50,000+: Macon, GA
Nearest city with pop. 200,000+: Atlanta, GA
Nearest city with pop. 1,000,000+: Chicago, IL
Nearest cities:
Latitude: 32.61 N, Longitude: 83.64 W
Daytime population change due to commuting: -3,894 (-4.8%)Workers who live and work in this city: 17,182 (42.9%)
Single-family new house construction building permits:
2022: 728 buildings , average cost: $202,0002021: 453 buildings , average cost: $180,4002020: 400 buildings , average cost: $191,5002019: 311 buildings , average cost: $189,0002018: 229 buildings , average cost: $184,2002017: 317 buildings , average cost: $178,3002016: 270 buildings , average cost: $190,8002015: 211 buildings , average cost: $191,7002014: 189 buildings , average cost: $193,6002013: 216 buildings , average cost: $185,5002012: 232 buildings , average cost: $186,8002011: 263 buildings , average cost: $157,7002010: 319 buildings , average cost: $134,1002009: 345 buildings , average cost: $128,1002008: 338 buildings , average cost: $113,9002007: 558 buildings , average cost: $110,2002006: 724 buildings , average cost: $108,9002005: 720 buildings , average cost: $105,5002004: 918 buildings , average cost: $94,4002003: 742 buildings , average cost: $82,5002002: 717 buildings , average cost: $70,5002001: 1004 buildings , average cost: $65,8002000: 585 buildings , average cost: $61,6001999: 380 buildings , average cost: $60,2001998: 235 buildings , average cost: $61,3001997: 247 buildings , average cost: $58,200Unemployment in December 2023:
Population change in the 1990s: +2,583 (+5.6%).
Most common occupations in Warner Robins, GA (%)
Both Males Females
Vehicle and mobile equipment mechanics, installers, and repairers (4.6%)
Other sales and related occupations, including supervisors (4.0%)
Electrical equipment mechanics and other installation, maintenance, and repair workers, including supervisors (4.0%)
Other production occupations, including supervisors (3.9%)
Other office and administrative support workers, including supervisors (3.8%)
Material recording, scheduling, dispatching, and distributing workers (3.7%)
Building and grounds cleaning and maintenance occupations (3.2%)
Vehicle and mobile equipment mechanics, installers, and repairers (8.8%)
Electrical equipment mechanics and other installation, maintenance, and repair workers, including supervisors (6.7%)
Other production occupations, including supervisors (5.3%)
Material recording, scheduling, dispatching, and distributing workers (4.6%)
Other sales and related occupations, including supervisors (3.8%)
Construction traders workers except carpenters, electricians, painters, plumbers, and construction laborers (3.7%)
Building and grounds cleaning and maintenance occupations (3.5%)
Other office and administrative support workers, including supervisors (5.5%)
Preschool, kindergarten, elementary, and middle school teachers (5.1%)
Secretaries and administrative assistants (5.1%)
Cashiers (5.1%)
Other sales and related occupations, including supervisors (4.3%)
Information and record clerks, except customer service representatives (3.9%)
Other management occupations, except farmers and farm managers (3.5%)
Tornado activity:
Warner Robins-area historical tornado activity is near Georgia state average. It is 25% greater than the overall U.S. average.
On 4/30/1953, a category F4 (max. wind speeds 207-260 mph) tornado 2.3 miles away from the Warner Robins city center killed 18 people and injured 300 people and caused between $5,000,000 and $50,000,000 in damages.
On 2/18/1975, a category F3 (max. wind speeds 158-206 mph) tornado 8.7 miles away from the city center killed 2 people and injured 50 people and caused between $5,000,000 and $50,000,000 in damages.
Earthquake activity:
Warner Robins-area historical earthquake activity is significantly above Georgia state average. It is 4% greater than the overall U.S. average. On 8/2/1974 at 08:52:09, a magnitude 4.9 (4.3 MB, 4.9 LG, Class: Light, Intensity: IV - V) earthquake occurred 109.8 miles away from the city center On 4/29/2003 at 08:59:39, a magnitude 4.9 (4.4 MB, 4.6 MW, 4.9 LG) earthquake occurred 173.7 miles away from Warner Robins center On 4/29/2003 at 08:59:39, a magnitude 4.6 (4.6 MW, Depth: 12.3 mi) earthquake occurred 173.7 miles away from the city center On 1/18/1999 at 07:00:53, a magnitude 4.8 (4.8 MB, 4.0 LG, Depth: 0.6 mi) earthquake occurred 216.9 miles away from the city center On 10/24/1997 at 08:35:17, a magnitude 4.9 (4.8 MB, 4.2 MS, 4.9 LG, Depth: 6.2 mi) earthquake occurred 236.9 miles away from Warner Robins center On 11/22/1974 at 05:25:55, a magnitude 4.7 (4.7 MB) earthquake occurred 204.2 miles away from Warner Robins center Magnitude types: regional Lg-wave magnitude (LG), body-wave magnitude (MB), surface-wave magnitude (MS), moment magnitude (MW) Natural disasters: The number of natural disasters in Houston County (11) is smaller than the US average (15).Major Disasters (Presidential) Declared: 6Emergencies Declared: 4Floods: 4, Hurricanes: 2, Storms: 2, Tornadoes: 2, Tropical Storms: 2, Winter Storms: 2, Drought: 1, Heavy Rain: 1, Snowfall: 1, Other: 1 (Note: some incidents may be assigned to more than one category). Hospitals in Warner Robins: COMPREHENSIVE CARE OF GEORGIA INC (511 N HOUSTON ROAD SUITE B-5) HEART OF GEORGIA, INC (103 WESTRIDGE DRIVE) HOUSTON MEDICAL CENTER (Voluntary non-profit - Private, provides emergency services, 1601 WATSON BOULEVARD) Nursing Homes in Warner Robins: ELBERTA CONVALESCENT HOME (419 ELBERTA RD) ELBERTA HEALTH CARE (419 ELBERTA ROAD) PEACHBELT HEALTH AND REHAB CTR (801 ELBERTA RD) PEACHBELT HEALTH CARE (801 ELBERTA ROAD) WARNER ROBINS NURSING CENTER INC (1601 ELBERTA ROAD) WARNER ROBINS REHABILITATION CENTER (1601 ELBERTA ROAD) Dialysis Facilities in Warner Robins: BMA OF WARNER ROBINS, INC. (118 OSIGIAN BLVD) DIALYSIS CENTER OF MIDDLE GEORGIA (509 NORTH HOUSTON RD) FMC DIALYSIS SERVICES OF HOUSTON COUNTY (816 DUKE AVENUE) Amtrak station near Warner Robins: 17 miles: MACON (GREYHOUND STA., 65 SPRING ST.) - Bus Station Services: enclosed waiting area, public restrooms, public payphones, taxi stand.
Colleges/Universities in Warner Robins: Central Georgia Technical College Full-time enrollment: 6,829; Location: 80 Cohen Walker Drive; Public; Website: www.centralgatech.edu)
Middle Georgia Technical College Location: 80 Cohen Walker Dr; Public; Website: www.middlegatech.edu)
Other colleges/universities with over 2000 students near Warner Robins:
Middle Georgia State College (about 15 miles; Macon, GA ; Full-time enrollment: 7,091)
Mercer University (about 16 miles; Macon, GA ; FT enrollment: 6,297)
Fort Valley State University (about 16 miles; Fort Valley, GA ; FT enrollment: 3,200)
Georgia College and State University (about 41 miles; Milledgeville, GA ; FT enrollment: 6,271)
Georgia Military College-Distance Learning Campuses (about 41 miles; Milledgeville, GA ; FT enrollment: 6,438)
Gordon State College (about 43 miles; Barnesville, GA ; FT enrollment: 3,336)
Georgia Southwestern State University (about 51 miles; Americus, GA ; FT enrollment: 2,689)
Public high schools in Warner Robins: HOUSTON COUNTY HIGH SCHOOL Students: 2,238, Location: 920 GA HIGHWAY 96, Grades: 9-12)WARNER ROBINS HIGH SCHOOL Students: 2,077, Location: 401 S DAVIS DR, Grades: 9-12)NORTHSIDE HIGH SCHOOL Students: 1,887, Location: 926 GREEN ST, Grades: 9-12)HOUSTON COUNTY CAREER ACADEMY Students: 98, Location: 1311 CORDER RD, Grades: 10-12, Charter school )HOUSTON COUNTY CROSSROADS CENTER Location: 215 SCOTT BLVD, Grades: 6-12)
Private high school in Warner Robins: WARNER ROBINS CHRISTIAN ACADEMY Students: 24, Location: 2601 WATSON BLVD, Grades: UG-12)
Biggest public elementary/middle schools in Warner Robins: HUNTINGTON MIDDLE SCHOOL Students: 759, Location: 206 WELLBORN RD, Grades: 6-8)WARNER ROBINS MIDDLE SCHOOL Students: 747, Location: 425 MARY LN, Grades: 6-8)DAVID A. PERDUE PRIMARY Students: 691, Location: 150 BEAR COUNTRY BLVD, Grades: PK-2)QUAIL RUN ELEMENTARY SCHOOL Students: 674, Location: 250 SMITHVILLE CHURCH RD, Grades: PK-5)NORTHSIDE MIDDLE SCHOOL Students: 652, Location: 500 JOHNSON RD, Grades: 6-8)FEAGIN MILL MIDDLE SCHOOL Students: 630, Location: 1200 FEAGIN MILL RD, Grades: 6-8)LAKE JOY PRIMARY SCHOOL Students: 611, Location: 995 LAKE JOY RD, Grades: PK-2)PARKWOOD ELEMENTARY SCHOOL Students: 571, Location: 503 PARKWOOD DR, Grades: PK-5)LAKE JOY ELEMENTARY SCHOOL Students: 552, Location: 985 LAKE JOY RD, Grades: 3-5)SHIRLEY HILLS ELEMENTARY SCHOOL Students: 552, Location: 300 MARY LN, Grades: PK-5)Private elementary/middle schools in Warner Robins: CHRIST UNITED METHODIST SCHOOL Students: 216, Location: 511 RUSSELL PKWY, Grades: PK-5)
SACRED HEART CATHOLIC SCHOOL Students: 191, Location: 250 S DAVIS DR, Grades: PK-8)
CHRISTIAN FELLOWSHIP ACADEMY Students: 68, Location: 621 WALNUT ST, Grades: PK-5)
See full list of schools located in Warner Robins
Notable locations in Warner Robins: (A) , Sandy Run Golf Club (B) , International City Speedway (C) , Warner Robins Fire Department Station 6 (D) , Warner Robins City Hall (E) , Warner Robins Fire Department Station 5 (F) , Houston County Fire Department Station 1 (G) , Warner Robins Fire Department Station 3 (H) , Warner Robins Fire Department Station 7 (I) , Warner Robins Fire Department Station 1 (J) , Warner Robins Fire Department Station 4 (K) . Display/hide their locations on the map
Shopping Centers: (1) , Watson Central Shopping Center (2) , Robins Plaza Shopping Center (3) , Houston Mall Shopping Center (4) . Display/hide their locations on the map
Churches in Warner Robins include: (A) , Union Grove Baptist Church (B) , Trinity United Methodist Church (C) , Springfield Church (D) , Shirley Hills Baptist Church (E) , Sandy Run Church (F) , Sacred Heart Catholic Church (G) , Oakland Baptist Church (H) , Oak Ridge Church (I) . Display/hide their locations on the map
Cemeteries: (1) , Magnolia Park Cemetery (2) , Memorial Park (3) , Smith Cemetery (4) , Mount Pleasant Cemetery (5) . Display/hide their locations on the map
Reservoir: (A) . Display/hide its location on the map
Streams, rivers, and creeks: (A) , Cainey Branch (B) , Bay Gall Creek (C) . Display/hide their locations on the map
Parks in Warner Robins include: (1) , Bill Peavy Memorial Park (2) , Briarcliff Park (3) , Heritage Hills Park (4) , Dry Lake Park (5) , Jesse Tanner Memorial Park (6) , Alex Ferguson Memorial Park (7) . Display/hide their locations on the map
Tourist attractions: (1) , Houston County Libraries-Warnerbns HSTN County Lbrry (Cultural Attractions- Events- & Facilities; 721 Watson Boulevard) (2) , Museum of Aviation - Museum Offices (Cultural Attractions- Events- & Facilities; Highway 247 & Russel) (3) , Gold Cup Bowling Center Inc (Amusement & Theme Parks; 1042 North Houston Road) (4) , Andrew Pierce Travel (Tours & Charters; 1221 South Houston Lake Road Suite 3) (5) . Display/hide their approximate locations on the map
Hotels: (1) , Hampton Inn (4000 Watson Blvd) (2) , Country Inn-Stes Warner Robin (220 Margie Drive) (3) , Air Force Inn (2076 Watson Boulevard) (4) , Comfort Inn & Suites Robins Afb (95 South Sr 247) (5) , Bradbury Inn & Suites (102 Rigby Drive) (6) , Budget Inn Motel (2076 Watson Boulevard) (7) , Admiral Benbow Inn (2079 Watson Boulevard) (8) , Best Western Peach Inn (2739 Watson Boulevard) (9) . Display/hide their approximate locations on the map
Courts: (1) , Georgia State Government - Corrections Department- Probation Office-Superior C (281 Carl Vinson Parkway Suite D) (2) . Display/hide their approximate locations on the map
Birthplace of: Bobbie Eakes - Soap opera actor, Kiwaukee Thomas - 2005 NFL player (Miami Dolphins, born : Jun 19, 1977), Patrick Henry (basketball) - Basketball player-coach, Russell Branyan - 2005 Major League Baseball player (Milwaukee Brewers, born : Dec 19, 1975), Willie Blade - 2005 NFL player (Dallas Cowboys, born : Feb 7, 1979), James Brooks (American football) - Football player, Kris Blanks - Professional golfer, Ben Smith (cornerback) - Football player, Chansi Stuckey - Football player, Eddie Anderson (safety) - Football player.
Houston County has a predicted average indoor radon screening level less than 2 pCi/L (pico curies per liter) - Low Potential Average household size: This city:
2.5 peopleGeorgia:
2.6 people
Percentage of family households: This city:
66.2%Whole state:
68.5%
Percentage of households with unmarried partners: This city:
6.5%Whole state:
5.9%
Likely homosexual households (counted as self-reported same-sex unmarried-partner households)
Lesbian couples: 0.4% of all households Gay men: 0.2% of all households
People in group quarters in Warner Robins in 2010:
208 people in nursing facilities/skilled-nursing facilities
64 people in other noninstitutional facilities
32 people in group homes intended for adults
15 people in local jails and other municipal confinement facilities
10 people in residential treatment centers for adults
9 people in emergency and transitional shelters (with sleeping facilities) for people experiencing homelessness
People in group quarters in Warner Robins in 2000:
292 people in nursing homes
74 people in other noninstitutional group quarters
31 people in homes for the mentally ill
12 people in homes for the mentally retarded
Banks with most branches in Warner Robins (2011 data):
SunTrust Bank: Watson Boulevard Branch, Houston Crossing, Galleria Branch, Robins Branch. Info updated 2010/05/27: Bank assets: $171,291.7 mil, Deposits: $129,833.2 mil, headquarters in Atlanta, GA, positive income , Commercial Lending Specialization, 1716 total offices , Holding Company: Suntrust Banks, Inc.
Synovus Bank: Warner Robins Branch, Houston Lake Road Branch, 871 Warren Drive. Info updated 2011/01/25: Bank assets: $26,863.3 mil, Deposits: $22,415.0 mil, headquarters in Columbus, GA, positive income , Commercial Lending Specialization, 296 total offices , Holding Company: Synovus Financial Corp.
Branch Banking and Trust Company: Galleria Mall Branch, Russell Parkway Branch, Lake Joy Branch. Info updated 2010/03/29: Bank assets: $168,867.6 mil, Deposits: $127,549.5 mil, headquarters in Winston Salem, NC, positive income , Commercial Lending Specialization, 1793 total offices , Holding Company: Bb&T Corporation
State Bank and Trust Company: Highway 96 Branch at 849 Warren Drive, branch established on 2004/09/07; Houston Lake Road Branch at 119 South Houston Lake Road, branch established on 2000/01/24. Info updated 2011/10/24: Bank assets: $2,746.8 mil, Deposits: $2,314.3 mil, headquarters in Macon, GA, positive income , Commercial Lending Specialization, 31 total offices , Holding Company: State Bank Financial Corporation
CertusBank, National Association: S. Houston Lake Road Office Branch at 464 S. Houston Lake Road, branch established on 2005/04/07. Info updated 2011/05/23: Bank assets: $1,817.6 mil, Deposits: $1,457.3 mil, headquarters in Easley, SC, positive income , Commercial Lending Specialization, 36 total offices , Holding Company: Certusholdings, Inc.
Citizens Bank & Trust Company: Citizens Bank & Trust Branch at 1041 Highway 96, branch established on 2009/03/30. Info updated 2006/11/03: Bank assets: $145.5 mil, Deposits: $128.1 mil, headquarters in Eastman, GA, negative income in the last year , 6 total offices , Holding Company: Citizens Corporation
Colony Bank: Warner Robbins Branch at 1290 South Houston Lake Road, branch established on 2001/07/26. Info updated 2011/04/20: Bank assets: $1,192.8 mil, Deposits: $1,001.0 mil, headquarters in Fitzgerald, GA, positive income , Commercial Lending Specialization, 29 total offices , Holding Company: Colony Bankcorp, Inc.
Bank of America, National Association: Russell Parkway Branch at 111 Russell Parkway, branch established on 1982/04/06. Info updated 2009/11/18: Bank assets: $1,451,969.3 mil, Deposits: $1,077,176.8 mil, headquarters in Charlotte, NC, positive income , 5782 total offices , Holding Company: Bank Of America Corporation
Wells Fargo Bank, National Association: Warner Robins Place at 2714 Watson Blvd, branch established on 1947/04/20. Info updated 2011/04/05: Bank assets: $1,161,490.0 mil, Deposits: $905,653.0 mil, headquarters in Sioux Falls, SD, positive income , 6395 total offices , Holding Company: Wells Fargo & Company
2 other banks with 2 local branches
For population 15 years and over in Warner Robins:
Never married: 39.5%Now married: 43.0%Separated: 0.8%Widowed: 4.8%Divorced: 11.9% For population 25 years and over in Warner Robins:
High school or higher: 91.4%Bachelor's degree or higher: 28.9%Graduate or professional degree: 12.7%Unemployed: 6.1%Mean travel time to work (commute): 20.0 minutes
Education Gini index (Inequality in education) Here:
11.0Georgia average:
12.2
Religion statistics for Warner Robins, GA (based on Houston County data)
Religion Adherents Congregations Evangelical Protestant 45,802 103 Mainline Protestant 15,046 17 Catholic 6,124 2 Other 4,592 10 Black Protestant 2,267 11 None 66,069 -
Source: Clifford Grammich, Kirk Hadaway, Richard Houseal, Dale E.Jones, Alexei Krindatch, Richie Stanley and Richard H.Taylor. 2012. 2010 U.S.Religion Census: Religious Congregations & Membership Study. Association of Statisticians of American Religious Bodies. Jones, Dale E., et al. 2002. Congregations and Membership in the United States 2000. Nashville, TN: Glenmary Research Center. Graphs represent county-level data
Food Environment Statistics: Number of grocery stores : 21Here :
1.60 / 10,000 pop.Georgia :
1.91 / 10,000 pop.
Number of supercenters and club stores : 2This county :
0.15 / 10,000 pop.State :
0.15 / 10,000 pop.
Number of convenience stores (no gas) : 14This county :
1.07 / 10,000 pop.Georgia :
0.86 / 10,000 pop.
Number of convenience stores (with gas) : 63Here :
4.81 / 10,000 pop.State :
5.12 / 10,000 pop.
Number of full-service restaurants : 79This county :
6.03 / 10,000 pop.Georgia :
7.41 / 10,000 pop.
Adult diabetes rate : Houston County :
12.4%Georgia :
10.4%
Adult obesity rate : This county :
30.8%Georgia :
27.8%
Low-income preschool obesity rate : This county :
12.1%Georgia :
14.6%
Health and Nutrition:
Average overall health of teeth and gums : Warner Robins:
45.8%State:
46.5%
Average BMI : Warner Robins:
29.1State:
28.9
People feeling badly about themselves : Warner Robins:
20.0%Georgia:
20.4%
People not drinking alcohol at all : Warner Robins:
11.3%Georgia:
10.8%
Average hours sleeping at night : Overweight people : Warner Robins:
34.7%Georgia:
33.5%
General health condition : This city:
55.5%Georgia:
56.2%
Average condition of hearing : This city:
80.3%Georgia:
80.8%
More about Health and Nutrition of Warner Robins, GA Residents
Local government employment and payroll (March 2022)
Function
Full-time employees
Monthly full-time payroll
Average yearly full-time wage
Part-time employees
Monthly part-time payroll
Police Protection - Officers
120 $535,299 $53,530 0 $0 Firefighters
113 $421,276 $44,737 0 $0 Other and Unallocable
95 $334,157 $42,209 0 $0 Streets and Highways
43 $138,754 $38,722 0 $0 Gas Supply
33 $148,972 $54,172 0 $0 Water Supply
28 $95,669 $41,001 0 $0 Parks and Recreation
27 $87,965 $39,096 41 $21,884 Police - Other
26 $100,549 $46,407 16 $14,937 Other Government Administration
21 $82,925 $47,386 0 $0 Financial Administration
19 $74,564 $47,093 0 $0 Sewerage
17 $58,991 $41,641 0 $0 Solid Waste Management
17 $61,621 $43,497 0 $0 Fire - Other
9 $52,172 $69,563 0 $0 Housing and Community Development (Local)
8 $34,839 $52,259 0 $0 Judicial and Legal
2 $13,143 $78,858 0 $0
Totals for Government
578 $2,240,895 $46,524 57 $36,821
Warner Robins government finances - Expenditure in 2021 (per resident):
Construction - Parks and Recreation: $12,355,000 ($150.35)
Judicial and Legal Services: $2,534,000 ($30.84)Regular Highways: $1,669,000 ($20.31)Sewerage: $471,000 ($5.73)General - Other: $218,000 ($2.65)Local Fire Protection: $115,000 ($1.40)General Public Buildings: $97,000 ($1.18)Water Utilities: $31,000 ($0.38)Financial Administration: $27,000 ($0.33)Current Operations - Gas Utilities: $18,050,000 ($219.65)
Police Protection: $16,516,000 ($200.99)Sewerage: $9,798,000 ($119.23)Local Fire Protection: $9,437,000 ($114.84)Solid Waste Management: $8,685,000 ($105.69)General - Other: $8,142,000 ($99.08)Water Utilities: $7,251,000 ($88.24)Regular Highways: $3,864,000 ($47.02)Central Staff Services: $3,500,000 ($42.59)Financial Administration: $3,280,000 ($39.91)Parks and Recreation: $2,786,000 ($33.90)Judicial and Legal Services: $1,063,000 ($12.94)General Public Buildings: $884,000 ($10.76)Protective Inspection and Regulation - Other: $649,000 ($7.90)Housing and Community Development: $584,000 ($7.11)Health - Other: $531,000 ($6.46)Gas Utilities - Interest on Debt: $51,000 ($0.62)
General - Interest on Debt: $4,673,000 ($56.87)
Intergovernmental to Local - Other - Police Protection: $314,000 ($3.82)
Other - General - Other: $223,000 ($2.71)Other - Local Fire Protection: $105,000 ($1.28)Other Capital Outlay - Police Protection: $1,669,000 ($20.31)
Local Fire Protection: $1,271,000 ($15.47)Protective Inspection and Regulation - Other: $144,000 ($1.75)Parks and Recreation: $107,000 ($1.30)Financial Administration: $96,000 ($1.17)General - Other: $53,000 ($0.64)Regular Highways: $45,000 ($0.55)Central Staff Services: $29,000 ($0.35)General Public Building: $9,000 ($0.11)Water Utilities - Interest on Debt: $497,000 ($6.05)
Warner Robins government finances - Revenue in 2021 (per resident):
Charges - Sewerage: $16,840,000 ($204.93)
Solid Waste Management: $8,041,000 ($97.85)Other: $2,292,000 ($27.89)Parks and Recreation: $681,000 ($8.29)Regular Highways: $3,000 ($0.04)Federal Intergovernmental - Other: $8,176,000 ($99.49)
Housing and Community Development: $720,000 ($8.76)Local Intergovernmental - Other: $8,125,000 ($98.87)
General Local Government Support: $207,000 ($2.52)Miscellaneous - Fines and Forfeits: $1,177,000 ($14.32)
General Revenue - Other: $625,000 ($7.61)Sale of Property: $148,000 ($1.80)Rents: $57,000 ($0.69)Donations From Private Sources: $47,000 ($0.57)Interest Earnings: $24,000 ($0.29)Special Assessments: $3,000 ($0.04)Revenue - Electric Utilities: $21,393,000 ($260.33)
Water Utilities: $5,770,000 ($70.22)State Intergovernmental - Other: $4,904,000 ($59.68)
General Local Government Support: $138,000 ($1.68)Public Welfare: $47,000 ($0.57)Tax - Property: $20,601,000 ($250.70)
Insurance Premiums Sales: $5,589,000 ($68.01)Public Utilities Sales: $4,836,000 ($58.85)Other Selective Sales: $2,168,000 ($26.38)Occupation and Business License - Other: $1,762,000 ($21.44)Alcoholic Beverage Sales: $1,423,000 ($17.32)Other License: $431,000 ($5.24)Other: $130,000 ($1.58)
Warner Robins government finances - Debt in 2021 (per resident):
Long Term Debt - Outstanding Unspecified Public Purpose: $75,110,000 ($914.02)
Beginning Outstanding - Unspecified Public Purpose: $60,246,000 ($733.14)Issue, Unspecified Public Purpose: $22,040,000 ($268.21)Retired Unspecified Public Purpose: $7,176,000 ($87.33)
Warner Robins government finances - Cash and Securities in 2021 (per resident):
Bond Funds - Cash and Securities: $48,679,000 ($592.38)
Other Funds - Cash and Securities: $51,843,000 ($630.89)
Sinking Funds - Cash and Securities: $3,635,000 ($44.23)
8.95% of this county's 2021 resident taxpayers lived in other counties in 2020 ($48,455 average adjusted gross income )
Here:
8.95%Georgia average:
10.21%
0.21% of residents moved from foreign countries ($1,380 average AGI )Houston County:
0.21%Georgia average:
0.04%
Top counties from which taxpayers relocated into this county between 2020 and 2021:
7.81% of this county's 2020 resident taxpayers moved to other counties in 2021 ($53,425 average adjusted gross income )
Here:
7.81%Georgia average:
9.60%
0.15% of residents moved to foreign countries ($1,258 average AGI )Houston County:
0.15%Georgia average:
0.03%
Top counties to which taxpayers relocated from this county between 2020 and 2021:
Businesses in Warner Robins, GA
Name Count Name Count
AT&T 2 Little Caesars Pizza 2 Academy Sports + Outdoors 1 Long John Silver's 1 Ace Hardware 1 Lowe's 1 Advance Auto Parts 4 Marriott 1 Applebee's 1 McDonald's 4 Arby's 2 New Balance 2 AutoZone 3 Nike 5 Baskin-Robbins 1 Nissan 1 Bed Bath & Beyond 1 Office Depot 1 Best Western 1 Old Navy 1 Blockbuster 1 Olive Garden 1 Burger King 3 Outback 1 CVS 4 Outback Steakhouse 1 Chevrolet 1 Papa John's Pizza 1 Chick-Fil-A 1 Payless 1 Church's Chicken 1 Penske 1 Circle K 1 PetSmart 1 Cold Stone Creamery 1 Pier 1 Imports 1 Comfort Inn 2 Pizza Hut 3 Comfort Suites 1 Popeyes 1 Cracker Barrel 1 Publix Super Markets 1 Cricket Wireless 3 Quality 1 Curves 1 Quiznos 1 DHL 2 RadioShack 2 Dairy Queen 1 Ramada 1 Days Inn 1 Rite Aid 1 Discount Tire 1 Ruby Tuesday 1 Domino's Pizza 1 Rue21 1 Dunkin Donuts 2 Ryan's Grill 1 FedEx 15 SONIC Drive-In 3 Firestone Complete Auto Care 1 Sears 1 Ford 1 Shoe Carnival 1 GameStop 2 Sprint Nextel 1 Goodwill 1 Starbucks 2 H&R Block 4 Steak 'n Shake 1 Hardee's 2 Suburban 1 Hilton 1 Subway 5 Hobby Lobby 1 Super 8 1 Holiday Inn 1 T-Mobile 3 Home Depot 1 Taco Bell 3 Honda 1 Target 1 Hyundai 1 Toyota 1 IHOP 1 Toys"R"Us 1 InTown Suites 1 True Value 1 Jones New York 1 U-Haul 6 KFC 1 UPS 11 Kmart 1 Waffle House 3 Kohl's 1 Walgreens 4 Kroger 2 Walmart 2 La Quinta 1 Wingate 1 Lane Furniture 2
Strongest AM radio stations in Warner Robins:
WNNG (1350 AM; 15 kW; WARNER ROBINS, GA; Owner: CHASE BROADCASTING, INC.)
WMAC (940 AM; 50 kW; MACON, GA; Owner: CUMULUS LICENSING CORP.)
WPGA (980 AM; 5 kW; PERRY, GA; Owner: RADIO PERRY, INC.)
WXJO (1120 AM; daytime; 10 kW; GORDON, GA; Owner: ROBERTS COMMUNICATIONS, INC.)
WLCG (1280 AM; 5 kW; MACON, GA)
WGST (640 AM; 50 kW; ATLANTA, GA; Owner: CITICASTERS LICENSES, L.P.)
WBML (900 AM; 2 kW; MACON, GA; Owner: WBML, INC.)
WSB (750 AM; 50 kW; ATLANTA, GA; Owner: CXR HOLDINGS, INC.)
WCNN (680 AM; 50 kW; NORTH ATLANTA, GA; Owner: DICKEY BROADCASTING COMPANY)
WGUN (1010 AM; 50 kW; ATLANTA, GA; Owner: WGUN, INC.)
WKTF (1550 AM; 10 kW; VIENNA, GA; Owner: SANTILLANA BROADCASTING, INC.)
WMLB (1160 AM; 50 kW; EAST POINT, GA; Owner: ATLANTA AREA BROADCASTING, INC.)
WAOK (1380 AM; 50 kW; ATLANTA, GA; Owner: INFINITY BROADCASTING OPERATIONS, INC.)
Strongest FM radio stations in Warner Robins:
WRBV (101.7 FM; WARNER ROBINS, GA; Owner: CLEVELAND RADIO LICENSES, LLC)
W202BA (88.3 FM; WARNER ROBINS, GA; Owner: CALVARY CHAPEL OF TWIN FALLS, INC.)
WELV-FM (102.5 FM; WARNER ROBINS, GA; Owner: CLEVELAND RADIO LICENSES, LLC)
WIBB-FM (97.9 FM; FORT VALLEY, GA; Owner: CLEVELAND RADIO LICENSES, LLC)
WPGA-FM (100.9 FM; PERRY, GA; Owner: RADIO PERRY, INC.)
WMGB (95.1 FM; MONTEZUMA, GA; Owner: CUMULUS LICENSING CORP.)
WDEN-FM (99.1 FM; MACON, GA; Owner: CUMULUS LICENSING CORP.)
WAYS (105.5 FM; MACON, GA; Owner: CUMULUS LICENSING CORP.)
WBKG (88.9 FM; MACON, GA; Owner: AMERICAN FAMILY ASSOCIATION)
WPEZ (93.7 FM; JEFFERSONVILLE, GA; Owner: CUMULUS LICENSING CORP.)
WQBZ (106.3 FM; FORT VALLEY, GA; Owner: CLEVELAND RADIO LICENSES, LLC)
WDCO-FM (89.7 FM; COCHRAN, GA; Owner: GEORGIA PUBLIC TELECOMMUNICATIONS COMMISSION)
WJTG (91.3 FM; FORT VALLEY, GA; Owner: JOY PUBLIC B/CNG CORP)
WMKS (92.3 FM; MACON, GA; Owner: CUMULUS LICENSING CORP.)
WPWB (90.5 FM; BYRON, GA; Owner: AUGUSTA RADIO FELLOWSHIP INST., INC.)
WFXM (107.1 FM; GORDON, GA; Owner: ROBERTS COMMUNICATIONS, INC.)
WYNF (96.5 FM; GRAY, GA; Owner: CLEVELAND RADIO LICENSES, LLC)
WQMJ (100.1 FM; FORSYTH, GA; Owner: ROBERTS COMMUNICATIONS, INC.)
W282AE (104.3 FM; MACON, GA; Owner: BIBLE BROADCASTING NETWORK, INC.)
WMCG (104.9 FM; MILAN, GA; Owner: TEL-DODGE BROADCASTING CO.)
TV broadcast stations around Warner Robins:
WPGA-TV (Channel 58; PERRY, GA; Owner: RADIO PERRY, INC.)
WMGT-TV (Channel 41; MACON, GA; Owner: MORRIS NETWORK, INC.)
WGXA (Channel 24; MACON, GA; Owner: PIEDMONT TELEVISION OF MACON LICENSE LLC)
WMAZ-TV (Channel 13; MACON, GA; Owner: GANNETT GEORGIA, L.P.)
WGNM (Channel 64; MACON, GA; Owner: GOOD NEWS TELEVISION)
WDMA-LP (Channel 32; MACON, GA; Owner: WORD OF GOD FELLOWSHIP, INC.)
WDCO-TV (Channel 29; COCHRAN, GA; Owner: GEORGIA PUBLIC TELECOMMUNICATIONS COMMISSION)
National Bridge Inventory (NBI) Statistics 48 Number of bridges666ft / 203m Total length $68,844,000 Total costs611,350 Total average daily traffic40,702 Total average daily truck traffic
New bridges - historical statistics
1 1920-1929 7 1950-1959 10 1960-1969 7 1970-1979 7 1980-1989 4 1990-1999 5 2000-2009 2 2010-2019
See full National Bridge Inventory statistics for Warner Robins, GA
Home Mortgage Disclosure Act Aggregated Statistics For Year 2009(Based on 4 full and 16 partial tracts) A) FHA, FSA/RHS & VA B) Conventional C) Refinancings D) Home Improvement Loans E) Loans on Dwellings For 5+ Families F) Non-occupant Loans on G) Loans On Manufactured Number Average Value Number Average Value Number Average Value Number Average Value Number Average Value Number Average Value Number Average Value
LOANS ORIGINATED 280 $126,894 126 $100,190 508 $122,374 36 $39,803 3 $2,736,717 168 $84,138 5 $64,426 APPLICATIONS APPROVED, NOT ACCEPTED 13 $125,972 5 $115,440 29 $134,366 1 $175,890 0 $0 3 $85,220 1 $40,530 APPLICATIONS DENIED 34 $106,256 22 $90,970 199 $113,761 37 $25,029 1 $1,000,000 19 $72,096 6 $57,843 APPLICATIONS WITHDRAWN 31 $122,434 12 $140,727 135 $122,275 10 $83,404 0 $0 6 $85,202 1 $72,440 FILES CLOSED FOR INCOMPLETENESS 5 $109,458 4 $104,180 44 $108,297 1 $107,480 0 $0 2 $86,200 0 $0
Aggregated Statistics For Year 2008(Based on 4 full and 16 partial tracts) A) FHA, FSA/RHS & VA B) Conventional C) Refinancings D) Home Improvement Loans E) Loans on Dwellings For 5+ Families F) Non-occupant Loans on G) Loans On Manufactured Number Average Value Number Average Value Number Average Value Number Average Value Number Average Value Number Average Value Number Average Value
LOANS ORIGINATED 210 $119,132 293 $107,766 553 $92,778 65 $31,526 7 $1,410,001 346 $80,937 20 $59,674 APPLICATIONS APPROVED, NOT ACCEPTED 9 $101,382 19 $125,951 59 $104,168 9 $44,184 0 $0 11 $66,892 5 $41,810 APPLICATIONS DENIED 36 $118,916 61 $83,814 260 $102,808 85 $41,157 0 $0 46 $63,588 9 $58,008 APPLICATIONS WITHDRAWN 31 $105,385 18 $129,860 128 $116,187 12 $84,529 0 $0 12 $74,151 2 $68,410 FILES CLOSED FOR INCOMPLETENESS 6 $133,777 5 $144,572 19 $130,126 2 $63,725 0 $0 2 $106,810 0 $0
Aggregated Statistics For Year 2007(Based on 4 full and 16 partial tracts) A) FHA, FSA/RHS & VA B) Conventional C) Refinancings D) Home Improvement Loans E) Loans on Dwellings For 5+ Families F) Non-occupant Loans on G) Loans On Manufactured Number Average Value Number Average Value Number Average Value Number Average Value Number Average Value Number Average Value Number Average Value
LOANS ORIGINATED 204 $128,083 559 $96,086 565 $92,655 131 $30,598 9 $1,940,134 379 $70,477 12 $59,222 APPLICATIONS APPROVED, NOT ACCEPTED 6 $123,998 54 $104,891 94 $102,054 15 $44,367 0 $0 24 $64,455 5 $56,856 APPLICATIONS DENIED 30 $124,118 111 $93,209 429 $96,720 97 $40,705 0 $0 61 $62,972 12 $60,106 APPLICATIONS WITHDRAWN 19 $120,135 65 $132,668 199 $101,509 25 $69,119 1 $122,250 27 $61,917 1 $51,210 FILES CLOSED FOR INCOMPLETENESS 1 $140,160 19 $97,319 40 $106,673 5 $58,014 2 $1,246,500 4 $95,315 0 $0
Aggregated Statistics For Year 2006(Based on 4 full and 16 partial tracts) A) FHA, FSA/RHS & VA B) Conventional C) Refinancings D) Home Improvement Loans E) Loans on Dwellings For 5+ Families F) Non-occupant Loans on G) Loans On Manufactured Number Average Value Number Average Value Number Average Value Number Average Value Number Average Value Number Average Value Number Average Value
LOANS ORIGINATED 263 $125,984 742 $85,528 549 $83,711 73 $30,324 10 $2,293,424 337 $58,676 13 $108,549 APPLICATIONS APPROVED, NOT ACCEPTED 8 $106,918 86 $73,920 96 $81,468 19 $35,253 0 $0 34 $51,547 4 $40,165 APPLICATIONS DENIED 16 $109,748 143 $94,829 434 $89,005 96 $31,721 1 $1,203,050 55 $79,629 12 $62,662 APPLICATIONS WITHDRAWN 18 $117,585 99 $90,632 238 $88,817 13 $63,026 0 $0 23 $65,534 1 $78,100 FILES CLOSED FOR INCOMPLETENESS 5 $80,434 15 $92,558 57 $105,440 1 $19,270 1 $401,000 6 $44,147 0 $0
Aggregated Statistics For Year 2005(Based on 4 full and 16 partial tracts) A) FHA, FSA/RHS & VA B) Conventional C) Refinancings D) Home Improvement Loans E) Loans on Dwellings For 5+ Families F) Non-occupant Loans on G) Loans On Manufactured Number Average Value Number Average Value Number Average Value Number Average Value Number Average Value Number Average Value Number Average Value
LOANS ORIGINATED 261 $113,806 633 $81,701 593 $80,101 64 $39,828 8 $1,141,839 338 $57,265 14 $46,509 APPLICATIONS APPROVED, NOT ACCEPTED 9 $86,506 63 $90,317 108 $90,513 14 $33,941 0 $0 14 $53,382 5 $55,896 APPLICATIONS DENIED 29 $99,694 151 $76,916 509 $79,730 107 $41,056 1 $400,000 88 $49,793 28 $56,212 APPLICATIONS WITHDRAWN 14 $111,314 83 $84,598 270 $97,344 53 $98,675 0 $0 24 $85,530 3 $67,483 FILES CLOSED FOR INCOMPLETENESS 5 $96,760 33 $99,305 92 $101,458 6 $36,128 0 $0 19 $65,777 1 $74,050
Aggregated Statistics For Year 2004(Based on 4 full and 16 partial tracts) A) FHA, FSA/RHS & VA B) Conventional C) Refinancings D) Home Improvement Loans E) Loans on Dwellings For 5+ Families F) Non-occupant Loans on G) Loans On Manufactured Number Average Value Number Average Value Number Average Value Number Average Value Number Average Value Number Average Value Number Average Value
LOANS ORIGINATED 284 $110,592 579 $82,598 696 $76,639 51 $32,077 8 $682,815 324 $52,389 15 $63,464 APPLICATIONS APPROVED, NOT ACCEPTED 9 $101,349 67 $83,465 140 $85,920 14 $29,980 0 $0 24 $61,100 9 $48,852 APPLICATIONS DENIED 31 $93,325 117 $72,542 470 $77,993 79 $32,760 0 $0 49 $55,133 17 $67,662 APPLICATIONS WITHDRAWN 17 $112,040 68 $84,823 266 $85,006 23 $38,300 0 $0 27 $64,776 2 $75,985 FILES CLOSED FOR INCOMPLETENESS 3 $95,270 17 $107,284 75 $88,584 14 $44,920 0 $0 7 $43,951 1 $28,120
Aggregated Statistics For Year 2003(Based on 4 full and 16 partial tracts) A) FHA, FSA/RHS & VA B) Conventional C) Refinancings D) Home Improvement Loans E) Loans on Dwellings For 5+ Families F) Non-occupant Loans on Number Average Value Number Average Value Number Average Value Number Average Value Number Average Value Number Average Value
LOANS ORIGINATED 342 $104,368 471 $78,937 1,308 $85,406 28 $45,544 4 $1,911,355 304 $59,049 APPLICATIONS APPROVED, NOT ACCEPTED 7 $97,113 26 $89,377 108 $77,156 5 $25,268 0 $0 15 $55,201 APPLICATIONS DENIED 27 $95,646 88 $74,152 358 $72,785 43 $26,547 0 $0 36 $45,630 APPLICATIONS WITHDRAWN 19 $92,765 36 $90,087 256 $82,199 10 $40,913 0 $0 36 $63,247 FILES CLOSED FOR INCOMPLETENESS 4 $135,375 12 $99,602 59 $81,502 7 $36,043 0 $0 11 $50,896
Aggregated Statistics For Year 2002(Based on 4 full and 7 partial tracts) A) FHA, FSA/RHS & VA B) Conventional C) Refinancings D) Home Improvement Loans E) Loans on Dwellings For 5+ Families F) Non-occupant Loans on Number Average Value Number Average Value Number Average Value Number Average Value Number Average Value Number Average Value
LOANS ORIGINATED 163 $85,156 249 $1,221,251 516 $455,396 31 $5,266,362 8 $738,094 197 $1,462,524 APPLICATIONS APPROVED, NOT ACCEPTED 2 $92,465 30 $61,991 106 $60,480 7 $17,197 0 $0 11 $40,095 APPLICATIONS DENIED 17 $71,905 58 $70,983 230 $57,442 31 $16,457 0 $0 24 $54,735 APPLICATIONS WITHDRAWN 13 $72,212 29 $68,962 140 $68,361 3 $21,593 0 $0 16 $54,118 FILES CLOSED FOR INCOMPLETENESS 2 $47,855 8 $72,252 35 $71,873 2 $15,000 0 $0 2 $93,090
Aggregated Statistics For Year 2001(Based on 4 full and 7 partial tracts) A) FHA, FSA/RHS & VA B) Conventional C) Refinancings D) Home Improvement Loans E) Loans on Dwellings For 5+ Families F) Non-occupant Loans on Number Average Value Number Average Value Number Average Value Number Average Value Number Average Value Number Average Value
LOANS ORIGINATED 180 $78,590 193 $61,832 357 $64,369 44 $10,890 3 $660,153 129 $50,595 APPLICATIONS APPROVED, NOT ACCEPTED 2 $81,335 44 $58,868 69 $58,000 14 $16,589 1 $221,250 9 $73,948 APPLICATIONS DENIED 13 $69,971 99 $55,997 222 $55,083 54 $10,728 3 $251,383 22 $59,691 APPLICATIONS WITHDRAWN 15 $73,331 29 $62,013 133 $64,324 6 $29,147 0 $0 16 $58,888 FILES CLOSED FOR INCOMPLETENESS 3 $62,087 4 $48,762 19 $69,452 1 $40,700 0 $0 4 $55,035
Aggregated Statistics For Year 2000(Based on 4 full and 7 partial tracts) A) FHA, FSA/RHS & VA B) Conventional C) Refinancings D) Home Improvement Loans E) Loans on Dwellings For 5+ Families F) Non-occupant Loans on Number Average Value Number Average Value Number Average Value Number Average Value Number Average Value Number Average Value
LOANS ORIGINATED 222 $73,211 194 $112,408 213 $50,970 23 $16,667 3 $1,324,823 106 $44,762 APPLICATIONS APPROVED, NOT ACCEPTED 5 $42,932 35 $51,317 68 $56,092 14 $19,195 0 $0 8 $39,280 APPLICATIONS DENIED 36 $57,450 167 $49,463 213 $48,696 50 $23,479 0 $0 23 $36,987 APPLICATIONS WITHDRAWN 19 $68,809 35 $62,053 120 $47,739 8 $27,305 0 $0 10 $39,965 FILES CLOSED FOR INCOMPLETENESS 3 $65,260 4 $52,775 15 $89,791 2 $46,575 0 $0 1 $37,020
Aggregated Statistics For Year 1999(Based on 6 full and 14 partial tracts) A) FHA, FSA/RHS & VA B) Conventional C) Refinancings D) Home Improvement Loans E) Loans on Dwellings For 5+ Families F) Non-occupant Loans on Number Average Value Number Average Value Number Average Value Number Average Value Number Average Value Number Average Value
LOANS ORIGINATED 304 $76,846 323 $67,827 515 $58,336 43 $23,198 5 $1,047,528 121 $42,617 APPLICATIONS APPROVED, NOT ACCEPTED 3 $62,867 90 $53,036 118 $54,372 23 $21,552 1 $10,990 20 $52,079 APPLICATIONS DENIED 29 $72,122 426 $48,029 334 $54,834 51 $20,323 0 $0 26 $45,327 APPLICATIONS WITHDRAWN 28 $67,404 82 $66,178 222 $76,464 17 $35,267 0 $0 15 $49,101 FILES CLOSED FOR INCOMPLETENESS 3 $50,243 4 $74,530 54 $57,611 2 $18,495 0 $0 2 $67,765
Detailed mortgage data for all 15 tracts in Warner Robins, GA
Private Mortgage Insurance Companies Aggregated Statistics For Year 2009(Based on 2 full and 15 partial tracts) A) Conventional B) Refinancings C) Non-occupant Loans on Number Average Value Number Average Value Number Average Value
LOANS ORIGINATED 20 $126,192 15 $131,927 1 $81,630 APPLICATIONS APPROVED, NOT ACCEPTED 6 $138,872 2 $197,660 1 $37,420 APPLICATIONS DENIED 6 $119,128 3 $201,087 0 $0 APPLICATIONS WITHDRAWN 2 $84,205 1 $100,710 0 $0 FILES CLOSED FOR INCOMPLETENESS 0 $0 0 $0 0 $0
Aggregated Statistics For Year 2008(Based on 4 full and 15 partial tracts) A) Conventional B) Refinancings C) Non-occupant Loans on Number Average Value Number Average Value Number Average Value
LOANS ORIGINATED 101 $104,707 44 $115,064 24 $62,551 APPLICATIONS APPROVED, NOT ACCEPTED 29 $119,173 16 $129,125 9 $70,178 APPLICATIONS DENIED 7 $75,170 1 $162,120 5 $61,566 APPLICATIONS WITHDRAWN 5 $102,610 1 $160,810 1 $36,610 FILES CLOSED FOR INCOMPLETENESS 3 $79,513 0 $0 2 $110,270
Aggregated Statistics For Year 2007(Based on 4 full and 15 partial tracts) A) Conventional B) Refinancings C) Non-occupant Loans on Number Average Value Number Average Value Number Average Value
LOANS ORIGINATED 207 $105,155 76 $105,332 43 $65,624 APPLICATIONS APPROVED, NOT ACCEPTED 27 $103,363 12 $104,195 8 $63,970 APPLICATIONS DENIED 3 $93,617 0 $0 0 $0 APPLICATIONS WITHDRAWN 16 $103,908 7 $93,839 3 $69,477 FILES CLOSED FOR INCOMPLETENESS 0 $0 2 $63,535 2 $63,535
Aggregated Statistics For Year 2006(Based on 4 full and 16 partial tracts) A) Conventional B) Refinancings C) Non-occupant Loans on D) Loans On Manufactured Number Average Value Number Average Value Number Average Value Number Average Value
LOANS ORIGINATED 168 $90,630 57 $105,386 36 $65,197 1 $55,890 APPLICATIONS APPROVED, NOT ACCEPTED 14 $89,160 8 $107,912 3 $68,603 0 $0 APPLICATIONS DENIED 3 $64,087 0 $0 1 $93,970 0 $0 APPLICATIONS WITHDRAWN 4 $116,585 3 $99,407 1 $43,050 0 $0 FILES CLOSED FOR INCOMPLETENESS 1 $84,600 0 $0 0 $0 0 $0
Aggregated Statistics For Year 2005(Based on 4 full and 15 partial tracts) A) Conventional B) Refinancings C) Non-occupant Loans on D) Loans On Manufactured Number Average Value Number Average Value Number Average Value Number Average Value
LOANS ORIGINATED 125 $97,866 66 $99,764 37 $64,914 0 $0 APPLICATIONS APPROVED, NOT ACCEPTED 13 $94,442 12 $101,352 3 $53,883 1 $36,570 APPLICATIONS DENIED 0 $0 1 $36,990 1 $30,990 0 $0 APPLICATIONS WITHDRAWN 8 $93,361 3 $111,753 4 $84,255 0 $0 FILES CLOSED FOR INCOMPLETENESS 0 $0 1 $147,040 0 $0 0 $0
Aggregated Statistics For Year 2004(Based on 4 full and 16 partial tracts) A) Conventional B) Refinancings C) Non-occupant Loans on D) Loans On Manufactured Number Average Value Number Average Value Number Average Value Number Average Value
LOANS ORIGINATED 108 $91,994 78 $87,161 45 $59,820 2 $53,780 APPLICATIONS APPROVED, NOT ACCEPTED 15 $94,959 20 $115,916 6 $64,722 0 $0 APPLICATIONS DENIED 2 $54,275 4 $50,250 5 $48,416 0 $0 APPLICATIONS WITHDRAWN 5 $95,562 4 $147,282 2 $65,940 0 $0 FILES CLOSED FOR INCOMPLETENESS 1 $32,530 1 $58,890 0 $0 0 $0
Aggregated Statistics For Year 2003(Based on 4 full and 16 partial tracts) A) Conventional B) Refinancings C) Non-occupant Loans on Number Average Value Number Average Value Number Average Value
LOANS ORIGINATED 132 $94,260 187 $93,230 49 $60,404 APPLICATIONS APPROVED, NOT ACCEPTED 17 $84,201 16 $104,181 7 $50,914 APPLICATIONS DENIED 1 $37,470 1 $50,360 0 $0 APPLICATIONS WITHDRAWN 4 $65,615 6 $93,653 1 $108,760 FILES CLOSED FOR INCOMPLETENESS 0 $0 0 $0 0 $0
Aggregated Statistics For Year 2002(Based on 4 full and 6 partial tracts) A) Conventional B) Refinancings C) Non-occupant Loans on Number Average Value Number Average Value Number Average Value
LOANS ORIGINATED 71 $74,353 77 $81,402 28 $48,693 APPLICATIONS APPROVED, NOT ACCEPTED 7 $64,920 10 $104,234 2 $30,425 APPLICATIONS DENIED 1 $85,000 3 $57,257 2 $54,000 APPLICATIONS WITHDRAWN 1 $82,290 5 $87,362 1 $49,150 FILES CLOSED FOR INCOMPLETENESS 0 $0 0 $0 0 $0
Aggregated Statistics For Year 2001(Based on 4 full and 6 partial tracts) A) Conventional B) Refinancings C) Non-occupant Loans on Number Average Value Number Average Value Number Average Value
LOANS ORIGINATED 52 $95,541 35 $80,573 15 $47,109 APPLICATIONS APPROVED, NOT ACCEPTED 7 $58,674 9 $101,520 1 $37,450 APPLICATIONS DENIED 0 $0 3 $69,327 0 $0 APPLICATIONS WITHDRAWN 0 $0 1 $47,920 0 $0 FILES CLOSED FOR INCOMPLETENESS 0 $0 3 $47,503 1 $30,990
Aggregated Statistics For Year 2000(Based on 4 full and 6 partial tracts) A) Conventional B) Refinancings C) Non-occupant Loans on Number Average Value Number Average Value Number Average Value
LOANS ORIGINATED 50 $70,768 20 $75,096 16 $52,232 APPLICATIONS APPROVED, NOT ACCEPTED 4 $64,532 3 $48,213 2 $44,635 APPLICATIONS DENIED 2 $88,990 0 $0 1 $74,880 APPLICATIONS WITHDRAWN 1 $70,220 0 $0 0 $0 FILES CLOSED FOR INCOMPLETENESS 0 $0 0 $0 0 $0
Aggregated Statistics For Year 1999(Based on 5 full and 12 partial tracts) A) Conventional B) Refinancings C) Non-occupant Loans on Number Average Value Number Average Value Number Average Value
LOANS ORIGINATED 80 $86,858 39 $80,426 10 $42,441 APPLICATIONS APPROVED, NOT ACCEPTED 6 $65,348 2 $123,300 1 $21,340 APPLICATIONS DENIED 3 $49,610 0 $0 2 $43,855 APPLICATIONS WITHDRAWN 1 $177,520 1 $92,280 0 $0 FILES CLOSED FOR INCOMPLETENESS 0 $0 0 $0 0 $0
Fire-safe hotels and motels in Warner Robins, Georgia:
Comfort Inn, 2725 Watson Blvd, Warner Robins, Georgia 31093 Phone: (478) 953-3000, Fax: (478) 953-8463
Comfort Inn & Suites At Robins Afb, 95 Georgia Hwy 247 S, Warner Robins, Georgia 31088 Phone: (478) 922-7555, Fax: (478) 929-3404
Days Inn & Suites Warner Robins GA, 2739 Watson Blvd, Warner Robins, Georgia 31093 Phone: (478) 953-3800, Fax: (478) 953-4054
Ramada Inn & Conference Center, 2024 Watson Blvd, Warner Robins, Georgia 31093 Phone: (478) 923-8871, Fax: (478) 923-1930
Baymont Inn And Suites, 2731 Watson Blvd, Warner Robins, Georgia 31093 Phone: (478) 953-5522, Fax: (478) 953-3445
Super 8 Motel, 105 Woodcrest Blvd, Warner Robins, Georgia 31093 Phone: (478) 923-8600, Fax: (478) 923-8659
Quality Inn & Suites, 215 Margie Dr, Warner Robins, Georgia 31088 Phone: (478) 953-6866, Fax: (478) 953-6868
Comfort Suites, 3101 Watson Blvd, Warner Robins, Georgia 31093 Phone: (478) 953-5240, Fax: (478) 953-5280
16 other hotels and motels
All 24 fire-safe hotels and motels in Warner Robins, Georgia
Most common first names in Warner Robins, GA among deceased individuals Name Count Lived (average)
James 316 68.5 years Mary 306 75.9 years John 254 72.1 years William 243 72.9 years Robert 183 69.3 years Charles 153 70.7 years Thomas 123 70.5 years George 114 73.3 years Willie 106 68.8 years Annie 100 80.0 years
Most common last names in Warner Robins, GA among deceased individuals Last name Count Lived (average)
Smith 153 70.1 years Jones 126 72.7 years Williams 116 70.5 years Brown 109 69.6 years Davis 93 71.7 years Johnson 87 72.9 years Jackson 79 68.4 years Thompson 58 70.2 years Walker 56 72.0 years Martin 54 69.4 years
Warner Robins compared to Georgia state average:
Median house value below state average. Unemployed percentage below state average. Black race population percentage above state average. Median age significantly below state average. Length of stay since moving in below state average. Warner Robins on our top lists :
#1 on the list of "Top 101 cities with largest percentage of males in occupations: installation, maintenance, and repair occupations (population 50,000+)"
#1 on the list of "Top 101 cities with largest percentage of males in occupations: law enforcement workers including supervisors (population 50,000+)"
#1 on the list of "Top 101 cities with largest percentage of males in industries: public administration (population 50,000+)"
#3 on the list of "Top 101 cities with largest percentage of females in occupations: law enforcement workers including supervisors (population 50,000+)"
#3 on the list of "Top 101 cities with largest percentage of females in occupations: personal care and service occupations (population 50,000+)"
#5 on the list of "Top 101 cities with largest percentage of females in industries: other services, except public administration (population 50,000+)"
#13 on the list of "Top 101 cities with largest percentage of females in industries: public administration (population 50,000+)"
#16 on the list of "Top 101 cities with the least people having professional degrees (population 50,000+)"
#17 on the list of "Top 101 cities with largest percentage of females in occupations: extraction workers (population 50,000+)"
#17 on the list of "Top 101 cities with largest percentage of females in occupations: fishing and hunting, and forest and logging workers (population 50,000+)"
#18 on the list of "Top 101 cities with largest percentage of females in industries: broadcasting, internet publishing, and telecommunications services (population 50,000+)"
#18 on the list of "Top 101 cities with largest percentage of males in industries: broadcasting, internet publishing, and telecommunications services (population 50,000+)"
#18 on the list of "Top 101 cities with largest percentage of males in industries: wholesale electronic markets and agents and brokers (population 50,000+)"
#18 on the list of "Top 101 cities with largest percentage of females in industries: wholesale electronic markets and agents and brokers (population 50,000+)"
#22 on the list of "Top 101 cities with the highest number of thefts per 100,000 residents, excludes tourist destinations and others with a lot of outsiders visiting based on city industries data (population 50,000+)"
#30 on the list of "Top 101 cities with the highest maximum monthly morning or afternoon humidity (population 50,000+)"
#41 on the list of "Top 101 cities with the lowest percentage of workers working at home, population 50,000+"
#45 on the list of "Top 101 cities with largest percentage of males in industries: utilities (population 50,000+)"
#55 on the list of "Top 101 cities with the least people having Doctorate degrees (population 50,000+)"
#65 on the list of "Top 101 cities with largest percentage of males in occupations: material moving occupations (population 50,000+)"
#54 on the list of "Top 101 counties with the largest number of people moving in compared to moving out (pop. 50,000+)"
#61 on the list of "Top 101 counties with the highest percentage of residents relocating from foreign countries between 2010 and 2011"
#76 on the list of "Top 101 counties with the highest percentage of residents relocating to foreign countries in 2011"
#89 on the list of "Top 101 counties with the largest increase in the number of births per 1000 residents 2000-2006 to 2007-2013 (pop 50,000+)"
Top Patent Applicants
Ran Meriaz (14)
Maura J. Stafford (5)
Robert Brown, Jr. (3)
Sean G. Eubanks (3)
Daxes Banit (2)
David Henry Goss (2)
Milton Davis, Jr. (2)
Vladimir Moldovanu (2)
Sharon Hunt (1)
Howard Wallace-Jones Tennyson (1)
Total of 59 patent applications in 2008-2024.
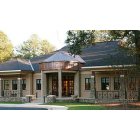
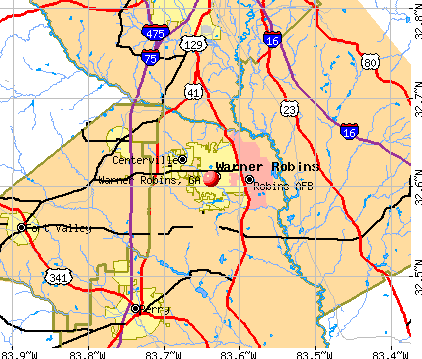


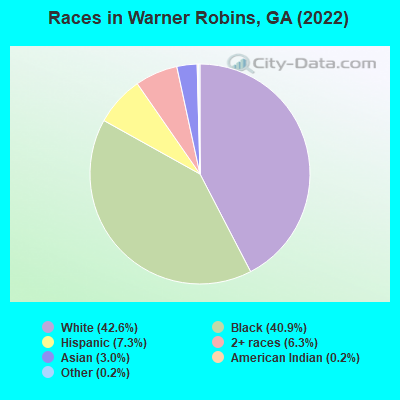

 Recent articles from our blog. Our writers, many of them Ph.D. graduates or candidates, create easy-to-read articles on a wide variety of topics.

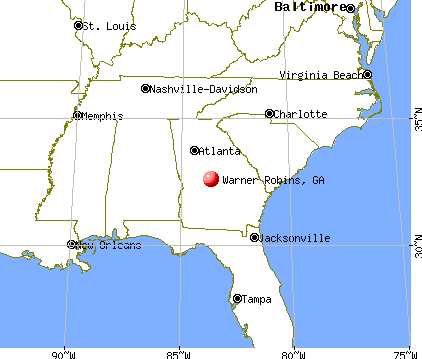
 (16.0 miles
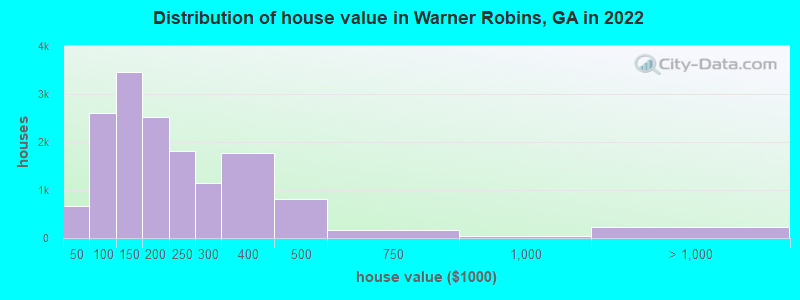

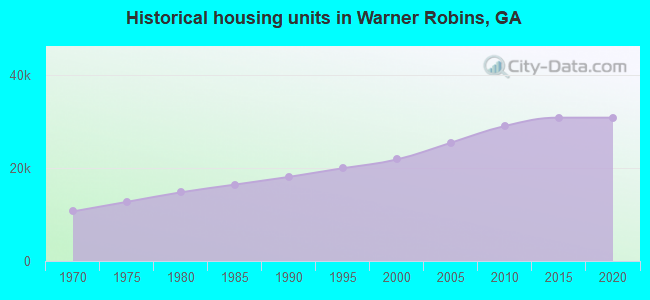
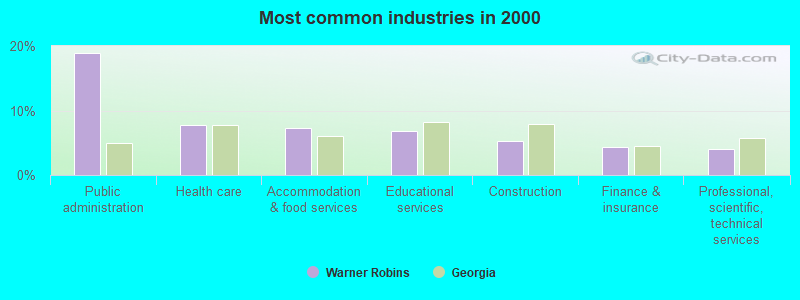
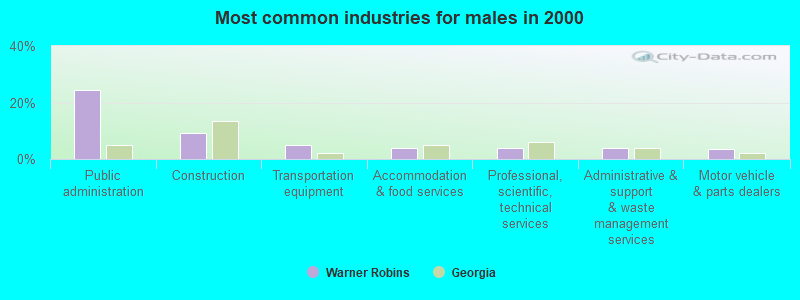
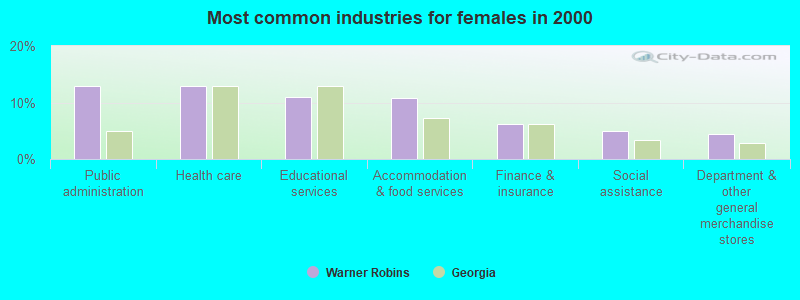


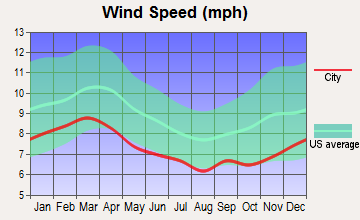
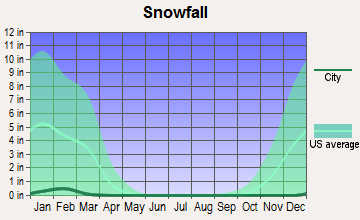
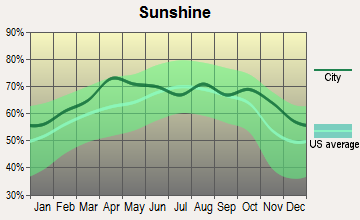
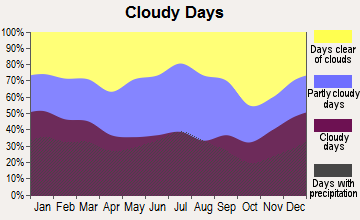
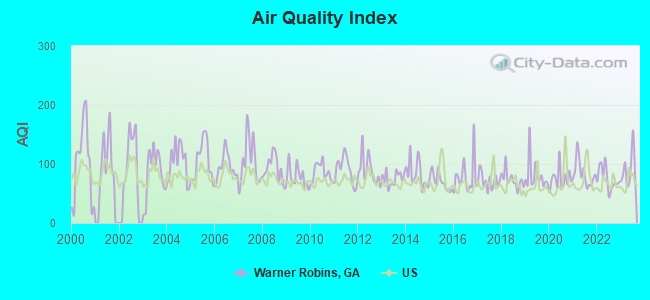
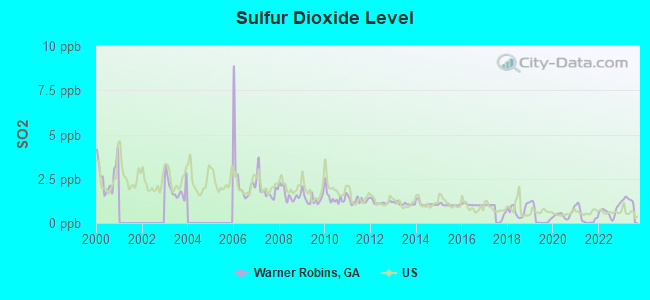
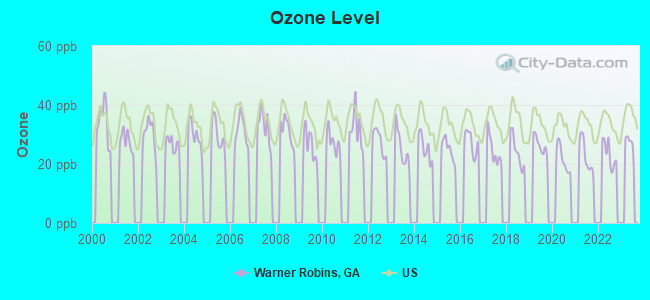
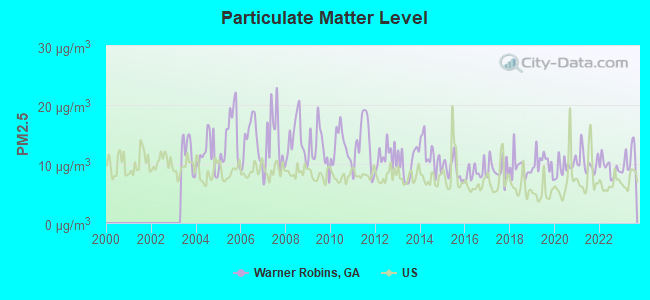
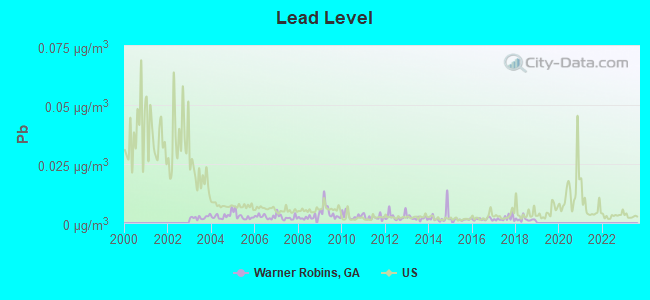

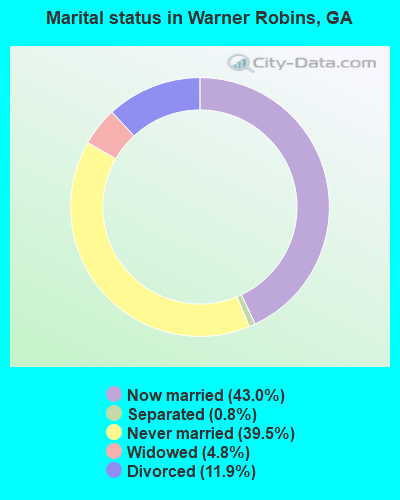
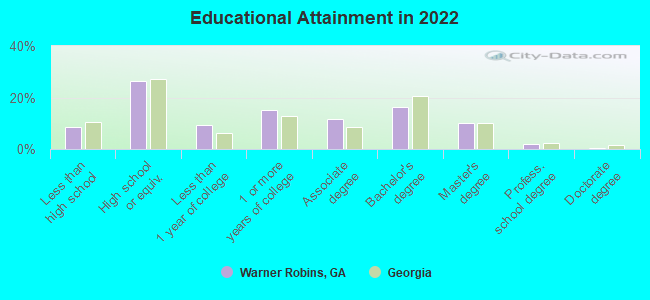
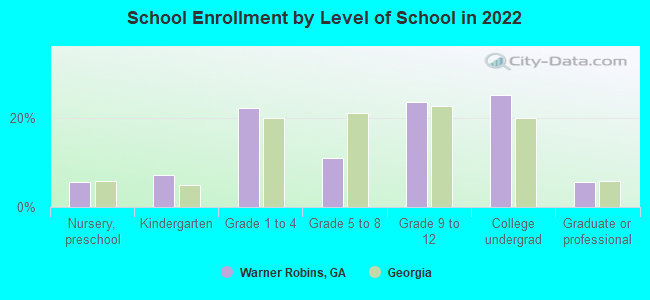
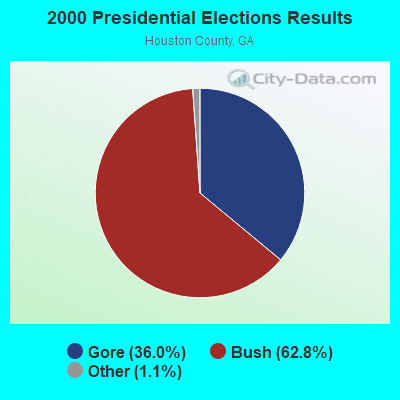

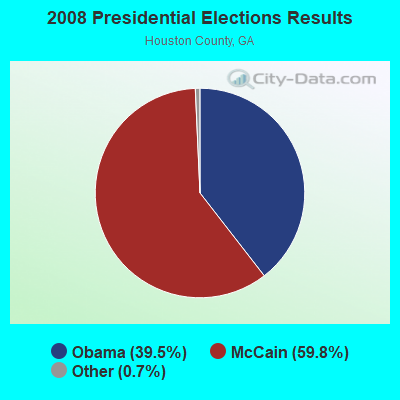
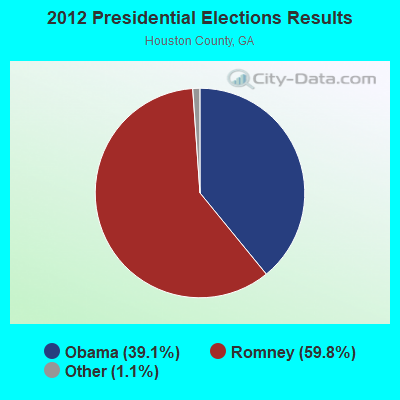
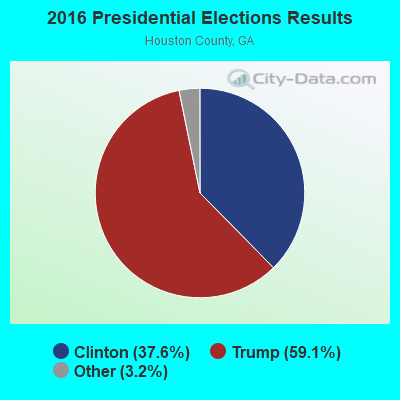
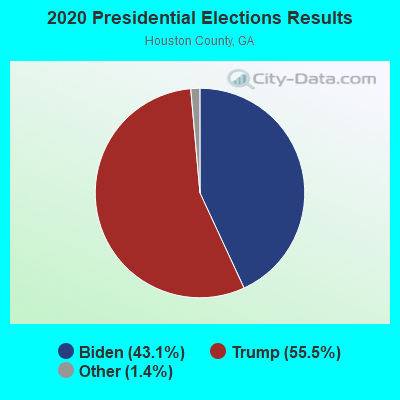
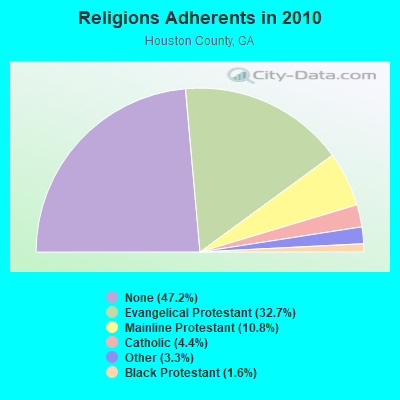
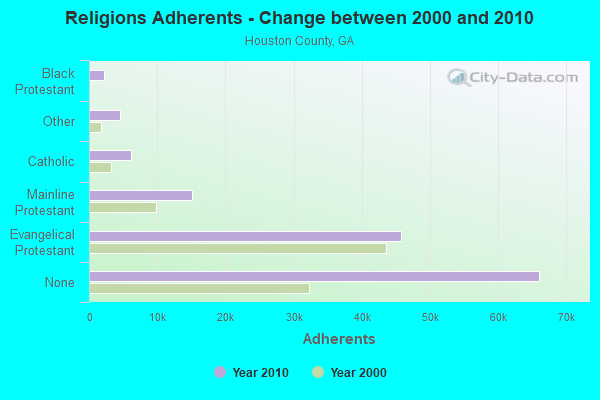
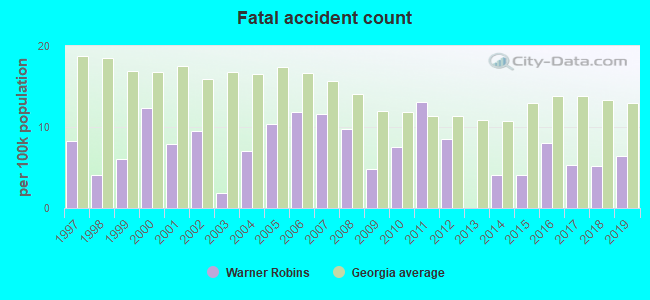
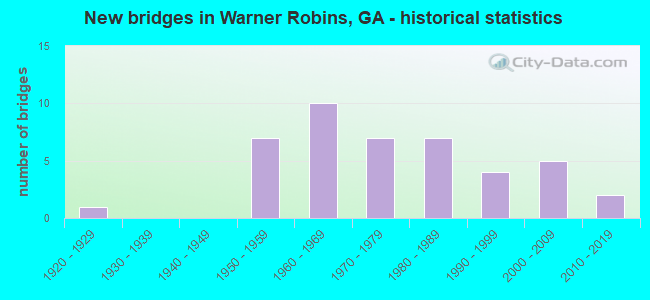
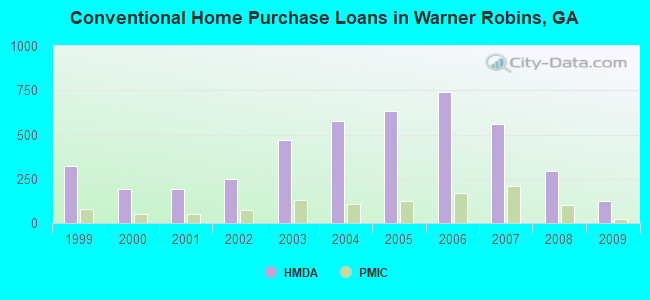
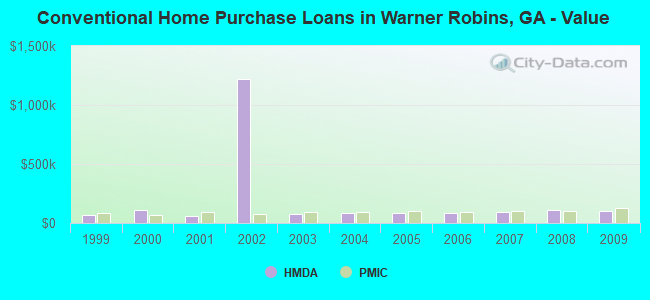
 According to the data from the years 2002 - 2018 the average number of fires per year is 326. The highest number of fires - 516 took place in 2010, and the least - 194 in 2002. The data has a rising trend.
 When looking into fire subcategories, the most reports belonged to: Outside Fires (41.6%), and Structure Fires (40.2%).