Valley Center, Kansas Submit your own pictures of this city and show them to the world
OSM Map
General Map
Google Map
MSN Map
OSM Map
General Map
Google Map
MSN Map
OSM Map
General Map
Google Map
MSN Map
OSM Map
General Map
Google Map
MSN Map
Please wait while loading the map...
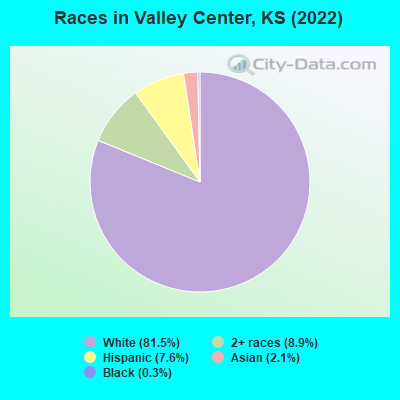
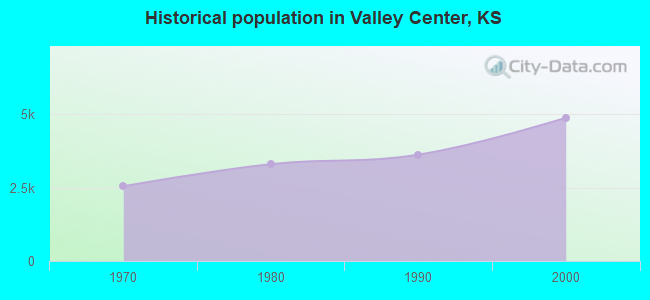
Population in 2022: 7,348 (90% urban, 10% rural). Population change since 2000: +50.5%Males: 3,613 Females: 3,735
March 2022 cost of living index in Valley Center: 82.1 (low, U.S. average is 100) Percentage of residents living in poverty in 2022: 2.3%for White Non-Hispanic residents , 11.5% for Black residents , 8.2% for Hispanic or Latino residents , 0.2% for two or more races residents )
Profiles of local businesses
Business Search - 14 Million verified businesses
Data:
Median household income ($)
Median household income (% change since 2000)
Household income diversity
Ratio of average income to average house value (%)
Ratio of average income to average rent
Median household income ($) - White
Median household income ($) - Black or African American
Median household income ($) - Asian
Median household income ($) - Hispanic or Latino
Median household income ($) - American Indian and Alaska Native
Median household income ($) - Multirace
Median household income ($) - Other Race
Median household income for houses/condos with a mortgage ($)
Median household income for apartments without a mortgage ($)
Races - White alone (%)
Races - White alone (% change since 2000)
Races - Black alone (%)
Races - Black alone (% change since 2000)
Races - American Indian alone (%)
Races - American Indian alone (% change since 2000)
Races - Asian alone (%)
Races - Asian alone (% change since 2000)
Races - Hispanic (%)
Races - Hispanic (% change since 2000)
Races - Native Hawaiian and Other Pacific Islander alone (%)
Races - Native Hawaiian and Other Pacific Islander alone (% change since 2000)
Races - Two or more races (%)
Races - Two or more races (% change since 2000)
Races - Other race alone (%)
Races - Other race alone (% change since 2000)
Racial diversity
Unemployment (%)
Unemployment (% change since 2000)
Unemployment (%) - White
Unemployment (%) - Black or African American
Unemployment (%) - Asian
Unemployment (%) - Hispanic or Latino
Unemployment (%) - American Indian and Alaska Native
Unemployment (%) - Multirace
Unemployment (%) - Other Race
Population density (people per square mile)
Population - Males (%)
Population - Females (%)
Population - Males (%) - White
Population - Males (%) - Black or African American
Population - Males (%) - Asian
Population - Males (%) - Hispanic or Latino
Population - Males (%) - American Indian and Alaska Native
Population - Males (%) - Multirace
Population - Males (%) - Other Race
Population - Females (%) - White
Population - Females (%) - Black or African American
Population - Females (%) - Asian
Population - Females (%) - Hispanic or Latino
Population - Females (%) - American Indian and Alaska Native
Population - Females (%) - Multirace
Population - Females (%) - Other Race
Coronavirus confirmed cases (Jul 03, 2024)
Deaths caused by coronavirus (Jul 03, 2024)
Coronavirus confirmed cases (per 100k population) (Jul 03, 2024)
Deaths caused by coronavirus (per 100k population) (Jul 03, 2024)
Daily increase in number of cases (Jul 03, 2024)
Weekly increase in number of cases (Jul 03, 2024)
Cases doubled (in days) (Jul 03, 2024)
Hospitalized patients (Apr 18, 2022)
Negative test results (Apr 18, 2022)
Total test results (Apr 18, 2022)
COVID Vaccine doses distributed (per 100k population) (Sep 19, 2023)
COVID Vaccine doses administered (per 100k population) (Sep 19, 2023)
COVID Vaccine doses distributed (Sep 19, 2023)
COVID Vaccine doses administered (Sep 19, 2023)
Likely homosexual households (%)
Likely homosexual households (% change since 2000)
Likely homosexual households - Lesbian couples (%)
Likely homosexual households - Lesbian couples (% change since 2000)
Likely homosexual households - Gay men (%)
Likely homosexual households - Gay men (% change since 2000)
Cost of living index
Median gross rent ($)
Median contract rent ($)
Median monthly housing costs ($)
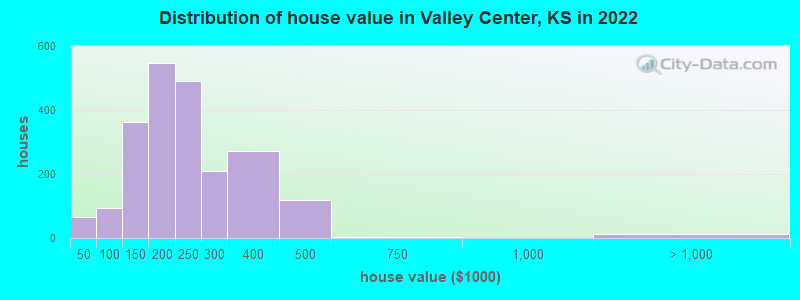
Median house or condo value ($)
Median house or condo value ($ change since 2000)
Mean house or condo value by units in structure - 1, detached ($)
Mean house or condo value by units in structure - 1, attached ($)
Mean house or condo value by units in structure - 2 ($)
Mean house or condo value by units in structure by units in structure - 3 or 4 ($)
Mean house or condo value by units in structure - 5 or more ($)
Mean house or condo value by units in structure - Boat, RV, van, etc. ($)
Mean house or condo value by units in structure - Mobile home ($)
Median house or condo value ($) - White
Median house or condo value ($) - Black or African American
Median house or condo value ($) - Asian
Median house or condo value ($) - Hispanic or Latino
Median house or condo value ($) - American Indian and Alaska Native
Median house or condo value ($) - Multirace
Median house or condo value ($) - Other Race
Median resident age
Resident age diversity
Median resident age - Males
Median resident age - Females
Median resident age - White
Median resident age - Black or African American
Median resident age - Asian
Median resident age - Hispanic or Latino
Median resident age - American Indian and Alaska Native
Median resident age - Multirace
Median resident age - Other Race
Median resident age - Males - White
Median resident age - Males - Black or African American
Median resident age - Males - Asian
Median resident age - Males - Hispanic or Latino
Median resident age - Males - American Indian and Alaska Native
Median resident age - Males - Multirace
Median resident age - Males - Other Race
Median resident age - Females - White
Median resident age - Females - Black or African American
Median resident age - Females - Asian
Median resident age - Females - Hispanic or Latino
Median resident age - Females - American Indian and Alaska Native
Median resident age - Females - Multirace
Median resident age - Females - Other Race
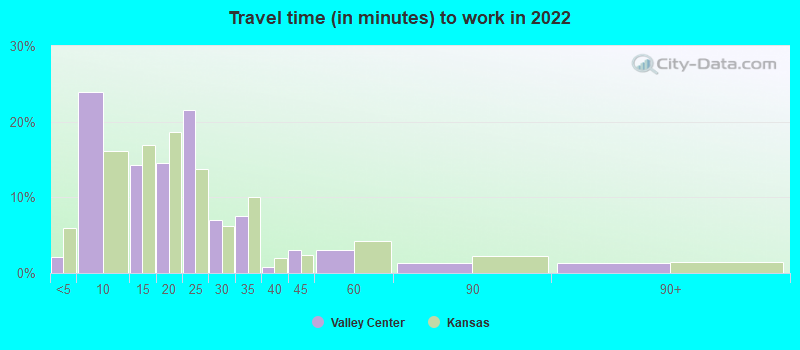
Commute - mean travel time to work (minutes)
Travel time to work - Less than 5 minutes (%)
Travel time to work - Less than 5 minutes (% change since 2000)
Travel time to work - 5 to 9 minutes (%)
Travel time to work - 5 to 9 minutes (% change since 2000)
Travel time to work - 10 to 19 minutes (%)
Travel time to work - 10 to 19 minutes (% change since 2000)
Travel time to work - 20 to 29 minutes (%)
Travel time to work - 20 to 29 minutes (% change since 2000)
Travel time to work - 30 to 39 minutes (%)
Travel time to work - 30 to 39 minutes (% change since 2000)
Travel time to work - 40 to 59 minutes (%)
Travel time to work - 40 to 59 minutes (% change since 2000)
Travel time to work - 60 to 89 minutes (%)
Travel time to work - 60 to 89 minutes (% change since 2000)
Travel time to work - 90 or more minutes (%)
Travel time to work - 90 or more minutes (% change since 2000)
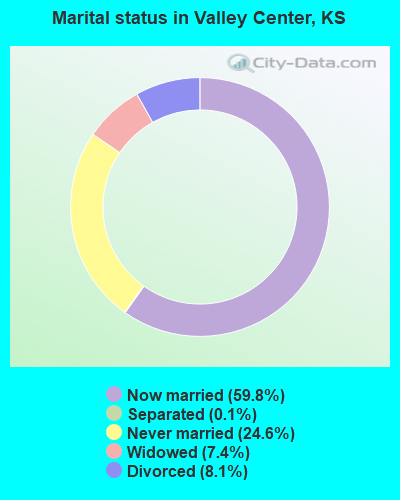
Marital status - Never married (%)
Marital status - Now married (%)
Marital status - Separated (%)
Marital status - Widowed (%)
Marital status - Divorced (%)
Median family income ($)
Median family income (% change since 2000)
Median non-family income ($)
Median non-family income (% change since 2000)
Median per capita income ($)
Median per capita income (% change since 2000)
Median family income ($) - White
Median family income ($) - Black or African American
Median family income ($) - Asian
Median family income ($) - Hispanic or Latino
Median family income ($) - American Indian and Alaska Native
Median family income ($) - Multirace
Median family income ($) - Other Race
Median year house/condo built
Median year apartment built
Year house built - Built 2005 or later (%)
Year house built - Built 2000 to 2004 (%)
Year house built - Built 1990 to 1999 (%)
Year house built - Built 1980 to 1989 (%)
Year house built - Built 1970 to 1979 (%)
Year house built - Built 1960 to 1969 (%)
Year house built - Built 1950 to 1959 (%)
Year house built - Built 1940 to 1949 (%)
Year house built - Built 1939 or earlier (%)
Average household size
Household density (households per square mile)
Average household size - White
Average household size - Black or African American
Average household size - Asian
Average household size - Hispanic or Latino
Average household size - American Indian and Alaska Native
Average household size - Multirace
Average household size - Other Race
Occupied housing units (%)
Vacant housing units (%)
Owner occupied housing units (%)
Renter occupied housing units (%)
Vacancy status - For rent (%)
Vacancy status - For sale only (%)
Vacancy status - Rented or sold, not occupied (%)
Vacancy status - For seasonal, recreational, or occasional use (%)
Vacancy status - For migrant workers (%)
Vacancy status - Other vacant (%)
Residents with income below the poverty level (%)
Residents with income below 50% of the poverty level (%)
Children below poverty level (%)
Poor families by family type - Married-couple family (%)
Poor families by family type - Male, no wife present (%)
Poor families by family type - Female, no husband present (%)
Poverty status for native-born residents (%)
Poverty status for foreign-born residents (%)
Poverty among high school graduates not in families (%)
Poverty among people who did not graduate high school not in families (%)
Residents with income below the poverty level (%) - White
Residents with income below the poverty level (%) - Black or African American
Residents with income below the poverty level (%) - Asian
Residents with income below the poverty level (%) - Hispanic or Latino
Residents with income below the poverty level (%) - American Indian and Alaska Native
Residents with income below the poverty level (%) - Multirace
Residents with income below the poverty level (%) - Other Race
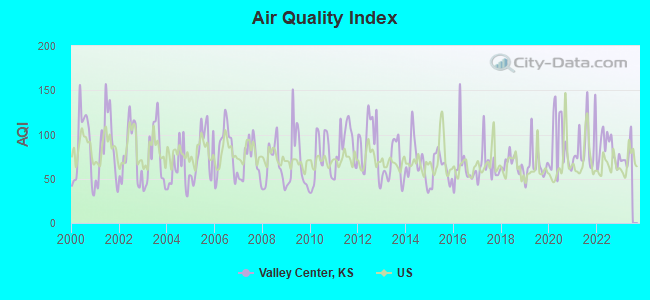
Air pollution - Air Quality Index (AQI)
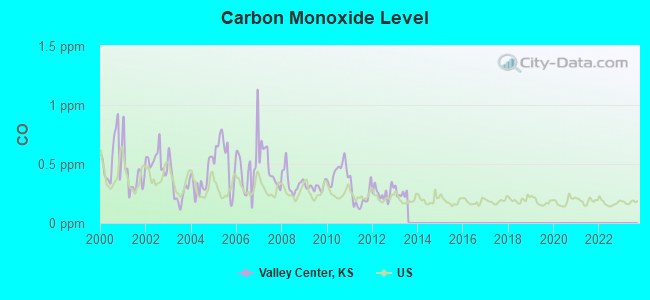
Air pollution - CO
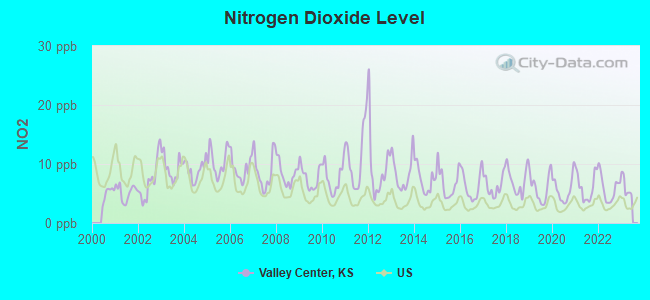
Air pollution - NO2
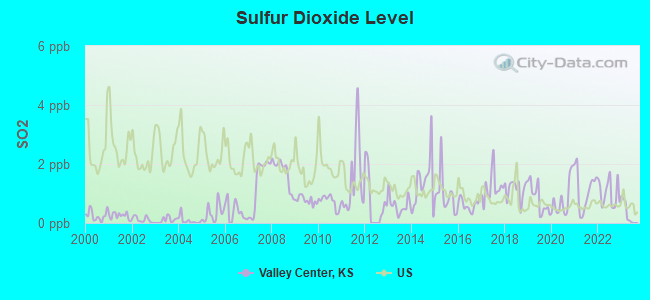
Air pollution - SO2
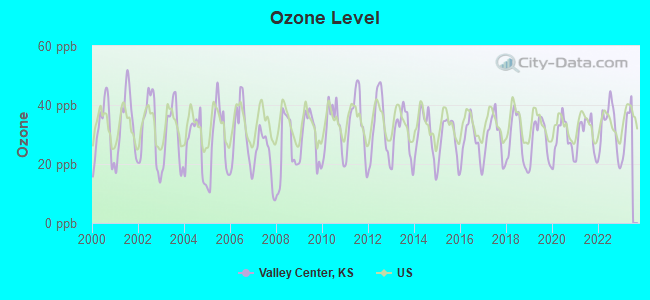
Air pollution - Ozone
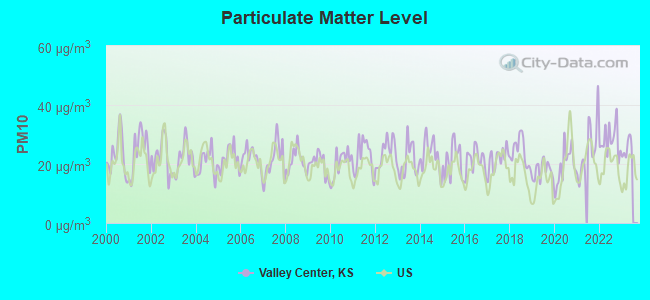
Air pollution - PM10
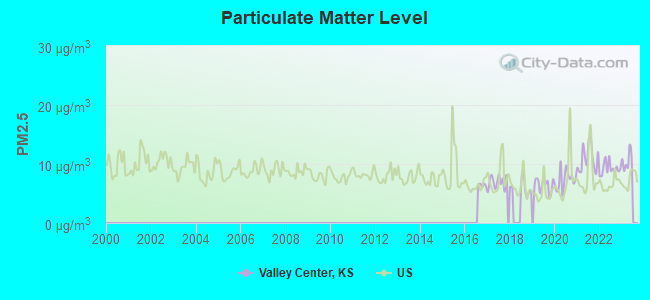
Air pollution - PM25
Air pollution - Pb
Crime - Murders per 100,000 population
Crime - Rapes per 100,000 population
Crime - Robberies per 100,000 population
Crime - Assaults per 100,000 population
Crime - Burglaries per 100,000 population
Crime - Thefts per 100,000 population
Crime - Auto thefts per 100,000 population
Crime - Arson per 100,000 population
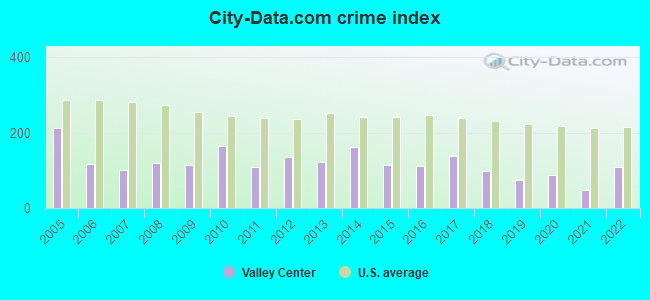
Crime - City-data.com crime index
Crime - Violent crime index
Crime - Property crime index
Crime - Murders per 100,000 population (5 year average)
Crime - Rapes per 100,000 population (5 year average)
Crime - Robberies per 100,000 population (5 year average)
Crime - Assaults per 100,000 population (5 year average)
Crime - Burglaries per 100,000 population (5 year average)
Crime - Thefts per 100,000 population (5 year average)
Crime - Auto thefts per 100,000 population (5 year average)
Crime - Arson per 100,000 population (5 year average)
Crime - City-data.com crime index (5 year average)
Crime - Violent crime index (5 year average)
Crime - Property crime index (5 year average)
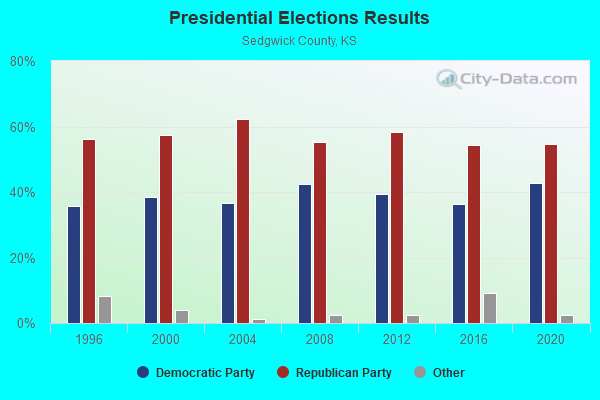
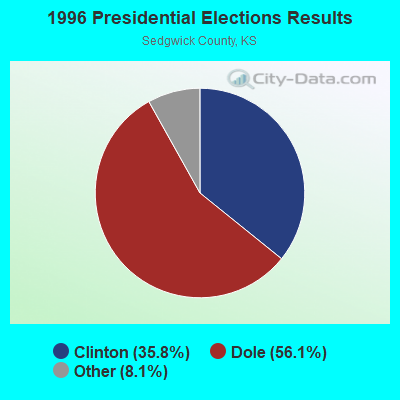
1996 Presidential Elections Results (%) - Democratic Party (Clinton)
1996 Presidential Elections Results (%) - Republican Party (Dole)
1996 Presidential Elections Results (%) - Other
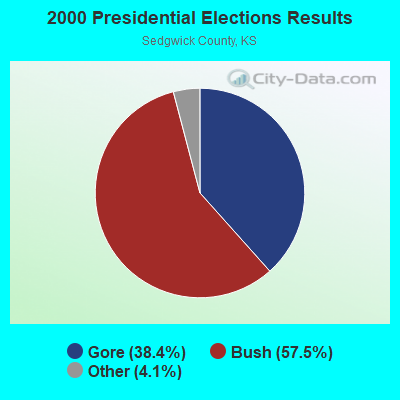
2000 Presidential Elections Results (%) - Democratic Party (Gore)
2000 Presidential Elections Results (%) - Republican Party (Bush)
2000 Presidential Elections Results (%) - Other
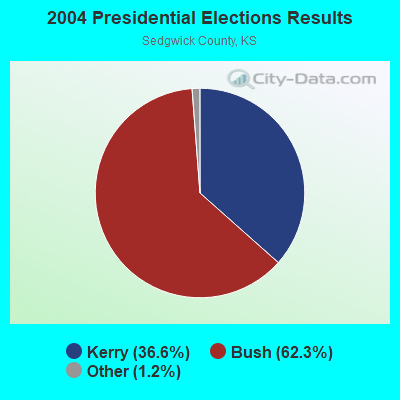
2004 Presidential Elections Results (%) - Democratic Party (Kerry)
2004 Presidential Elections Results (%) - Republican Party (Bush)
2004 Presidential Elections Results (%) - Other
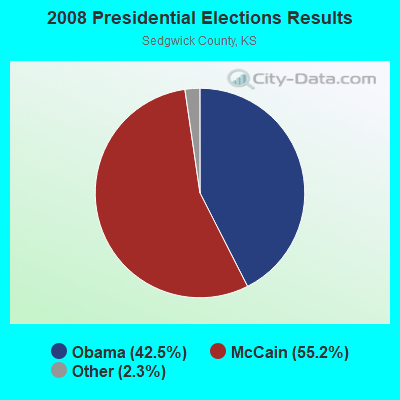
2008 Presidential Elections Results (%) - Democratic Party (Obama)
2008 Presidential Elections Results (%) - Republican Party (McCain)
2008 Presidential Elections Results (%) - Other
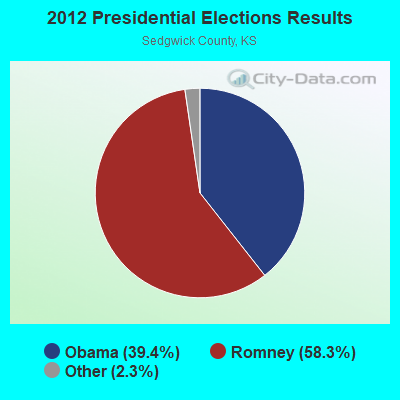
2012 Presidential Elections Results (%) - Democratic Party (Obama)
2012 Presidential Elections Results (%) - Republican Party (Romney)
2012 Presidential Elections Results (%) - Other
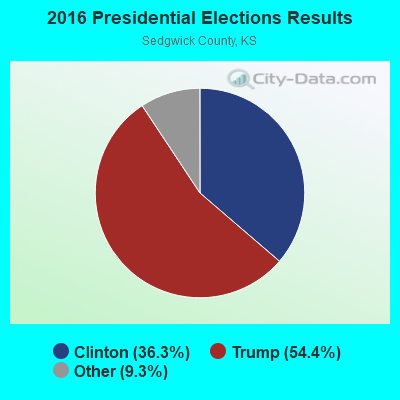
2016 Presidential Elections Results (%) - Democratic Party (Clinton)
2016 Presidential Elections Results (%) - Republican Party (Trump)
2016 Presidential Elections Results (%) - Other
2020 Presidential Elections Results (%) - Democratic Party (Biden)
2020 Presidential Elections Results (%) - Republican Party (Trump)
2020 Presidential Elections Results (%) - Other
Ancestries Reported - Arab (%)
Ancestries Reported - Czech (%)
Ancestries Reported - Danish (%)
Ancestries Reported - Dutch (%)
Ancestries Reported - English (%)
Ancestries Reported - French (%)
Ancestries Reported - French Canadian (%)
Ancestries Reported - German (%)
Ancestries Reported - Greek (%)
Ancestries Reported - Hungarian (%)
Ancestries Reported - Irish (%)
Ancestries Reported - Italian (%)
Ancestries Reported - Lithuanian (%)
Ancestries Reported - Norwegian (%)
Ancestries Reported - Polish (%)
Ancestries Reported - Portuguese (%)
Ancestries Reported - Russian (%)
Ancestries Reported - Scotch-Irish (%)
Ancestries Reported - Scottish (%)
Ancestries Reported - Slovak (%)
Ancestries Reported - Subsaharan African (%)
Ancestries Reported - Swedish (%)
Ancestries Reported - Swiss (%)
Ancestries Reported - Ukrainian (%)
Ancestries Reported - United States (%)
Ancestries Reported - Welsh (%)
Ancestries Reported - West Indian (%)
Ancestries Reported - Other (%)
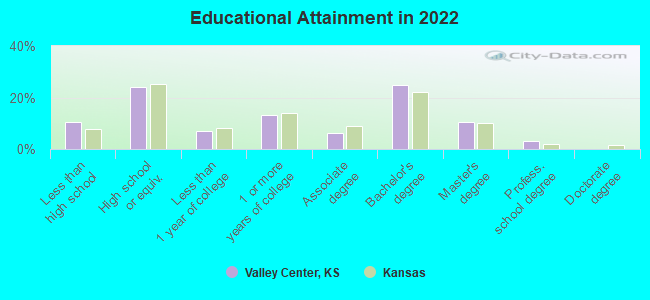
Educational Attainment - No schooling completed (%)
Educational Attainment - Less than high school (%)
Educational Attainment - High school or equivalent (%)
Educational Attainment - Less than 1 year of college (%)
Educational Attainment - 1 or more years of college (%)
Educational Attainment - Associate degree (%)
Educational Attainment - Bachelor's degree (%)
Educational Attainment - Master's degree (%)
Educational Attainment - Professional school degree (%)
Educational Attainment - Doctorate degree (%)
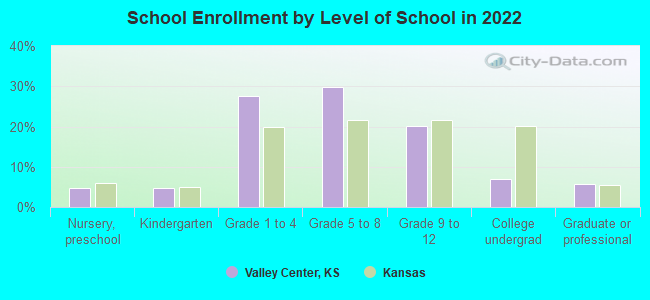
School Enrollment - Nursery, preschool (%)
School Enrollment - Kindergarten (%)
School Enrollment - Grade 1 to 4 (%)
School Enrollment - Grade 5 to 8 (%)
School Enrollment - Grade 9 to 12 (%)
School Enrollment - College undergrad (%)
School Enrollment - Graduate or professional (%)
School Enrollment - Not enrolled in school (%)
School enrollment - Public schools (%)
School enrollment - Private schools (%)
School enrollment - Not enrolled (%)
Median number of rooms in houses and condos
Median number of rooms in apartments
Housing units lacking complete plumbing facilities (%)
Housing units lacking complete kitchen facilities (%)
Density of houses
Urban houses (%)
Rural houses (%)
Households with people 60 years and over (%)
Households with people 65 years and over (%)
Households with people 75 years and over (%)
Households with one or more nonrelatives (%)
Households with no nonrelatives (%)
Population in households (%)
Family households (%)
Nonfamily households (%)
Population in families (%)
Family households with own children (%)
Median number of bedrooms in owner occupied houses
Mean number of bedrooms in owner occupied houses
Median number of bedrooms in renter occupied houses
Mean number of bedrooms in renter occupied houses
Median number of vehichles in owner occupied houses
Mean number of vehichles in owner occupied houses
Median number of vehichles in renter occupied houses
Mean number of vehichles in renter occupied houses
Mortgage status - with mortgage (%)
Mortgage status - with second mortgage (%)
Mortgage status - with home equity loan (%)
Mortgage status - with both second mortgage and home equity loan (%)
Mortgage status - without a mortgage (%)
Average family size
Average family size - White
Average family size - Black or African American
Average family size - Asian
Average family size - Hispanic or Latino
Average family size - American Indian and Alaska Native
Average family size - Multirace
Average family size - Other Race
Geographical mobility - Same house 1 year ago (%)
Geographical mobility - Moved within same county (%)
Geographical mobility - Moved from different county within same state (%)
Geographical mobility - Moved from different state (%)
Geographical mobility - Moved from abroad (%)
Place of birth - Born in state of residence (%)
Place of birth - Born in other state (%)
Place of birth - Native, outside of US (%)
Place of birth - Foreign born (%)
Housing units in structures - 1, detached (%)
Housing units in structures - 1, attached (%)
Housing units in structures - 2 (%)
Housing units in structures - 3 or 4 (%)
Housing units in structures - 5 to 9 (%)
Housing units in structures - 10 to 19 (%)
Housing units in structures - 20 to 49 (%)
Housing units in structures - 50 or more (%)
Housing units in structures - Mobile home (%)
Housing units in structures - Boat, RV, van, etc. (%)
House/condo owner moved in on average (years ago)
Renter moved in on average (years ago)
Year householder moved into unit - Moved in 1999 to March 2000 (%)
Year householder moved into unit - Moved in 1995 to 1998 (%)
Year householder moved into unit - Moved in 1990 to 1994 (%)
Year householder moved into unit - Moved in 1980 to 1989 (%)
Year householder moved into unit - Moved in 1970 to 1979 (%)
Year householder moved into unit - Moved in 1969 or earlier (%)
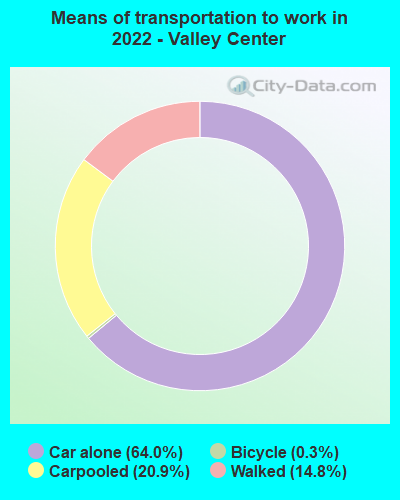
Means of transportation to work - Drove car alone (%)
Means of transportation to work - Carpooled (%)
Means of transportation to work - Public transportation (%)
Means of transportation to work - Bus or trolley bus (%)
Means of transportation to work - Streetcar or trolley car (%)
Means of transportation to work - Subway or elevated (%)
Means of transportation to work - Railroad (%)
Means of transportation to work - Ferryboat (%)
Means of transportation to work - Taxicab (%)
Means of transportation to work - Motorcycle (%)
Means of transportation to work - Bicycle (%)
Means of transportation to work - Walked (%)
Means of transportation to work - Other means (%)
Working at home (%)
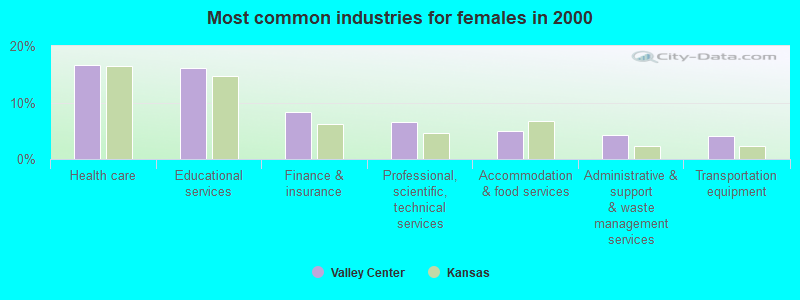
Industry diversity
Most Common Industries - Agriculture, forestry, fishing and hunting, and mining (%)
Most Common Industries - Agriculture, forestry, fishing and hunting (%)
Most Common Industries - Mining, quarrying, and oil and gas extraction (%)
Most Common Industries - Construction (%)
Most Common Industries - Manufacturing (%)
Most Common Industries - Wholesale trade (%)
Most Common Industries - Retail trade (%)
Most Common Industries - Transportation and warehousing, and utilities (%)
Most Common Industries - Transportation and warehousing (%)
Most Common Industries - Utilities (%)
Most Common Industries - Information (%)
Most Common Industries - Finance and insurance, and real estate and rental and leasing (%)
Most Common Industries - Finance and insurance (%)
Most Common Industries - Real estate and rental and leasing (%)
Most Common Industries - Professional, scientific, and management, and administrative and waste management services (%)
Most Common Industries - Professional, scientific, and technical services (%)
Most Common Industries - Management of companies and enterprises (%)
Most Common Industries - Administrative and support and waste management services (%)
Most Common Industries - Educational services, and health care and social assistance (%)
Most Common Industries - Educational services (%)
Most Common Industries - Health care and social assistance (%)
Most Common Industries - Arts, entertainment, and recreation, and accommodation and food services (%)
Most Common Industries - Arts, entertainment, and recreation (%)
Most Common Industries - Accommodation and food services (%)
Most Common Industries - Other services, except public administration (%)
Most Common Industries - Public administration (%)
Occupation diversity
Most Common Occupations - Management, business, science, and arts occupations (%)
Most Common Occupations - Management, business, and financial occupations (%)
Most Common Occupations - Management occupations (%)
Most Common Occupations - Business and financial operations occupations (%)
Most Common Occupations - Computer, engineering, and science occupations (%)
Most Common Occupations - Computer and mathematical occupations (%)
Most Common Occupations - Architecture and engineering occupations (%)
Most Common Occupations - Life, physical, and social science occupations (%)
Most Common Occupations - Education, legal, community service, arts, and media occupations (%)
Most Common Occupations - Community and social service occupations (%)
Most Common Occupations - Legal occupations (%)
Most Common Occupations - Education, training, and library occupations (%)
Most Common Occupations - Arts, design, entertainment, sports, and media occupations (%)
Most Common Occupations - Healthcare practitioners and technical occupations (%)
Most Common Occupations - Health diagnosing and treating practitioners and other technical occupations (%)
Most Common Occupations - Health technologists and technicians (%)
Most Common Occupations - Service occupations (%)
Most Common Occupations - Healthcare support occupations (%)
Most Common Occupations - Protective service occupations (%)
Most Common Occupations - Fire fighting and prevention, and other protective service workers including supervisors (%)
Most Common Occupations - Law enforcement workers including supervisors (%)
Most Common Occupations - Food preparation and serving related occupations (%)
Most Common Occupations - Building and grounds cleaning and maintenance occupations (%)
Most Common Occupations - Personal care and service occupations (%)
Most Common Occupations - Sales and office occupations (%)
Most Common Occupations - Sales and related occupations (%)
Most Common Occupations - Office and administrative support occupations (%)
Most Common Occupations - Natural resources, construction, and maintenance occupations (%)
Most Common Occupations - Farming, fishing, and forestry occupations (%)
Most Common Occupations - Construction and extraction occupations (%)
Most Common Occupations - Installation, maintenance, and repair occupations (%)
Most Common Occupations - Production, transportation, and material moving occupations (%)
Most Common Occupations - Production occupations (%)
Most Common Occupations - Transportation occupations (%)
Most Common Occupations - Material moving occupations (%)
People in Group quarters - Institutionalized population (%)
People in Group quarters - Correctional institutions (%)
People in Group quarters - Federal prisons and detention centers (%)
People in Group quarters - Halfway houses (%)
People in Group quarters - Local jails and other confinement facilities (including police lockups) (%)
People in Group quarters - Military disciplinary barracks (%)
People in Group quarters - State prisons (%)
People in Group quarters - Other types of correctional institutions (%)
People in Group quarters - Nursing homes (%)
People in Group quarters - Hospitals/wards, hospices, and schools for the handicapped (%)
People in Group quarters - Hospitals/wards and hospices for chronically ill (%)
People in Group quarters - Hospices or homes for chronically ill (%)
People in Group quarters - Military hospitals or wards for chronically ill (%)
People in Group quarters - Other hospitals or wards for chronically ill (%)
People in Group quarters - Hospitals or wards for drug/alcohol abuse (%)
People in Group quarters - Mental (Psychiatric) hospitals or wards (%)
People in Group quarters - Schools, hospitals, or wards for the mentally retarded (%)
People in Group quarters - Schools, hospitals, or wards for the physically handicapped (%)
People in Group quarters - Institutions for the deaf (%)
People in Group quarters - Institutions for the blind (%)
People in Group quarters - Orthopedic wards and institutions for the physically handicapped (%)
People in Group quarters - Wards in general hospitals for patients who have no usual home elsewhere (%)
People in Group quarters - Wards in military hospitals for patients who have no usual home elsewhere (%)
People in Group quarters - Juvenile institutions (%)
People in Group quarters - Long-term care (%)
People in Group quarters - Homes for abused, dependent, and neglected children (%)
People in Group quarters - Residential treatment centers for emotionally disturbed children (%)
People in Group quarters - Training schools for juvenile delinquents (%)
People in Group quarters - Short-term care, detention or diagnostic centers for delinquent children (%)
People in Group quarters - Type of juvenile institution unknown (%)
People in Group quarters - Noninstitutionalized population (%)
People in Group quarters - College dormitories (includes college quarters off campus) (%)
People in Group quarters - Military quarters (%)
People in Group quarters - On base (%)
People in Group quarters - Barracks, unaccompanied personnel housing (UPH), (Enlisted/Officer), ;and similar group living quarters for military personnel (%)
People in Group quarters - Transient quarters for temporary residents (%)
People in Group quarters - Military ships (%)
People in Group quarters - Group homes (%)
People in Group quarters - Homes or halfway houses for drug/alcohol abuse (%)
People in Group quarters - Homes for the mentally ill (%)
People in Group quarters - Homes for the mentally retarded (%)
People in Group quarters - Homes for the physically handicapped (%)
People in Group quarters - Other group homes (%)
People in Group quarters - Religious group quarters (%)
People in Group quarters - Dormitories (%)
People in Group quarters - Agriculture workers' dormitories on farms (%)
People in Group quarters - Job Corps and vocational training facilities (%)
People in Group quarters - Other workers' dormitories (%)
People in Group quarters - Crews of maritime vessels (%)
People in Group quarters - Other nonhousehold living situations (%)
People in Group quarters - Other noninstitutional group quarters (%)
Residents speaking English at home (%)
Residents speaking English at home - Born in the United States (%)
Residents speaking English at home - Native, born elsewhere (%)
Residents speaking English at home - Foreign born (%)
Residents speaking Spanish at home (%)
Residents speaking Spanish at home - Born in the United States (%)
Residents speaking Spanish at home - Native, born elsewhere (%)
Residents speaking Spanish at home - Foreign born (%)
Residents speaking other language at home (%)
Residents speaking other language at home - Born in the United States (%)
Residents speaking other language at home - Native, born elsewhere (%)
Residents speaking other language at home - Foreign born (%)
Class of Workers - Employee of private company (%)
Class of Workers - Self-employed in own incorporated business (%)
Class of Workers - Private not-for-profit wage and salary workers (%)
Class of Workers - Local government workers (%)
Class of Workers - State government workers (%)
Class of Workers - Federal government workers (%)
Class of Workers - Self-employed workers in own not incorporated business and Unpaid family workers (%)
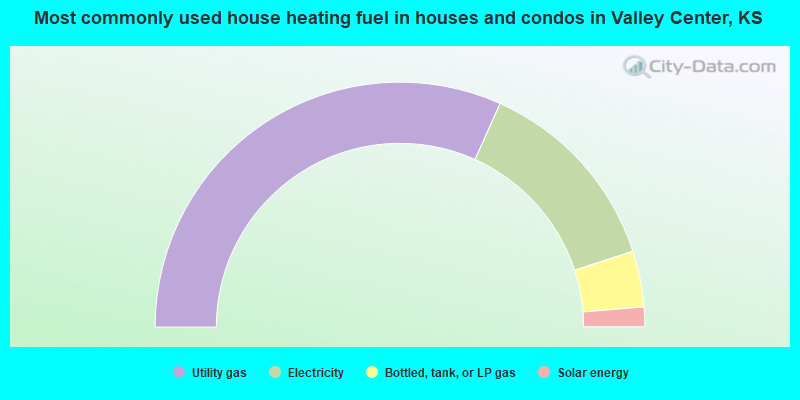
House heating fuel used in houses and condos - Utility gas (%)
House heating fuel used in houses and condos - Bottled, tank, or LP gas (%)
House heating fuel used in houses and condos - Electricity (%)
House heating fuel used in houses and condos - Fuel oil, kerosene, etc. (%)
House heating fuel used in houses and condos - Coal or coke (%)
House heating fuel used in houses and condos - Wood (%)
House heating fuel used in houses and condos - Solar energy (%)
House heating fuel used in houses and condos - Other fuel (%)
House heating fuel used in houses and condos - No fuel used (%)
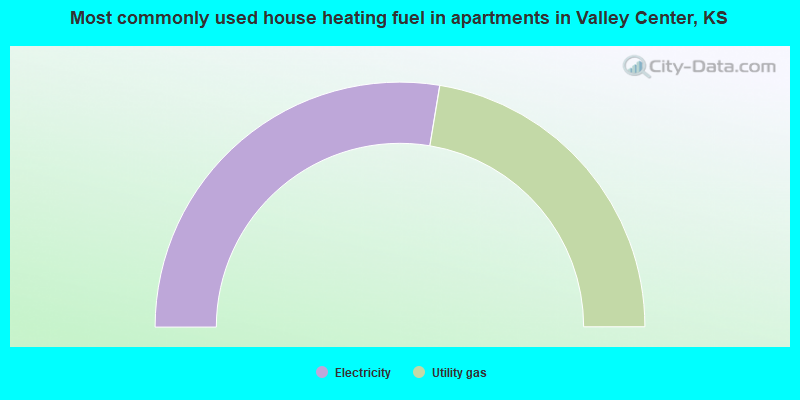
House heating fuel used in apartments - Utility gas (%)
House heating fuel used in apartments - Bottled, tank, or LP gas (%)
House heating fuel used in apartments - Electricity (%)
House heating fuel used in apartments - Fuel oil, kerosene, etc. (%)
House heating fuel used in apartments - Coal or coke (%)
House heating fuel used in apartments - Wood (%)
House heating fuel used in apartments - Solar energy (%)
House heating fuel used in apartments - Other fuel (%)
House heating fuel used in apartments - No fuel used (%)
Armed forces status - In Armed Forces (%)
Armed forces status - Civilian (%)
Armed forces status - Civilian - Veteran (%)
Armed forces status - Civilian - Nonveteran (%)
Fatal accidents locations in years 2005-2021
Fatal accidents locations in 2005
Fatal accidents locations in 2006
Fatal accidents locations in 2007
Fatal accidents locations in 2008
Fatal accidents locations in 2009
Fatal accidents locations in 2010
Fatal accidents locations in 2011
Fatal accidents locations in 2012
Fatal accidents locations in 2013
Fatal accidents locations in 2014
Fatal accidents locations in 2015
Fatal accidents locations in 2016
Fatal accidents locations in 2017
Fatal accidents locations in 2018
Fatal accidents locations in 2019
Fatal accidents locations in 2020
Fatal accidents locations in 2021
Alcohol use - People drinking some alcohol every month (%)
Alcohol use - People not drinking at all (%)
Alcohol use - Average days/month drinking alcohol
Alcohol use - Average drinks/week
Alcohol use - Average days/year people drink much
Audiometry - Average condition of hearing (%)
Audiometry - People that can hear a whisper from across a quiet room (%)
Audiometry - People that can hear normal voice from across a quiet room (%)
Audiometry - Ears ringing, roaring, buzzing (%)
Audiometry - Had a job exposure to loud noise (%)
Audiometry - Had off-work exposure to loud noise (%)
Blood Pressure & Cholesterol - Has high blood pressure (%)
Blood Pressure & Cholesterol - Checking blood pressure at home (%)
Blood Pressure & Cholesterol - Frequently checking blood cholesterol (%)
Blood Pressure & Cholesterol - Has high cholesterol level (%)
Consumer Behavior - Money monthly spent on food at supermarket/grocery store
Consumer Behavior - Money monthly spent on food at other stores
Consumer Behavior - Money monthly spent on eating out
Consumer Behavior - Money monthly spent on carryout/delivered foods
Consumer Behavior - Income spent on food at supermarket/grocery store (%)
Consumer Behavior - Income spent on food at other stores (%)
Consumer Behavior - Income spent on eating out (%)
Consumer Behavior - Income spent on carryout/delivered foods (%)
Current Health Status - General health condition (%)
Current Health Status - Blood donors (%)
Current Health Status - Has blood ever tested for HIV virus (%)
Current Health Status - Left-handed people (%)
Dermatology - People using sunscreen (%)
Diabetes - Diabetics (%)
Diabetes - Had a blood test for high blood sugar (%)
Diabetes - People taking insulin (%)
Diet Behavior & Nutrition - Diet health (%)
Diet Behavior & Nutrition - Milk product consumption (# of products/month)
Diet Behavior & Nutrition - Meals not home prepared (#/week)
Diet Behavior & Nutrition - Meals from fast food or pizza place (#/week)
Diet Behavior & Nutrition - Ready-to-eat foods (#/month)
Diet Behavior & Nutrition - Frozen meals/pizza (#/month)
Drug Use - People that ever used marijuana or hashish (%)
Drug Use - Ever used hard drugs (%)
Drug Use - Ever used any form of cocaine (%)
Drug Use - Ever used heroin (%)
Drug Use - Ever used methamphetamine (%)
Health Insurance - People covered by health insurance (%)
Kidney Conditions-Urology - Avg. # of times urinating at night
Medical Conditions - People with asthma (%)
Medical Conditions - People with anemia (%)
Medical Conditions - People with psoriasis (%)
Medical Conditions - People with overweight (%)
Medical Conditions - Elderly people having difficulties in thinking or remembering (%)
Medical Conditions - People who ever received blood transfusion (%)
Medical Conditions - People having trouble seeing even with glass/contacts (%)
Medical Conditions - People with arthritis (%)
Medical Conditions - People with gout (%)
Medical Conditions - People with congestive heart failure (%)
Medical Conditions - People with coronary heart disease (%)
Medical Conditions - People with angina pectoris (%)
Medical Conditions - People who ever had heart attack (%)
Medical Conditions - People who ever had stroke (%)
Medical Conditions - People with emphysema (%)
Medical Conditions - People with thyroid problem (%)
Medical Conditions - People with chronic bronchitis (%)
Medical Conditions - People with any liver condition (%)
Medical Conditions - People who ever had cancer or malignancy (%)
Mental Health - People who have little interest in doing things (%)
Mental Health - People feeling down, depressed, or hopeless (%)
Mental Health - People who have trouble sleeping or sleeping too much (%)
Mental Health - People feeling tired or having little energy (%)
Mental Health - People with poor appetite or overeating (%)
Mental Health - People feeling bad about themself (%)
Mental Health - People who have trouble concentrating on things (%)
Mental Health - People moving or speaking slowly or too fast (%)
Mental Health - People having thoughts they would be better off dead (%)
Oral Health - Average years since last visit a dentist
Oral Health - People embarrassed because of mouth (%)
Oral Health - People with gum disease (%)
Oral Health - General health of teeth and gums (%)
Oral Health - Average days a week using dental floss/device
Oral Health - Average days a week using mouthwash for dental problem
Oral Health - Average number of teeth
Pesticide Use - Households using pesticides to control insects (%)
Pesticide Use - Households using pesticides to kill weeds (%)
Physical Activity - People doing vigorous-intensity work activities (%)
Physical Activity - People doing moderate-intensity work activities (%)
Physical Activity - People walking or bicycling (%)
Physical Activity - People doing vigorous-intensity recreational activities (%)
Physical Activity - People doing moderate-intensity recreational activities (%)
Physical Activity - Average hours a day doing sedentary activities
Physical Activity - Average hours a day watching TV or videos
Physical Activity - Average hours a day using computer
Physical Functioning - People having limitations keeping them from working (%)
Physical Functioning - People limited in amount of work they can do (%)
Physical Functioning - People that need special equipment to walk (%)
Physical Functioning - People experiencing confusion/memory problems (%)
Physical Functioning - People requiring special healthcare equipment (%)
Prescription Medications - Average number of prescription medicines taking
Preventive Aspirin Use - Adults 40+ taking low-dose aspirin (%)
Reproductive Health - Vaginal deliveries (%)
Reproductive Health - Cesarean deliveries (%)
Reproductive Health - Deliveries resulted in a live birth (%)
Reproductive Health - Pregnancies resulted in a delivery (%)
Reproductive Health - Women breastfeeding newborns (%)
Reproductive Health - Women that had a hysterectomy (%)
Reproductive Health - Women that had both ovaries removed (%)
Reproductive Health - Women that have ever taken birth control pills (%)
Reproductive Health - Women taking birth control pills (%)
Reproductive Health - Women that have ever used Depo-Provera or injectables (%)
Reproductive Health - Women that have ever used female hormones (%)
Sexual Behavior - People 18+ that ever had sex (vaginal, anal, or oral) (%)
Sexual Behavior - Males 18+ that ever had vaginal sex with a woman (%)
Sexual Behavior - Males 18+ that ever performed oral sex on a woman (%)
Sexual Behavior - Males 18+ that ever had anal sex with a woman (%)
Sexual Behavior - Males 18+ that ever had any sex with a man (%)
Sexual Behavior - Females 18+ that ever had vaginal sex with a man (%)
Sexual Behavior - Females 18+ that ever performed oral sex on a man (%)
Sexual Behavior - Females 18+ that ever had anal sex with a man (%)
Sexual Behavior - Females 18+ that ever had any kind of sex with a woman (%)
Sexual Behavior - Average age people first had sex
Sexual Behavior - Average number of female sex partners in lifetime (males 18+)
Sexual Behavior - Average number of female vaginal sex partners in lifetime (males 18+)
Sexual Behavior - Average age people first performed oral sex on a woman (18+)
Sexual Behavior - Average number of woman performed oral sex on in lifetime (18+)
Sexual Behavior - Average number of male sex partners in lifetime (males 18+)
Sexual Behavior - Average number of male anal sex partners in lifetime (males 18+)
Sexual Behavior - Average age people first performed oral sex on a man (18+)
Sexual Behavior - Average number of male oral sex partners in lifetime (18+)
Sexual Behavior - People using protection when performing oral sex (%)
Sexual Behavior - Average number of times people have vaginal or anal sex a year
Sexual Behavior - People having sex without condom (%)
Sexual Behavior - Average number of male sex partners in lifetime (females 18+)
Sexual Behavior - Average number of male vaginal sex partners in lifetime (females 18+)
Sexual Behavior - Average number of female sex partners in lifetime (females 18+)
Sexual Behavior - Circumcised males 18+ (%)
Sleep Disorders - Average hours sleeping at night
Sleep Disorders - People that has trouble sleeping (%)
Smoking-Cigarette Use - People smoking cigarettes (%)
Taste & Smell - People 40+ having problems with smell (%)
Taste & Smell - People 40+ having problems with taste (%)
Taste & Smell - People 40+ that ever had wisdom teeth removed (%)
Taste & Smell - People 40+ that ever had tonsils teeth removed (%)
Taste & Smell - People 40+ that ever had a loss of consciousness because of a head injury (%)
Taste & Smell - People 40+ that ever had a broken nose or other serious injury to face or skull (%)
Taste & Smell - People 40+ that ever had two or more sinus infections (%)
Weight - Average height (inches)
Weight - Average weight (pounds)
Weight - Average BMI
Weight - People that are obese (%)
Weight - People that ever were obese (%)
Weight - People trying to lose weight (%)
According to our research of Kansas and other state lists, there were 11 registered sex offenders living in Valley Center, Kansas as of July 03, 2024 . The ratio of all residents to sex offenders in Valley Center is 588 to 1.The ratio of registered sex offenders to all residents in this city is lower than the state average.
Officers per 1,000 residents here:
2.15Kansas average:
2.70
Latest news from Valley Center, KS collected exclusively by city-data.com from local newspapers, TV, and radio stations
Ancestries: German (44.7%), English (7.6%), Irish (5.5%), American (5.0%), European (3.2%), Polish (1.8%).
Current Local Time:
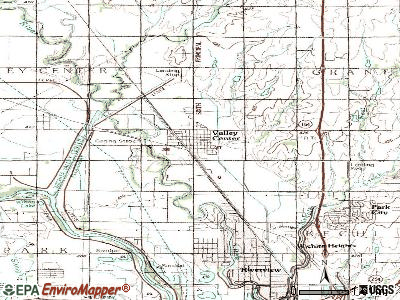
Land area: 3.33 square miles.
Population density: 2,203 people per square mile (low).
226 residents are foreign born (1.2% Latin America , 0.7% Asia , 0.5% North America , 0.3% Europe ).
This city:
2.7%Kansas:
7.1%
Median real estate property taxes paid for housing units with mortgages in 2022: $3,035 (1.4%)Median real estate property taxes paid for housing units with no mortgage in 2022: $3,258 (1.5%)
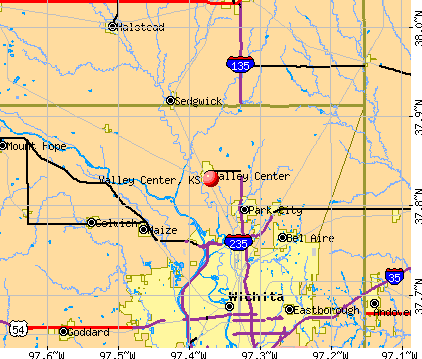
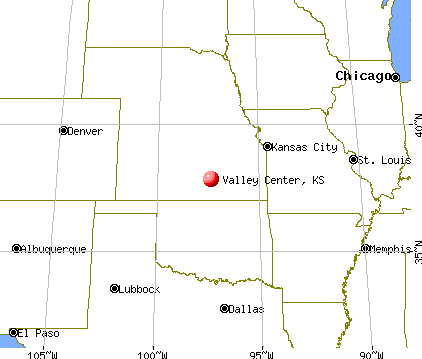
Nearest city with pop. 50,000+: Wichita, KS
Nearest city with pop. 1,000,000+: Dallas, TX
Nearest cities:
Latitude: 37.83 N, Longitude: 97.37 W
Area code commonly used in this area: 316
Property values in Valley Center, KS
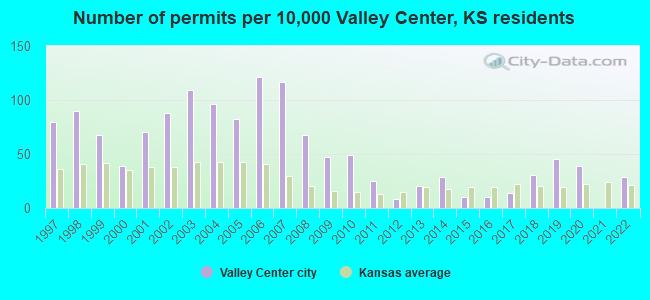
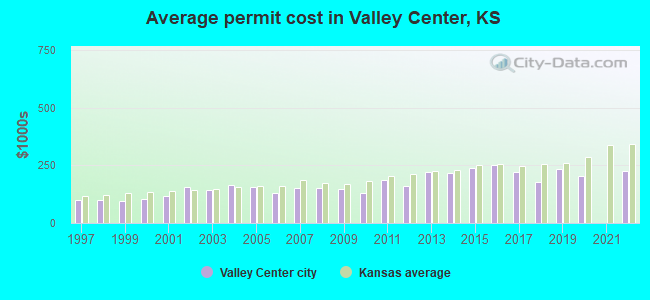
Single-family new house construction building permits:
2022: 14 buildings , average cost: $226,6002020: 19 buildings , average cost: $203,8002019: 22 buildings , average cost: $236,3002018: 15 buildings , average cost: $178,2002017: 7 buildings , average cost: $221,3002016: 5 buildings , average cost: $251,4002015: 5 buildings , average cost: $239,8002014: 14 buildings , average cost: $215,6002013: 10 buildings , average cost: $219,9002012: 4 buildings , average cost: $158,8002011: 12 buildings , average cost: $185,8002010: 24 buildings , average cost: $128,7002009: 23 buildings , average cost: $147,8002008: 33 buildings , average cost: $150,4002007: 57 buildings , average cost: $152,1002006: 59 buildings , average cost: $127,9002005: 40 buildings , average cost: $154,4002004: 47 buildings , average cost: $164,1002003: 53 buildings , average cost: $144,1002002: 43 buildings , average cost: $154,1002001: 34 buildings , average cost: $117,8002000: 19 buildings , average cost: $101,6001999: 33 buildings , average cost: $97,2001998: 44 buildings , average cost: $100,9001997: 39 buildings , average cost: $100,900Unemployment in December 2023:
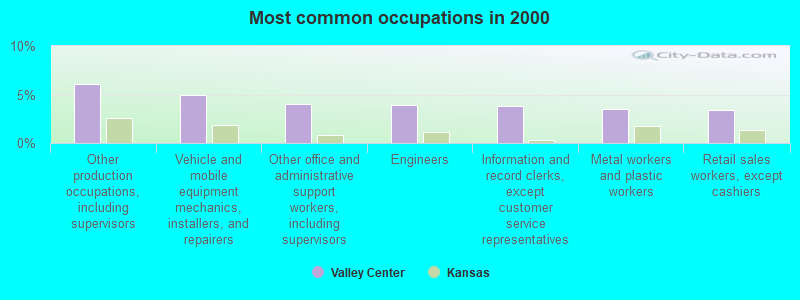
Most common occupations in Valley Center, KS (%)
Both Males Females
Other production occupations, including supervisors (6.0%)
Vehicle and mobile equipment mechanics, installers, and repairers (4.9%)
Other office and administrative support workers, including supervisors (4.0%)
Engineers (3.9%)
Information and record clerks, except customer service representatives (3.8%)
Metal workers and plastic workers (3.5%)
Retail sales workers, except cashiers (3.4%)
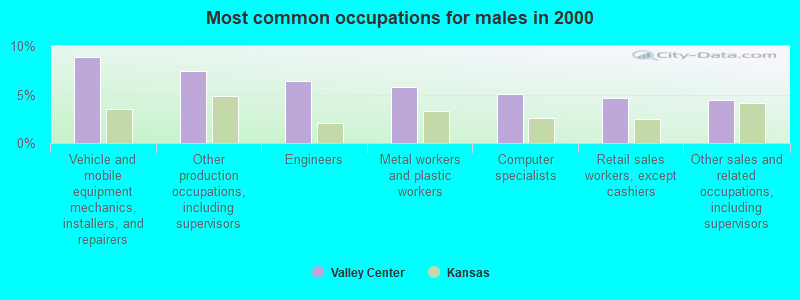
Vehicle and mobile equipment mechanics, installers, and repairers (8.8%)
Other production occupations, including supervisors (7.4%)
Engineers (6.4%)
Metal workers and plastic workers (5.8%)
Computer specialists (5.0%)
Retail sales workers, except cashiers (4.6%)
Other sales and related occupations, including supervisors (4.4%)
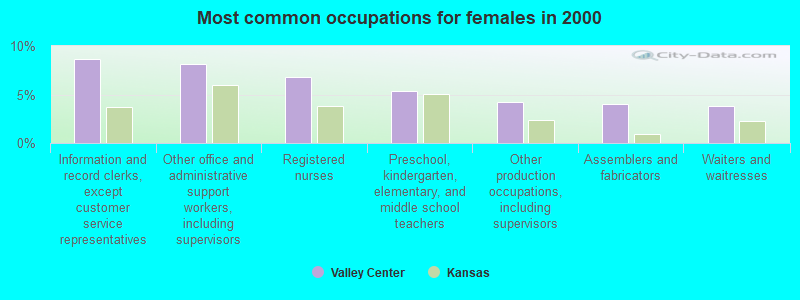
Information and record clerks, except customer service representatives (8.7%)
Other office and administrative support workers, including supervisors (8.1%)
Registered nurses (6.8%)
Preschool, kindergarten, elementary, and middle school teachers (5.4%)
Other production occupations, including supervisors (4.3%)
Assemblers and fabricators (4.1%)
Waiters and waitresses (3.8%)
Tornado activity:
Valley Center-area historical tornado activity is near Kansas state average. It is 101% greater than the overall U.S. average.
On 3/13/1990, a category F5 (max. wind speeds 261-318 mph) tornado 22.4 miles away from the Valley Center city center killed one person and caused between $5,000,000 and $50,000,000 in damages.
On 3/13/1990, a category F5 tornado 24.2 miles away from the city center killed one person and injured 60 people and caused between $5,000,000 and $50,000,000 in damages.
Earthquake activity:
Valley Center-area historical earthquake activity is significantly above Kansas state average. It is 803% greater than the overall U.S. average. On 9/3/2016 at 12:02:44, a magnitude 5.8 (5.8 MW, Depth: 3.5 mi, Class: Moderate, Intensity: VI - VII) earthquake occurred 100.1 miles away from the city center On 11/6/2011 at 03:53:10, a magnitude 5.7 (5.7 MW, Depth: 3.2 mi) earthquake occurred 162.4 miles away from the city center On 11/12/2014 at 21:40:00, a magnitude 4.9 (4.9 MW, Depth: 2.5 mi, Class: Light, Intensity: IV - V) earthquake occurred 41.0 miles away from the city center On 2/13/2016 at 17:07:06, a magnitude 5.1 (5.1 MW, Depth: 5.2 mi) earthquake occurred 118.5 miles away from the city center On 11/7/2016 at 01:44:24, a magnitude 5.0 (5.0 MW, Depth: 2.8 mi) earthquake occurred 131.0 miles away from Valley Center center On 1/19/2020 at 19:08:42, a magnitude 4.5 (4.5 MW, Depth: 3.1 mi) earthquake occurred 35.6 miles away from Valley Center center Magnitude types: moment magnitude (MW) Natural disasters: The number of natural disasters in Sedgwick County (16) is near the US average (15).Major Disasters (Presidential) Declared: 12Emergencies Declared: 3Floods: 8, Storms: 8, Tornadoes: 3, Winter Storms: 3, Explosion: 1, Heavy Rain: 1, Hurricane: 1, Ice Storm: 1, Wind: 1, Other: 1 (Note: some incidents may be assigned to more than one category). Hospitals and medical centers near Valley Center: ANGELS CARE HOME HEALTH (Home Health Center, about 6 miles away; WICHITA, KS)
PIROTTE HOME HEALTH CARE INC (Home Health Center, about 7 miles away; WICHITA, KS)
SEDGWICK HEALTHCARE CENTER (Nursing Home, about 8 miles away; SEDGWICK, KS)
CATHOLIC CARE CENTER (Nursing Home, about 8 miles away; BEL AIRE, KS)
NORTH TOWNE MANOR (Nursing Home, about 8 miles away; WICHITA, KS)
CPC GREAT PLAINS HOSPITAL (Hospital, about 8 miles away; WICHITA, KS)
SAINT RAPHAEL HOME CARE INC (Home Health Center, about 8 miles away; WICHITA, KS)
Amtrak station near Valley Center: 16 miles: NEWTON (5TH & MAIN STS.) Services: ticket office, fully wheelchair accessible, enclosed waiting area, public restrooms, public payphones, vending machines, free short-term parking, free long-term parking, call for taxi service.
Colleges/universities with over 2000 students nearest to Valley Center:
Wichita State University (about 9 miles; Wichita, KS ; Full-time enrollment: 11,743)
Wichita Area Technical College (about 10 miles; Wichita, KS ; FT enrollment: 2,220)
Friends University (about 11 miles; Wichita, KS ; FT enrollment: 2,024)
Newman University (about 11 miles; Wichita, KS ; FT enrollment: 2,066)
Wichita Technical Institute (about 12 miles; Wichita, KS ; FT enrollment: 2,015)
Butler Community College (about 27 miles; El Dorado, KS ; FT enrollment: 6,676)
Hutchinson Community College (about 35 miles; Hutchinson, KS ; FT enrollment: 4,174)
Public high school in Valley Center:
Public elementary/middle schools in Valley Center: VALLEY CENTER MIDDLE SCHOOL Students: 606, Location: 800 N. MERIDIAN, Grades: 7-8)WHEATLAND ELEM Students: 417, Location: 800 MEADOW, Grades: KG-4)WEST ELEM Students: 410, Location: 501 N SHERIDAN, Grades: PK-4)ABILENE ELEM Students: 368, Location: 522 N ABILENE, Grades: KG-4)VALLEY CENTER INTERMEDIATE SCHOOL Students: 101, Location: 737 N. MERIDIAN, Grades: 5-6)See full list of schools located in Valley Center Library in Valley Center: EDNA BUSCHOW MEMORIAL LIBRARY Operating income: $264,031; Location: 321 WEST 1ST ST.; 63,232 books ; 874 audio materials ; 628 video materials ; 30 state licensed databases ; 111 print serial subscriptions )
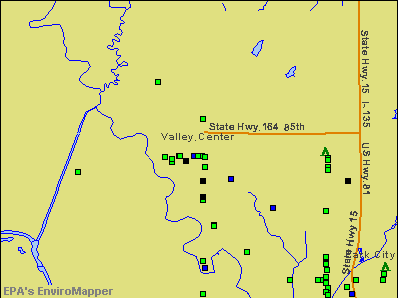
Notable locations in Valley Center: (A) , Valley Center Wastewater Treatment Plant (B) , Valley Center Police Department (C) , Edna Buschow Memorial Library Valley Center (D) , Valley Center Fire Department (E) , Valley Center City Hall (F) , Valley Center Cultural and Historical Museum (G) , New Hope Nursing Home (H) , Sedgwick County Emergency Medical Service Post 45 (I) . Display/hide their locations on the map
Streams, rivers, and creeks: (A) . Display/hide its location on the map
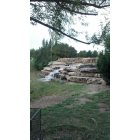
Tourist attractions:
Sedgwick County has a predicted average indoor radon screening level between 2 and 4 pCi/L (pico curies per liter) - Moderate Potential Drinking water stations with addresses in Valley Center and their reported violations in the past:
NORTH STAR RV PARK AND MOBILE HOME COMM (Population served: 25, Groundwater):
Past monitoring violations:
One minor monitoring violation
Average household size: This city:
2.8 peopleKansas:
2.5 people
Percentage of family households: This city:
75.0%Whole state:
66.0%
Percentage of households with unmarried partners: This city:
4.3%Whole state:
5.8%
Likely homosexual households (counted as self-reported same-sex unmarried-partner households)
Lesbian couples: 0.3% of all households Gay men: 0.2% of all households
88 people in other nonhousehold living situations in 2000
Arena or stadium:
Britt Brown Arena. Capacity: 12,000.
Banks with branches in Valley Center (2011 data):
The Halstead Bank: Valley Center Branch at 101 West Industrial, branch established on 2002/06/03. Info updated 2009/04/03: Bank assets: $76.5 mil, Deposits: $67.3 mil, headquarters in Halstead, KS, positive income , Agricultural Specialization, 5 total offices , Holding Company: Williams Holding Company, Inc.
Emprise Bank: Valley Center Branch at 100 North Meridian, branch established on 1989/06/30. Info updated 2011/04/13: Bank assets: $1,461.9 mil, Deposits: $1,282.4 mil, headquarters in Wichita, KS, positive income , Commercial Lending Specialization, 42 total offices , Holding Company: Emprise Financial Corporation
Intrust Bank, National Association: Valley Center Branch at 142 North Ash Street, branch established on 1954/10/04. Info updated 2007/03/28: Bank assets: $4,066.0 mil, Deposits: $3,310.3 mil, headquarters in Wichita, KS, positive income , Commercial Lending Specialization, 48 total offices , Holding Company: Intrust Financial Corporation
For population 15 years and over in Valley Center:
Never married: 24.6%Now married: 59.8%Separated: 0.1%Widowed: 7.4%Divorced: 8.1% For population 25 years and over in Valley Center:
High school or higher: 90.1%Bachelor's degree or higher: 36.9%Graduate or professional degree: 13.2%Unemployed: 1.5%Mean travel time to work (commute): 23.1 minutes
Education Gini index (Inequality in education) Here:
16.0Kansas average:
11.5
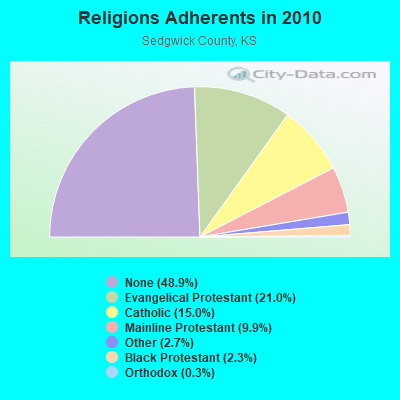
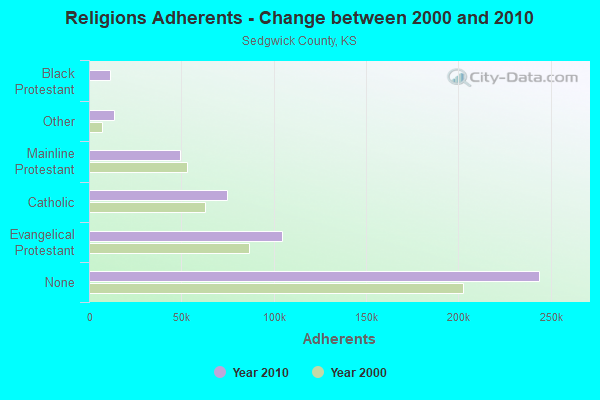
Religion statistics for Valley Center, KS (based on Sedgwick County data)
Religion Adherents Congregations Evangelical Protestant 104,418 317 Catholic 74,600 32 Mainline Protestant 49,200 118 Other 13,532 47 Black Protestant 11,312 28 Orthodox 1,361 4 None 243,942 -
Source: Clifford Grammich, Kirk Hadaway, Richard Houseal, Dale E.Jones, Alexei Krindatch, Richie Stanley and Richard H.Taylor. 2012. 2010 U.S.Religion Census: Religious Congregations & Membership Study. Association of Statisticians of American Religious Bodies. Jones, Dale E., et al. 2002. Congregations and Membership in the United States 2000. Nashville, TN: Glenmary Research Center. Graphs represent county-level data
Food Environment Statistics: Number of grocery stores : 63Here :
1.33 / 10,000 pop.Kansas :
1.96 / 10,000 pop.
Number of supercenters and club stores : 6Sedgwick County :
0.13 / 10,000 pop.State :
0.20 / 10,000 pop.
Number of convenience stores (no gas) : 16Sedgwick County :
0.34 / 10,000 pop.Kansas :
0.51 / 10,000 pop.
Number of convenience stores (with gas) : 113Sedgwick County :
2.38 / 10,000 pop.State :
3.84 / 10,000 pop.
Number of full-service restaurants : 306This county :
6.44 / 10,000 pop.State :
7.33 / 10,000 pop.
Adult diabetes rate : Sedgwick County :
8.7%Kansas :
8.1%
Adult obesity rate : Sedgwick County :
28.3%Kansas :
27.9%
Low-income preschool obesity rate : This county :
16.5%State :
13.4%
Health and Nutrition: Healthy diet rate : Valley Center:
44.6%State:
49.2%
Average overall health of teeth and gums : Valley Center:
37.4%Kansas:
46.3%
Average BMI : Valley Center:
28.8State:
28.6
People feeling badly about themselves : Valley Center:
23.3%Kansas:
21.2%
People not drinking alcohol at all : Average hours sleeping at night : Overweight people : Valley Center:
34.1%Kansas:
33.5%
General health condition : Valley Center:
50.1%Kansas:
56.0%
Average condition of hearing : Valley Center:
75.4%Kansas:
78.6%
More about Health and Nutrition of Valley Center, KS Residents
Local government employment and payroll (March 2022)
Function
Full-time employees
Monthly full-time payroll
Average yearly full-time wage
Part-time employees
Monthly part-time payroll
Police Protection - Officers
17 $76,493 $53,995 0 $0 Streets and Highways
5 $15,985 $38,364 0 $0 Parks and Recreation
4 $17,632 $52,896 0 $0 Other Government Administration
4 $22,393 $67,179 9 $425 Firefighters
4 $18,775 $56,325 3 $83 Financial Administration
3 $16,293 $65,172 0 $0 Housing and Community Development (Local)
3 $13,928 $55,712 0 $0 Water Supply
3 $14,971 $59,884 0 $0 Sewerage
3 $12,812 $51,248 0 $0 Police - Other
1 $4,216 $50,592 0 $0 Judicial and Legal
1 $3,543 $42,516 0 $0
Totals for Government
48 $217,040 $54,260 12 $508
Valley Center government finances - Expenditure in 2021 (per resident):
Current Operations - Water Utilities: $1,973,000 ($268.51)
Sewerage: $1,216,000 ($165.49)Police Protection: $1,188,000 ($161.68)General - Other: $1,027,000 ($139.77)Regular Highways: $921,000 ($125.34)Financial Administration: $652,000 ($88.73)Parks and Recreation: $552,000 ($75.12)Solid Waste Management: $495,000 ($67.37)Local Fire Protection: $401,000 ($54.57)Health - Other: $288,000 ($39.19)Libraries: $275,000 ($37.43)Judicial and Legal Services: $165,000 ($22.46)General - Interest on Debt: $737,000 ($100.30)
Valley Center government finances - Revenue in 2021 (per resident):
Charges - Sewerage: $1,319,000 ($179.50)
Solid Waste Management: $496,000 ($67.50)Other: $320,000 ($43.55)Local Intergovernmental - Other: $147,000 ($20.01)
Miscellaneous - Special Assessments: $428,000 ($58.25)
General Revenue - Other: $174,000 ($23.68)Fines and Forfeits: $136,000 ($18.51)Interest Earnings: $12,000 ($1.63)Revenue - Water Utilities: $2,464,000 ($335.33)
State Intergovernmental - Highways: $218,000 ($29.67)
General Local Government Support: $20,000 ($2.72)Tax - Property: $4,021,000 ($547.22)
General Sales and Gross Receipts: $1,304,000 ($177.46)Alcoholic Beverage License: $1,000 ($0.14)
Valley Center government finances - Debt in 2021 (per resident):
Long Term Debt - Outstanding Unspecified Public Purpose: $24,274,000 ($3303.48)
Beginning Outstanding - Unspecified Public Purpose: $21,227,000 ($2888.81)Issue, Unspecified Public Purpose: $11,200,000 ($1524.22)Retired Unspecified Public Purpose: $8,153,000 ($1109.55)Outstanding Nonguaranteed - Industrial Revenue: $2,523,000 ($343.36)Beginning Outstanding - Public Debt for Private Purpose: $2,523,000 ($343.36)
Valley Center government finances - Cash and Securities in 2021 (per resident):
Bond Funds - Cash and Securities: $3,047,000 ($414.67)
Other Funds - Cash and Securities: $9,261,000 ($1260.34)
Sinking Funds - Cash and Securities: $3,646,000 ($496.19)
4.59% of this county's 2021 resident taxpayers lived in other counties in 2020 ($63,222 average adjusted gross income )
Here:
4.59%Kansas average:
6.64%
0.03% of residents moved from foreign countries ($380 average AGI )Sedgwick County:
0.03%Kansas average:
0.04%
Top counties from which taxpayers relocated into this county between 2020 and 2021:
4.79% of this county's 2020 resident taxpayers moved to other counties in 2021 ($59,492 average adjusted gross income )
Here:
4.79%Kansas average:
6.88%
0.03% of residents moved to foreign countries ($328 average AGI )Sedgwick County:
0.03%Kansas average:
0.03%
Top counties to which taxpayers relocated from this county between 2020 and 2021:
Businesses in Valley Center, KS
Name Count Name Count
H&R Block 1 Subway 1 Kroger 1 True Value 1 Pizza Hut 1 U-Haul 1 SONIC Drive-In 1
Strongest AM radio stations in Valley Center:
KFTI (1070 AM; 10 kW; WICHITA, KS; Owner: JOURNAL BROADCAST CORPORATION)
KMYR (1410 AM; 5 kW; WICHITA, KS; Owner: AGAPE COMMUNICATIONS, INC.)
KQAM (1480 AM; 5 kW; WICHITA, KS; Owner: ABC, INC.)
KFH (1330 AM; 5 kW; WICHITA, KS; Owner: ENTERCOM WICHITA LICENSE, LLC)
KNSS (1240 AM; 1 kW; WICHITA, KS; Owner: ENTERCOM WICHITA LICENSE, LLC)
KRMG (740 AM; 50 kW; TULSA, OK; Owner: CXR HOLDINGS, INC.)
KSGL (900 AM; 0 kW; WICHITA, KS; Owner: AGAPE COMMUNICATIONS, INC.)
KJRG (950 AM; 0 kW; NEWTON, KS)
KFAQ (1170 AM; 50 kW; TULSA, OK; Owner: JOURNAL BROADCAST CORPORATION)
WHB (810 AM; 50 kW; KANSAS CITY, MO; Owner: UNION BROADCASTING, INC.)
KRVN (880 AM; 50 kW; LEXINGTON, NE; Owner: NEBRASKA RURAL RADIO ASSOCIATION)
KOMA (1520 AM; 50 kW; OKLAHOMA CITY, OK; Owner: RENDA BROADCASTING CORP. OF NEVADA)
KGGF (690 AM; 10 kW; COFFEYVILLE, KS; Owner: KGGF-KUSN, INC.)
Strongest FM radio stations in Valley Center:
KEYN-FM (103.7 FM; WICHITA, KS; Owner: ENTERCOM WICHITA LICENSE, LLC)
KRBB (97.9 FM; WICHITA, KS; Owner: CAPSTAR TX LIMITED PARTNERSHIP)
KFDI-FM (101.3 FM; WICHITA, KS; Owner: JOURNAL BROADCAST CORPORATION)
KFBZ (105.3 FM; HAYSVILLE, KS; Owner: ENTERCOM WICHITA LICENSE, LLC)
KZSN (102.1 FM; HUTCHINSON, KS; Owner: CAPSTAR TX LIMITED PARTNERSHIP)
KICT-FM (95.1 FM; WICHITA, KS; Owner: JOURNAL BROADCAST CORPORATION)
KKRD (107.3 FM; WICHITA, KS; Owner: CAPSTAR TX LIMITED PARTNERSHIP)
KMUW (89.1 FM; WICHITA, KS; Owner: WICHITA STATE UNIVERSITY)
KRZZ-FM (96.3 FM; DERBY, KS; Owner: CAPSTAR TX LIMITED PARTNERSHIP)
KMXW (92.3 FM; NEWTON, KS; Owner: JOURNAL BROADCAST CORPORATION)
KCFN (91.1 FM; WICHITA, KS; Owner: AMERICAN FAMILY ASSOCIATION)
KHCC-FM (90.1 FM; HUTCHINSON, KS; Owner: HUTCHINSON COMMUNITY JR. COLLEGE)
KYQQ (106.5 FM; ARKANSAS CITY, KS; Owner: JOURNAL BROADCAST CORPORATION)
K218DR (91.5 FM; BELLAIRE, KS; Owner: EDUCATIONAL MEDIA FOUNDATION)
KTLI (99.1 FM; EL DORADO, KS; Owner: ADONAI RADIO GROUP, INC.)
KDGS (93.9 FM; ANDOVER, KS; Owner: ENTERCOM WICHITA LICENSE, LLC)
KFXJ (104.5 FM; AUGUSTA, KS; Owner: JOURNAL BROADCAST CORPORATION)
KYFW (88.3 FM; WICHITA, KS; Owner: BIBLE BROADCASTING NETWORK, INC.)
KANR (92.7 FM; BELLE PLAINE, KS; Owner: DANIEL D. SMITH)
TV broadcast stations around Valley Center:
KSNW (Channel 3; WICHITA, KS; Owner: EMMIS TELEVISION LICENSE CORPORATION OF WICHITA)
KSAS-TV (Channel 24; WICHITA, KS; Owner: CLEAR CHANNEL BROADCASTING LICENSES, INC.)
KWCV (Channel 33; WICHITA, KS; Owner: WLBB BROADCASTING, L.L.C.)
KAKE-TV (Channel 10; WICHITA, KS; Owner: GRAY MIDAMERICA TV LICENSEE CORP.)
KSCC (Channel 36; HUTCHINSON, KS; Owner: MERCURY BROADCASTING COMPANY, INC.)
KCTU-LP (Channel 55; WICHITA, KS; Owner: RIVER CITY BROADCASTING CORP.)
KSMI-LP (Channel 51; WICHITA, KS; Owner: RIVER CITY BROADCASTING CORP.)
KTQW-LP (Channel 53; WICHITA, KS; Owner: KNOWLEDGE L.C.)
KFVT-LP (Channel 40; WICHITA, KS; Owner: LOCKE SUPPLY CO.)
KWCH-TV (Channel 12; HUTCHINSON, KS; Owner: MEDIA GENERAL BROADCASTING OF SO. CAROLINA HOLDINGS, INC.)
K59DA (Channel 59; WICHITA, KS; Owner: TRINITY BROADCASTING NETWORK)
K15DD (Channel 15; WICHITA, KS; Owner: VENTANA TELEVISION, INC.)
KPTS (Channel 8; HUTCHINSON, KS; Owner: KANSAS PUBLIC TELECOMMUNICATIONS SERVICE, INC.)
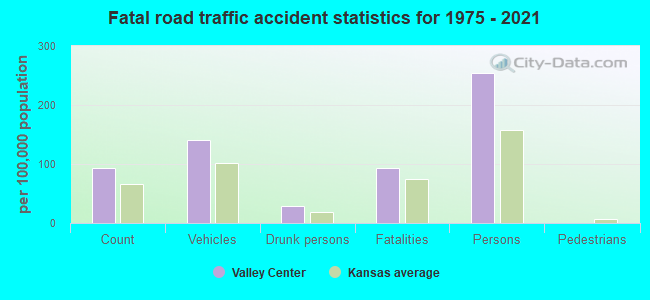
Valley Center fatal accident statistics for 1975 - 2021
Valley Center fatal accident list:
Oct 30, 2018 01:38 PM, N Ridge Rd W, Lat: 37.845714, Lon: -97.426936, Vehicles: 2, Persons: 1, Fatalities: 1Lat: 37.847506, Lon: -97.225714, Vehicles: 1, Persons: 1, Fatalities: 1Lat: 37.865481, Lon: -97.335681, Vehicles: 1, Persons: 1, Fatalities: 1, Drunk persons involved: 1Lat: 37.830386, Lon: -97.372003, Vehicles: 1, Persons: 2, Fatalities: 1, Drunk persons involved: 1Lat: 37.830180, Lon: -97.372020, Vehicles: 3, Persons: 5, Fatalities: 1Vehicles: 1, Persons: 5, Fatalities: 1
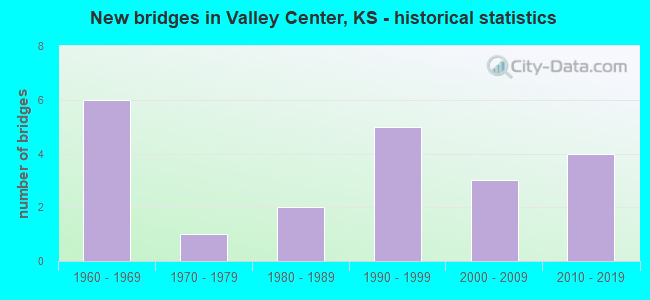
National Bridge Inventory (NBI) Statistics 21 Number of bridges236ft / 72.4m Total length $925,000 Total costs26,702 Total average daily traffic1,343 Total average daily truck traffic37,262 Total future (year 2038) average daily traffic
New bridges - historical statistics
6 1960-1969 1 1970-1979 2 1980-1989 5 1990-1999 3 2000-2009 4 2010-2019
See full National Bridge Inventory statistics for Valley Center, KS
FCC Registered Cell Phone Towers: 2 (
See the full list of FCC Registered Cell Phone Towers in Valley Center )
FCC Registered Antenna Towers: 25 (
See the full list of FCC Registered Antenna Towers )
FCC Registered Broadcast Land Mobile Towers: 4
2 1/2 Mi S (Lat: 37.794167 Lon: -97.373111), Structure height: 15 m, Call Sign: WNKY486, Licensee ID: L00126810, Assigned Frequencies: 457.825 MHz, Grant Date: 12/10/1997, Expiration Date: 12/21/2002, Cancellation Date: 08/09/2002, Registrant: Jayhawk Pipeline L L C, Mcpherson, KS 67460, Phone: (316) 938-2488 8103 Se 96th St (Lat: 38.916667 Lon: -97.208639), Call Sign: WPZK626, Assigned Frequencies: 157.635 MHz, Grant Date: 01/30/2004, Expiration Date: 01/30/2014, Cancellation Date: 04/05/2014, Certifier: Doug Entz, Registrant: Tbs Electronics, Inc., 5225 Sw Topeka Blvd, Topeka, KS 66609, Phone: (785) 862-7450, Fax: (785) 862-7647, Email:
9600 N. Meridian Ave. (Lat: 37.854944 Lon: -97.371028), Type: Mast, Structure height: 13.4 m, Overall height: 14.9 m, Call Sign: WQND500, Assigned Frequencies: 72.1000 MHz, Grant Date: 10/17/2020, Expiration Date: 12/29/2030, Certifier: Rick White, Registrant: Usd 262, 143 S. Meridian, Valley Center, KS 67147, Phone: (316) 755-7000 3501 E 101st St N (Lat: 37.870472 Lon: -97.284694), Type: Pole, Structure height: 3.1 m, Overall height: 6.1 m, Call Sign: WQVS888, Assigned Frequencies: 173.337 MHz, Grant Date: 05/04/2015, Expiration Date: 05/04/2025, Certifier: Terry L Kelley, Registrant: Atlas License Company & Data Services, 176 West Logan St Suite 227, Noblesville, IN 46060, Phone: (317) 813-4865, Fax: (317) 813-4870, Email:
FCC Registered Microwave Towers: 12 (
See the full list of FCC Registered Microwave Towers in this town )
FCC Registered Amateur Radio Licenses: 50 (
See the full list of FCC Registered Amateur Radio Licenses in Valley Center )
FAA Registered Aircraft: 74 (
See the full list of FAA Registered Aircraft in Valley Center )
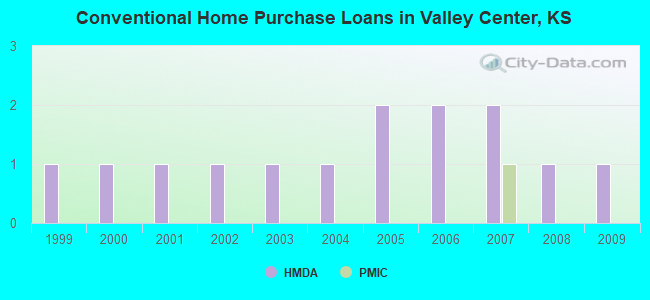
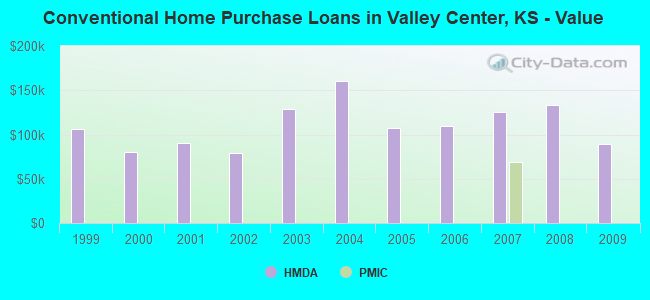
Home Mortgage Disclosure Act Aggregated Statistics For Year 2009(Based on 4 partial tracts) A) FHA, FSA/RHS & VA B) Conventional C) Refinancings Number Average Value Number Average Value Number Average Value
LOANS ORIGINATED 1 $84,110 1 $89,690 2 $151,085 APPLICATIONS APPROVED, NOT ACCEPTED 0 $0 0 $0 0 $0 APPLICATIONS DENIED 0 $0 0 $0 1 $93,140 APPLICATIONS WITHDRAWN 0 $0 0 $0 1 $81,710 FILES CLOSED FOR INCOMPLETENESS 0 $0 0 $0 0 $0
Aggregated Statistics For Year 2008(Based on 4 partial tracts) B) Conventional C) Refinancings Number Average Value Number Average Value
LOANS ORIGINATED 1 $132,830 1 $193,960 APPLICATIONS APPROVED, NOT ACCEPTED 0 $0 0 $0 APPLICATIONS DENIED 0 $0 1 $101,330 APPLICATIONS WITHDRAWN 0 $0 0 $0 FILES CLOSED FOR INCOMPLETENESS 0 $0 0 $0
Aggregated Statistics For Year 2007(Based on 4 partial tracts) B) Conventional C) Refinancings Number Average Value Number Average Value
LOANS ORIGINATED 2 $125,325 1 $147,770 APPLICATIONS APPROVED, NOT ACCEPTED 0 $0 0 $0 APPLICATIONS DENIED 0 $0 1 $133,440 APPLICATIONS WITHDRAWN 0 $0 0 $0 FILES CLOSED FOR INCOMPLETENESS 0 $0 0 $0
Aggregated Statistics For Year 2006(Based on 4 partial tracts) B) Conventional C) Refinancings D) Home Improvement Loans Number Average Value Number Average Value Number Average Value
LOANS ORIGINATED 2 $109,335 2 $90,110 1 $15,120 APPLICATIONS APPROVED, NOT ACCEPTED 0 $0 0 $0 0 $0 APPLICATIONS DENIED 0 $0 1 $130,830 0 $0 APPLICATIONS WITHDRAWN 0 $0 1 $98,860 0 $0 FILES CLOSED FOR INCOMPLETENESS 0 $0 0 $0 0 $0
Aggregated Statistics For Year 2005(Based on 4 partial tracts) B) Conventional C) Refinancings Number Average Value Number Average Value
LOANS ORIGINATED 2 $107,350 2 $74,240 APPLICATIONS APPROVED, NOT ACCEPTED 0 $0 0 $0 APPLICATIONS DENIED 0 $0 1 $141,430 APPLICATIONS WITHDRAWN 0 $0 1 $107,550 FILES CLOSED FOR INCOMPLETENESS 0 $0 0 $0
Aggregated Statistics For Year 2004(Based on 4 partial tracts) B) Conventional C) Refinancings Number Average Value Number Average Value
LOANS ORIGINATED 1 $160,190 2 $99,995 APPLICATIONS APPROVED, NOT ACCEPTED 0 $0 0 $0 APPLICATIONS DENIED 0 $0 1 $101,480 APPLICATIONS WITHDRAWN 0 $0 0 $0 FILES CLOSED FOR INCOMPLETENESS 0 $0 0 $0
Aggregated Statistics For Year 2003(Based on 4 partial tracts) B) Conventional C) Refinancings Number Average Value Number Average Value
LOANS ORIGINATED 1 $129,000 4 $92,300 APPLICATIONS APPROVED, NOT ACCEPTED 0 $0 0 $0 APPLICATIONS DENIED 0 $0 1 $72,370 APPLICATIONS WITHDRAWN 0 $0 0 $0 FILES CLOSED FOR INCOMPLETENESS 0 $0 0 $0
Aggregated Statistics For Year 2002(Based on 4 partial tracts) B) Conventional C) Refinancings Number Average Value Number Average Value
LOANS ORIGINATED 1 $79,400 3 $83,420 APPLICATIONS APPROVED, NOT ACCEPTED 0 $0 0 $0 APPLICATIONS DENIED 0 $0 1 $62,440 APPLICATIONS WITHDRAWN 0 $0 0 $0 FILES CLOSED FOR INCOMPLETENESS 0 $0 0 $0
Aggregated Statistics For Year 2001(Based on 4 partial tracts) B) Conventional C) Refinancings D) Home Improvement Loans Number Average Value Number Average Value Number Average Value
LOANS ORIGINATED 1 $90,630 2 $89,775 1 $9,970 APPLICATIONS APPROVED, NOT ACCEPTED 0 $0 0 $0 0 $0 APPLICATIONS DENIED 0 $0 0 $0 0 $0 APPLICATIONS WITHDRAWN 0 $0 0 $0 0 $0 FILES CLOSED FOR INCOMPLETENESS 0 $0 0 $0 0 $0
Aggregated Statistics For Year 2000(Based on 4 partial tracts) B) Conventional C) Refinancings Number Average Value Number Average Value
LOANS ORIGINATED 1 $80,220 1 $68,320 APPLICATIONS APPROVED, NOT ACCEPTED 0 $0 0 $0 APPLICATIONS DENIED 0 $0 0 $0 APPLICATIONS WITHDRAWN 0 $0 0 $0 FILES CLOSED FOR INCOMPLETENESS 0 $0 0 $0
Aggregated Statistics For Year 1999(Based on 4 partial tracts) B) Conventional C) Refinancings D) Home Improvement Loans Number Average Value Number Average Value Number Average Value
LOANS ORIGINATED 1 $106,770 1 $85,620 1 $6,260 APPLICATIONS APPROVED, NOT ACCEPTED 0 $0 0 $0 0 $0 APPLICATIONS DENIED 0 $0 0 $0 0 $0 APPLICATIONS WITHDRAWN 0 $0 0 $0 0 $0 FILES CLOSED FOR INCOMPLETENESS 0 $0 0 $0 0 $0
Detailed HMDA statistics for the following Tracts:
0102.00
Private Mortgage Insurance Companies Aggregated Statistics For Year 2007(Based on 4 partial tracts) A) Conventional Number Average Value
LOANS ORIGINATED 1 $68,490 APPLICATIONS APPROVED, NOT ACCEPTED 0 $0 APPLICATIONS DENIED 0 $0 APPLICATIONS WITHDRAWN 0 $0 FILES CLOSED FOR INCOMPLETENESS 0 $0
Aggregated Statistics For Year 2003(Based on 4 partial tracts) B) Refinancings Number Average Value
LOANS ORIGINATED 1 $76,330 APPLICATIONS APPROVED, NOT ACCEPTED 0 $0 APPLICATIONS DENIED 0 $0 APPLICATIONS WITHDRAWN 0 $0 FILES CLOSED FOR INCOMPLETENESS 0 $0
Aggregated Statistics For Year 2002(Based on 4 partial tracts) B) Refinancings Number Average Value
LOANS ORIGINATED 1 $64,230 APPLICATIONS APPROVED, NOT ACCEPTED 0 $0 APPLICATIONS DENIED 0 $0 APPLICATIONS WITHDRAWN 0 $0 FILES CLOSED FOR INCOMPLETENESS 0 $0
Detailed PMIC statistics for the following Tracts:
0102.00
Most common first names in Valley Center, KS among deceased individuals Name Count Lived (average)
James 32 71.8 years Mary 30 82.1 years John 25 74.3 years Charles 23 74.1 years George 19 79.3 years William 17 78.4 years Ruth 16 80.8 years Dorothy 15 79.1 years Robert 14 70.5 years Frank 11 80.8 years
Most common last names in Valley Center, KS among deceased individuals Last name Count Lived (average)
Miller 26 77.3 years Wilson 14 80.8 years Brown 13 74.4 years Jones 13 73.9 years Wright 13 80.8 years Smith 11 80.7 years Thompson 9 79.5 years Berry 9 81.3 years Johnson 8 76.6 years Lewis 8 81.6 years
Valley Center compared to Kansas state average:
Unemployed percentage significantly below state average. Black race population percentage significantly below state average. Foreign-born population percentage below state average. Renting percentage below state average. Length of stay since moving in significantly above state average. Percentage of population with a bachelor's degree or higher above state average. Valley Center on our top lists :
#52 on the list of "Top 101 cities with the largest percentage of people in other nonhousehold living situations (population 1,000+)"
#28 on the list of "Top 101 counties with the highest carbon monoxide air pollution readings in 2012 (ppm)"
#44 on the list of "Top 101 counties with the highest number of infant deaths per 1000 residents 2007-2013 (pop. 50,000+)"
#45 on the list of "Top 101 counties with the highest number of births per 1000 residents 2007-2013"
#55 on the list of "Top 101 counties with the highest Particulate Matter (PM10 ) Annual air pollution readings in 2012 (µg/m3 )"
#57 on the list of "Top 101 counties with the highest Nitrogen Dioxide air pollution readings in 2012 (ppm)"
Top Patent Applicants
Robert A. Matousek (14)
Darran Matthew Headley (7)
Daniel D. Rohrback (6)
Matthew L. Brunett (4)
Robert P. Barden (4)
Lyle Suhr (3)
John Trevor Bailey (3)
Derek J. Vote (3)
Timothy J. Malone (2)
Paul L. Riemann (2)
Total of 68 patent applications in 2008-2024.


 Recent articles from our blog. Our writers, many of them Ph.D. graduates or candidates, create easy-to-read articles on a wide variety of topics.

 (9.9 miles
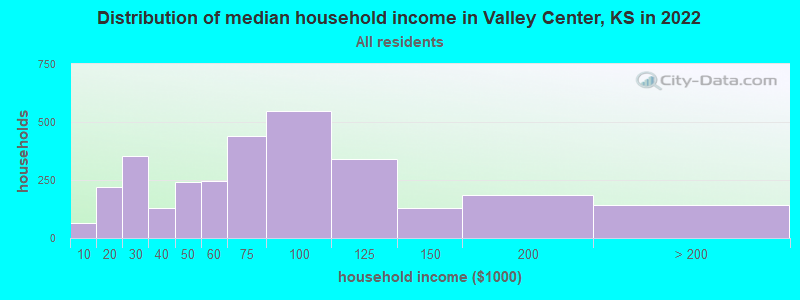


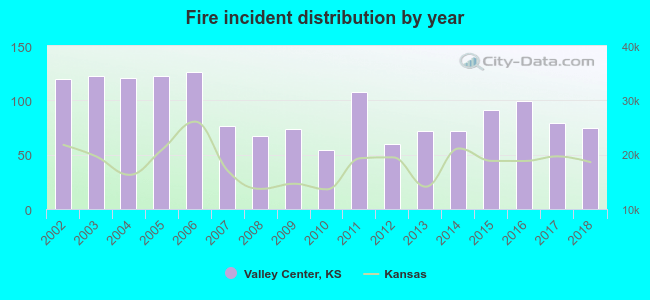 According to the data from the years 2002 - 2018 the average number of fire incidents per year is 90. The highest number of reported fires - 126 took place in 2006, and the least - 54 in 2010. The data has a declining trend.
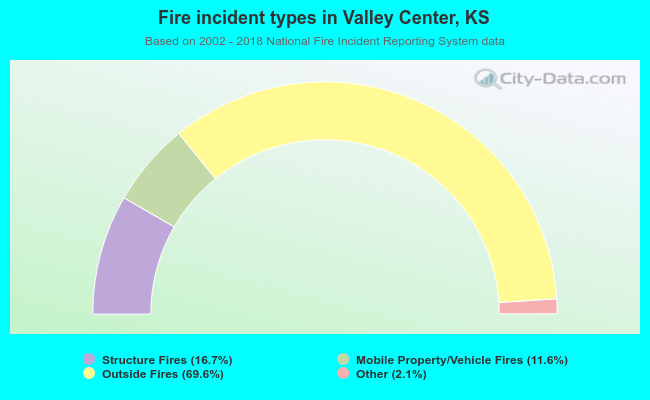 When looking into fire subcategories, the most reports belonged to: Outside Fires (69.6%), and Structure Fires (16.7%).