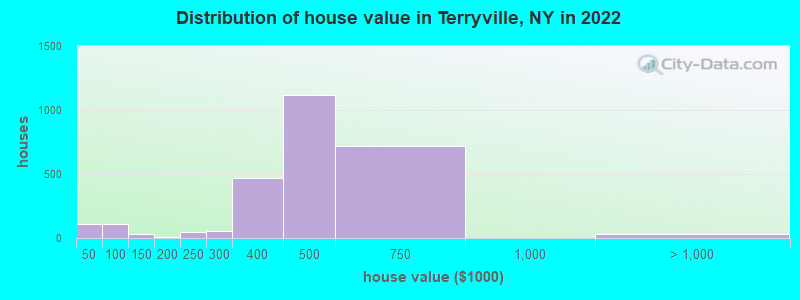
Estimated median house or condo value in 2022: $483,881 (it was $165,700 in 2000)
Terryville:
$483,881
NY:
$400,400
Mean prices in 2022:all housing units: $648,309; detached houses: $664,885; townhouses or other attached units: $541,828; in 2-unit structures: $735,387; in 3-to-4-unit structures: $523,799; in 5-or-more-unit structures: $413,065; mobile homes: $230,025
Median gross rent in 2022: $2,161.
March 2022 cost of living index in Terryville: 149.7 (very high, U.S. average is 100)
Percentage of residents living in poverty in 2022: 2.3%
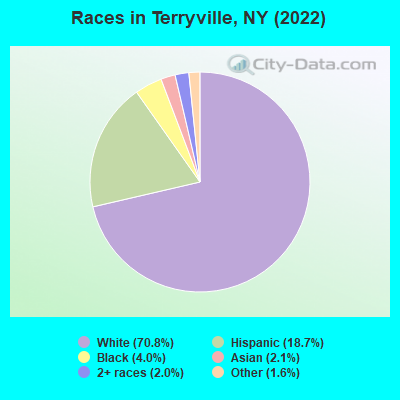
(2.8% for White Non-Hispanic residents, 2.4% for Black residents, 0.8% for Hispanic or Latino residents, 0.6% for other race residents, 6.6% for two or more races residents)
Latest news from Terryville, NY collected exclusively by city-data.com from local newspapers, TV, and radio stations
Ancestries: Italian (24.8%), American (11.6%), Irish (6.4%), German (3.1%), Turkish (2.5%), Greek (1.6%).
Current Local Time: EST time zone
Elevation: 154 feet
Land area: 3.21 square miles.
Population density: 3,688 people per square mile (average).
1,273 residents are foreign born (5.4% Latin America, 2.4% Europe, 2.0% Asia, 1.5% North America).
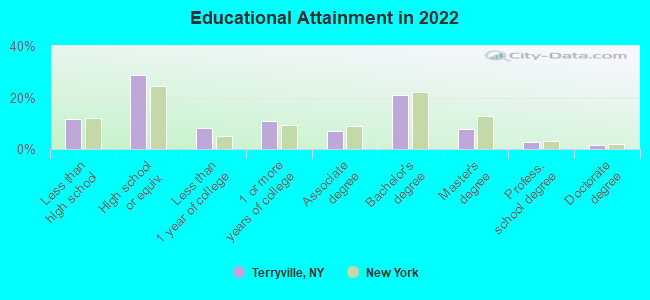
This place:
11.7%
New York:
22.6%
Median real estate property taxes paid for housing units with mortgages in 2022: $10,001 (2.0%) Median real estate property taxes paid for housing units with no mortgage in 2022: $9,738 (2.2%)
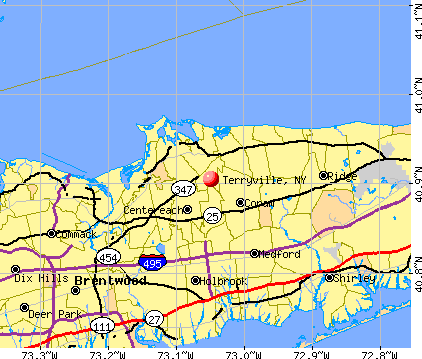
Nearest city with pop. 50,000+: Brentwood, NY (13.3 miles , pop. 53,917).
Nearest city with pop. 200,000+: North Hempstead, NY (33.5 miles , pop. 222,611).
Nearest city with pop. 1,000,000+: Queens, NY (42.5 miles , pop. 2,229,379).
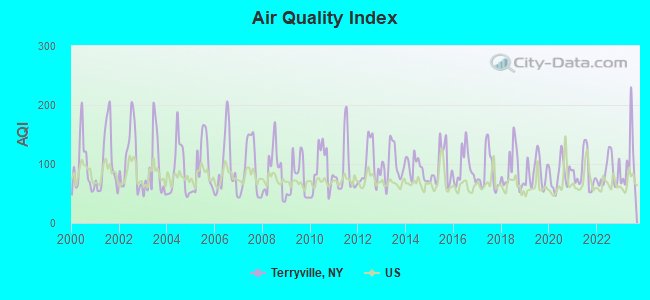
Air Quality Index (AQI) level in 2023 was 101. This is worse than average.
City:
101
U.S.:
73
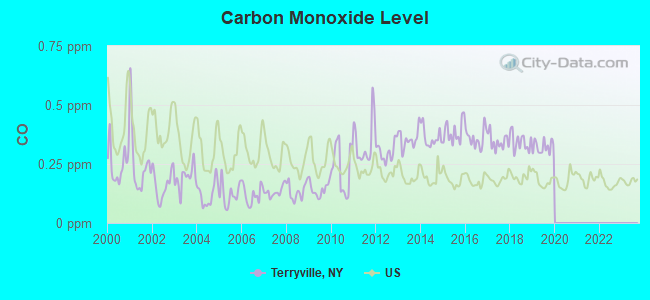
Carbon Monoxide (CO) [ppm] level in 2019 was 0.322. This is worse than average.Closest monitor was 5.4 miles away from the city center.
City:
0.322
U.S.:
0.251
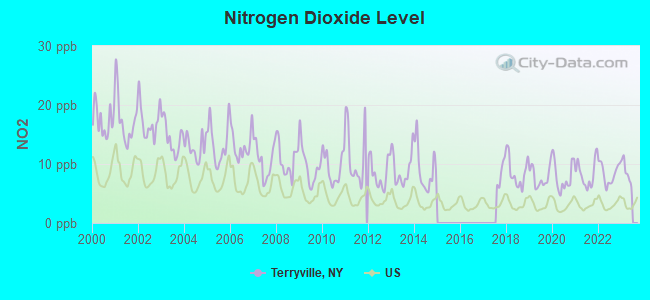
Nitrogen Dioxide (NO2) [ppb] level in 2022 was 8.39. This is significantly worse than average.Closest monitor was 5.4 miles away from the city center.
City:
8.39
U.S.:
5.11
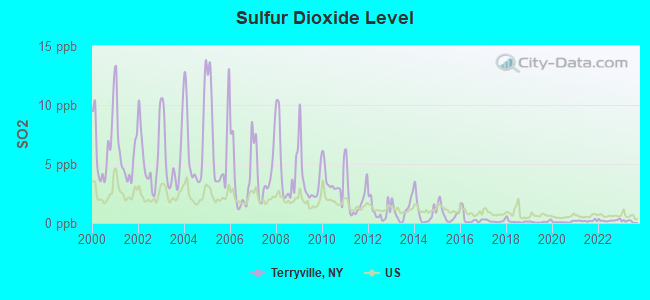
Sulfur Dioxide (SO2) [ppb] level in 2022 was 0.221. This is significantly better than average.Closest monitor was 1.9 miles away from the city center.
City:
0.221
U.S.:
1.515
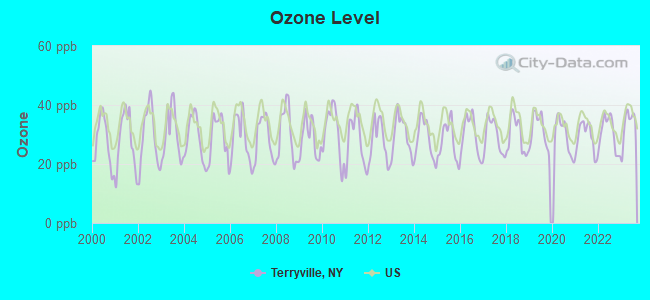
Ozone [ppb] level in 2023 was 33.5. This is about average.Closest monitor was 4.2 miles away from the city center.
City:
33.5
U.S.:
33.3
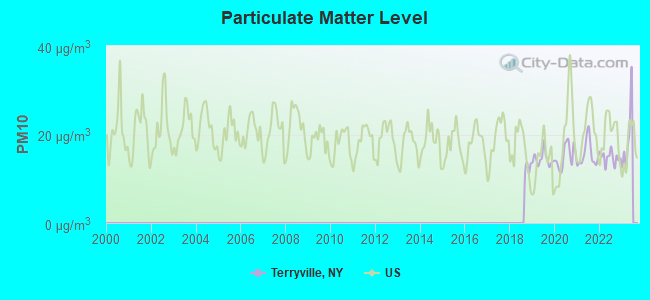
Particulate Matter (PM10) [µg/m3] level in 2022 was 14.8. This is better than average.Closest monitor was 19.9 miles away from the city center.
City:
14.8
U.S.:
19.2
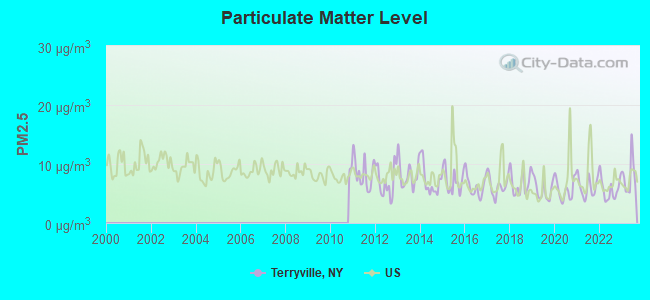
Particulate Matter (PM2.5) [µg/m3] level in 2023 was 7.94. This is about average.Closest monitor was 19.9 miles away from the city center.
City:
7.94
U.S.:
8.11
Tornado activity:
Terryville-area historical tornado activity is slightly above New York state average. It is 57% smaller than the overall U.S. average.
On 7/10/1989, a category F4 (max. wind speeds 207-260 mph) tornado 29.5 miles away from the Terryville place center injured 40 peopleand causedbetween $50,000,000 and $500,000,000 in damages.
On 7/10/1989, a category F2 (max. wind speeds 113-157 mph) tornado 15.2 miles away from the place center injured one person.
Earthquake activity:
Terryville-area historical earthquake activity is significantly above New York state average. It is 71% smaller than the overall U.S. average.
On 10/7/1983 at 10:18:46, a magnitude 5.3 (5.1 MB, 5.3 LG, 5.1 ML, Class: Moderate, Intensity: VI - VII) earthquake occurred 220.9 miles away from Terryville center On 8/23/2011 at 17:51:04, a magnitude 5.8 (5.8 MW, Depth: 3.7 mi) earthquake occurred 333.3 miles away from the city center On 4/20/2002 at 10:50:47, a magnitude 5.3 (5.3 ML, Depth: 3.0 mi) earthquake occurred 251.7 miles away from the city center On 4/20/2002 at 10:50:47, a magnitude 5.2 (5.2 MB, 4.2 MS, 5.2 MW, 5.0 MW) earthquake occurred 250.1 miles away from Terryville center On 8/22/1992 at 12:20:32, a magnitude 4.8 (4.8 MB, 3.8 MS, 4.7 LG, Depth: 6.2 mi, Class: Light, Intensity: IV - V) earthquake occurred 190.8 miles away from the city center On 1/16/1994 at 01:49:16, a magnitude 4.6 (4.6 MB, 4.6 LG, Depth: 3.1 mi) earthquake occurred 161.9 miles away from the city center Magnitude types: regional Lg-wave magnitude (LG), body-wave magnitude (MB), local magnitude (ML), surface-wave magnitude (MS), moment magnitude (MW)
Natural disasters:
The number of natural disasters in Suffolk County (28) is a lot greater than the US average (15). Major Disasters (Presidential) Declared: 19 Emergencies Declared: 7
Causes of natural disasters: Hurricanes: 9, Floods: 7, Storms: 7, Snowstorms: 4, Winter Storms: 3, Blizzards: 2, Heavy Rain: 1, Power Outage: 1, Tropical Depression: 1, Tropical Storm: 1, Water Shortage: 1, Other: 3 (Note: some incidents may be assigned to more than one category).
Hospitals and medical centers near Terryville:
GOOD SHEPHERD HOSPICE (Hospital, about 2 miles away; PORT JEFFERSON STATI, NY)
FMS-CENTRAL SUFFOLK AKC (Dialysis Facility, about 2 miles away; PT.JEFFERSN STATION, NY)
WOODHAVEN NURSING HOME (Nursing Home, about 2 miles away; PORT JEFFERSON STATI, NY)
STONY BROOK KIDNEY CENTER, DCI (Dialysis Facility, about 3 miles away; EAST SETAUKET, NY)
SUNREST MANOR HRF (Nursing Home, about 3 miles away; PORT JEFFERSON, NY)
PORT JEFFERSON HEALTH CARE FACILITY (Nursing Home, about 3 miles away; PORT JEFFERSON, NY)
SUNREST HEALTH FACILITIES INC (Nursing Home, about 3 miles away; PORT JEFFERSON, NY)
Colleges/universities with over 2000 students nearest to Terryville:
Suffolk County Community College (about 4 miles; Selden, NY; Full-time enrollment: 18,540)
Stony Brook University (about 4 miles; Stony Brook, NY; FT enrollment: 22,071)
Dowling College (about 13 miles; Oakdale, NY; FT enrollment: 2,598)
Porter and Chester Institute of Stratford (about 20 miles; Stratford, CT; FT enrollment: 2,822)
University of Bridgeport (about 20 miles; Bridgeport, CT; FT enrollment: 3,708)
Housatonic Community College (about 21 miles; Bridgeport, CT; FT enrollment: 3,677)
Fairfield University (about 21 miles; Fairfield, CT; FT enrollment: 4,640)
Churches in Terryville include: Calvary Baptist Church (A), Open Door Vineyard Christian Fellowship (B), The Church of Jesus Christ of Latter Day Saints (C), True North Community Church (D), Christ United Methodist Church (E). Display/hide their locations on the map
Suffolk County has a predicted average indoor radon screening level less than 2 pCi/L (pico curies per liter) - Low Potential
Average household size:
This place:
3.1 people
New York:
2.6 people
Percentage of family households:
This place:
77.7%
Whole state:
63.5%
Percentage of households with unmarried partners:
This place:
4.7%
Whole state:
6.8%
Likely homosexual households (counted as self-reported same-sex unmarried-partner households)
Lesbian couples: 0.5% of all households
Gay men: 0.1% of all households
People in group quarters in Terryville in 2010:
32 people in other noninstitutional facilities
27 people in group homes intended for adults
16 people in emergency and transitional shelters (with sleeping facilities) for people experiencing homelessness
10 people in group homes for juveniles (non-correctional)
People in group quarters in Terryville in 2000:
23 people in homes for the mentally retarded
14 people in other noninstitutional group quarters
Religion statistics for Terryville, NY (based on Suffolk County data)
Religion
Adherents
Congregations
Catholic
879,457
75
Mainline Protestant
69,205
182
Evangelical Protestant
58,909
264
Other
50,771
124
Orthodox
10,190
10
Black Protestant
8,298
49
None
416,520
-
Source: Clifford Grammich, Kirk Hadaway, Richard Houseal, Dale E.Jones, Alexei Krindatch, Richie Stanley and Richard H.Taylor. 2012. 2010 U.S.Religion Census: Religious Congregations & Membership Study. Association of Statisticians of American Religious Bodies. Jones, Dale E., et al. 2002. Congregations and Membership in the United States 2000. Nashville, TN: Glenmary Research Center. Graphs represent county-level data
Jayne Blvd N Of Whitman Ave (Lat: 40.916667 Lon: -73.049444), Type: 48.0, Overall height: 48 m, Registrant: Suffolk County Water Authority, Oakda-le, Phone: (516) 589-5200
FCC Registered Broadcast Land Mobile Towers:
1
24 Rush St (Lat: 40.904833 Lon: -73.055111), Call Sign: WXH648, Licensee ID: L00082879, Assigned Frequencies: 154.515 MHz, Grant Date: 04/27/1998, Expiration Date: 06/13/2003, Cancellation Date: 09/07/2003, Registrant: Michael Weber, 24 Rush St, Terryville, NY 11776
FCC Registered Amateur Radio Licenses:
4
Call Sign: KB2FYG, Grant Date: 06/14/1988, Expiration Date: 06/14/1998, Cancellation Date: 06/15/2000, Registrant: Michael K Tong, 44 Kool Pl, Terryville, NY 11776
Call Sign: N2XGQ, Licensee ID: L00082879, Grant Date: 10/25/2013, Expiration Date: 12/14/2023, Cancellation Date: 11/01/2016, Certifier: Michael Weber, Registrant: Michael Weber, 24 Rush St, Terryville, NY 11776
Call Sign: N2XMX, Previous Call Sign: KB2HXD, Grant Date: 12/21/1993, Expiration Date: 12/21/2003, Cancellation Date: 12/22/2005, Registrant: Janine C Lotten, 38 Ontario St, Terryville, NY 11776
Call Sign: W2TFD, Previous Call Sign: N2XGQ, Licensee ID: L00082879, Grant Date: 11/01/2016, Expiration Date: 11/01/2026, Certifier: Michael Weber, Registrant: Michael Weber, 24 Rush St, Terryville, NY 11776
Home Mortgage Disclosure Act Aggregated Statistics For Year 2009 (Based on 2 full tracts)
A) FHA, FSA/RHS & VA Home Purchase Loans
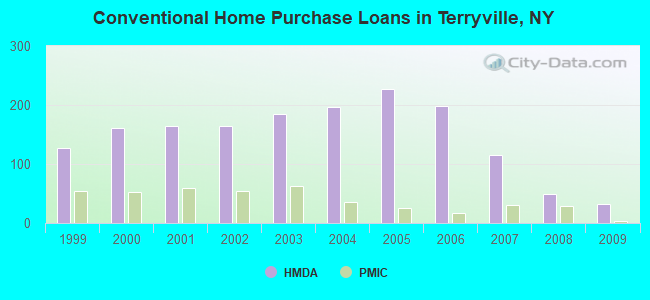
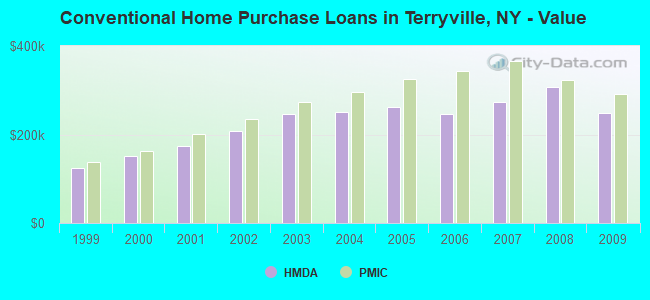
B) Conventional Home Purchase Loans
C) Refinancings
D) Home Improvement Loans
F) Non-occupant Loans on < 5 Family Dwellings (A B C & D)
Number
Average Value
Number
Average Value
Number
Average Value
Number
Average Value
Number
Average Value
LOANS ORIGINATED
36
$305,500
32
$249,375
110
$233,200
11
$185,727
5
$352,200
APPLICATIONS APPROVED, NOT ACCEPTED
5
$276,000
4
$161,500
16
$231,250
4
$139,000
1
$182,000
APPLICATIONS DENIED
5
$306,800
5
$259,400
51
$272,902
11
$53,455
0
$0
APPLICATIONS WITHDRAWN
7
$301,286
6
$226,667
45
$256,244
2
$97,500
3
$207,000
FILES CLOSED FOR INCOMPLETENESS
2
$282,000
0
$0
14
$273,214
2
$12,500
1
$342,000
Aggregated Statistics For Year 2008 (Based on 2 full tracts)
A) FHA, FSA/RHS & VA Home Purchase Loans
B) Conventional Home Purchase Loans
C) Refinancings
D) Home Improvement Loans
F) Non-occupant Loans on < 5 Family Dwellings (A B C & D)
Number
Average Value
Number
Average Value
Number
Average Value
Number
Average Value
Number
Average Value
LOANS ORIGINATED
21
$314,952
50
$307,760
71
$232,282
21
$108,476
8
$266,875
APPLICATIONS APPROVED, NOT ACCEPTED
2
$336,000
10
$255,700
28
$212,750
2
$17,000
3
$229,333
APPLICATIONS DENIED
3
$328,667
15
$301,467
72
$288,764
14
$58,143
3
$317,667
APPLICATIONS WITHDRAWN
2
$394,000
6
$337,500
25
$252,360
9
$163,556
1
$65,000
FILES CLOSED FOR INCOMPLETENESS
0
$0
4
$222,500
15
$281,933
1
$350,000
2
$171,000
Aggregated Statistics For Year 2007 (Based on 2 full tracts)
A) FHA, FSA/RHS & VA Home Purchase Loans
B) Conventional Home Purchase Loans
C) Refinancings
D) Home Improvement Loans
F) Non-occupant Loans on < 5 Family Dwellings (A B C & D)
Number
Average Value
Number
Average Value
Number
Average Value
Number
Average Value
Number
Average Value
LOANS ORIGINATED
2
$333,000
115
$273,009
167
$241,317
38
$94,526
15
$244,867
APPLICATIONS APPROVED, NOT ACCEPTED
0
$0
19
$247,158
45
$262,911
16
$86,625
4
$296,000
APPLICATIONS DENIED
2
$349,500
39
$288,333
161
$276,068
31
$97,355
11
$283,818
APPLICATIONS WITHDRAWN
0
$0
16
$285,000
62
$286,048
9
$192,556
3
$290,667
FILES CLOSED FOR INCOMPLETENESS
0
$0
5
$292,000
21
$275,286
2
$50,000
1
$178,000
Aggregated Statistics For Year 2006 (Based on 2 full tracts)
A) FHA, FSA/RHS & VA Home Purchase Loans
B) Conventional Home Purchase Loans
C) Refinancings
D) Home Improvement Loans
F) Non-occupant Loans on < 5 Family Dwellings (A B C & D)
G) Loans On Manufactured Home Dwelling (A B C & D)
Number
Average Value
Number
Average Value
Number
Average Value
Number
Average Value
Number
Average Value
Number
Average Value
LOANS ORIGINATED
1
$364,000
199
$246,075
270
$225,741
46
$95,130
15
$264,733
0
$0
APPLICATIONS APPROVED, NOT ACCEPTED
0
$0
46
$223,217
60
$242,300
10
$44,900
4
$251,750
0
$0
APPLICATIONS DENIED
0
$0
77
$242,506
143
$281,937
28
$106,250
17
$222,529
1
$260,000
APPLICATIONS WITHDRAWN
0
$0
38
$231,895
99
$227,778
9
$80,000
3
$156,333
0
$0
FILES CLOSED FOR INCOMPLETENESS
0
$0
9
$192,778
42
$258,548
1
$210,000
3
$152,667
0
$0
Aggregated Statistics For Year 2005 (Based on 2 full tracts)
B) Conventional Home Purchase Loans
C) Refinancings
D) Home Improvement Loans
F) Non-occupant Loans on < 5 Family Dwellings (A B C & D)
G) Loans On Manufactured Home Dwelling (A B C & D)
Number
Average Value
Number
Average Value
Number
Average Value
Number
Average Value
Number
Average Value
LOANS ORIGINATED
227
$261,441
339
$223,708
42
$99,405
24
$260,917
2
$9,000
APPLICATIONS APPROVED, NOT ACCEPTED
26
$211,692
43
$221,186
15
$47,467
4
$187,000
0
$0
APPLICATIONS DENIED
60
$243,700
169
$258,834
41
$159,634
8
$206,750
0
$0
APPLICATIONS WITHDRAWN
35
$261,743
159
$231,767
25
$159,600
9
$238,667
0
$0
FILES CLOSED FOR INCOMPLETENESS
6
$299,667
71
$271,408
5
$60,000
2
$281,500
0
$0
Aggregated Statistics For Year 2004 (Based on 2 full tracts)
A) FHA, FSA/RHS & VA Home Purchase Loans
B) Conventional Home Purchase Loans
C) Refinancings
D) Home Improvement Loans
E) Loans on Dwellings For 5+ Families
F) Non-occupant Loans on < 5 Family Dwellings (A B C & D)
G) Loans On Manufactured Home Dwelling (A B C & D)
Number
Average Value
Number
Average Value
Number
Average Value
Number
Average Value
Number
Average Value
Number
Average Value
Number
Average Value
LOANS ORIGINATED
5
$270,800
196
$250,556
395
$204,284
63
$72,127
0
$0
15
$258,200
2
$77,500
APPLICATIONS APPROVED, NOT ACCEPTED
0
$0
31
$278,839
71
$208,972
11
$86,091
0
$0
1
$170,000
0
$0
APPLICATIONS DENIED
0
$0
37
$243,378
163
$229,233
42
$96,238
1
$245,000
7
$205,571
0
$0
APPLICATIONS WITHDRAWN
1
$222,000
37
$268,297
123
$210,407
12
$85,417
0
$0
11
$214,000
0
$0
FILES CLOSED FOR INCOMPLETENESS
1
$257,000
19
$233,579
86
$252,744
4
$144,750
0
$0
2
$135,500
0
$0
Aggregated Statistics For Year 2003 (Based on 2 full tracts)
A) FHA, FSA/RHS & VA Home Purchase Loans
B) Conventional Home Purchase Loans
C) Refinancings
D) Home Improvement Loans
F) Non-occupant Loans on < 5 Family Dwellings (A B C & D)
Number
Average Value
Number
Average Value
Number
Average Value
Number
Average Value
Number
Average Value
LOANS ORIGINATED
12
$282,667
184
$245,560
728
$176,345
36
$51,667
15
$178,333
APPLICATIONS APPROVED, NOT ACCEPTED
0
$0
26
$265,038
117
$179,590
9
$37,667
3
$180,000
APPLICATIONS DENIED
1
$284,000
27
$243,815
211
$177,142
39
$43,615
5
$192,200
APPLICATIONS WITHDRAWN
2
$203,500
16
$271,625
178
$184,567
12
$33,667
4
$214,000
FILES CLOSED FOR INCOMPLETENESS
0
$0
8
$265,250
36
$171,472
1
$65,000
0
$0
Aggregated Statistics For Year 2002 (Based on 2 full tracts)
A) FHA, FSA/RHS & VA Home Purchase Loans
B) Conventional Home Purchase Loans
C) Refinancings
D) Home Improvement Loans
F) Non-occupant Loans on < 5 Family Dwellings (A B C & D)
Number
Average Value
Number
Average Value
Number
Average Value
Number
Average Value
Number
Average Value
LOANS ORIGINATED
14
$223,214
164
$208,396
468
$155,910
70
$33,700
13
$182,923
APPLICATIONS APPROVED, NOT ACCEPTED
0
$0
29
$183,724
115
$154,791
29
$36,690
4
$115,000
APPLICATIONS DENIED
3
$217,000
25
$212,680
184
$163,701
47
$42,979
4
$125,750
APPLICATIONS WITHDRAWN
5
$206,800
11
$191,182
151
$154,172
25
$36,400
2
$141,000
FILES CLOSED FOR INCOMPLETENESS
2
$224,500
8
$249,875
55
$153,745
1
$30,000
2
$85,000
Aggregated Statistics For Year 2001 (Based on 2 full tracts)
A) FHA, FSA/RHS & VA Home Purchase Loans
B) Conventional Home Purchase Loans
C) Refinancings
D) Home Improvement Loans
F) Non-occupant Loans on < 5 Family Dwellings (A B C & D)
Number
Average Value
Number
Average Value
Number
Average Value
Number
Average Value
Number
Average Value
LOANS ORIGINATED
31
$184,161
165
$174,600
395
$143,580
55
$36,873
14
$134,071
APPLICATIONS APPROVED, NOT ACCEPTED
0
$0
16
$178,375
68
$115,412
18
$29,056
2
$71,500
APPLICATIONS DENIED
2
$100,500
30
$175,333
143
$139,846
35
$40,000
4
$105,500
APPLICATIONS WITHDRAWN
3
$178,333
20
$183,400
119
$138,092
33
$36,121
5
$120,400
FILES CLOSED FOR INCOMPLETENESS
0
$0
6
$193,167
24
$126,875
4
$45,000
1
$179,000
Aggregated Statistics For Year 2000 (Based on 2 full tracts)
A) FHA, FSA/RHS & VA Home Purchase Loans
B) Conventional Home Purchase Loans
C) Refinancings
D) Home Improvement Loans
E) Loans on Dwellings For 5+ Families
F) Non-occupant Loans on < 5 Family Dwellings (A B C & D)
Number
Average Value
Number
Average Value
Number
Average Value
Number
Average Value
Number
Average Value
Number
Average Value
LOANS ORIGINATED
22
$161,773
161
$151,317
105
$97,838
58
$26,224
1
$35,000
6
$113,333
APPLICATIONS APPROVED, NOT ACCEPTED
3
$194,000
18
$137,500
37
$80,162
19
$36,211
0
$0
2
$57,000
APPLICATIONS DENIED
7
$164,857
26
$136,846
80
$103,425
33
$32,121
0
$0
6
$144,167
APPLICATIONS WITHDRAWN
7
$166,857
14
$158,786
103
$88,689
9
$34,889
0
$0
1
$35,000
FILES CLOSED FOR INCOMPLETENESS
1
$165,000
4
$165,250
12
$108,417
1
$23,000
0
$0
0
$0
Aggregated Statistics For Year 1999 (Based on 1 full and 1 partial tracts)
A) FHA, FSA/RHS & VA Home Purchase Loans
B) Conventional Home Purchase Loans
C) Refinancings
D) Home Improvement Loans
F) Non-occupant Loans on < 5 Family Dwellings (A B C & D)


 Recent articles from our blog. Our writers, many of them Ph.D. graduates or candidates, create easy-to-read articles on a wide variety of topics.

 (13.3 miles