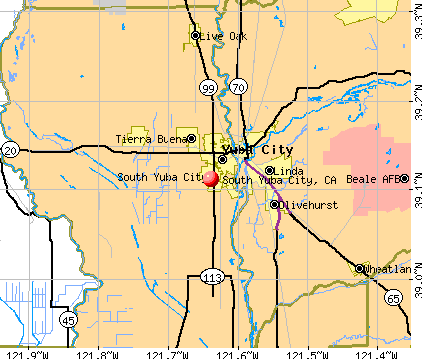
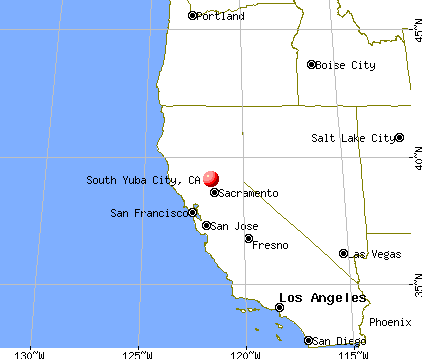
South Yuba City, California
South Yuba City: South Yuba City N99 and Barry area
South Yuba City: Yuba River
South Yuba City: Iris in the Morning South Yuba City
South Yuba City: Snow in Yuba City, CA a very rare occurence about every ten years
- add
your


Submit your own pictures of this place and show them to the world
- OSM Map
- General Map
- Google Map
- MSN Map
| Males: 7,198 | |
| Females: 7,426 |
| Median resident age: | 35.3 years |
| California median age: | 33.3 years |
Zip codes: 95993.
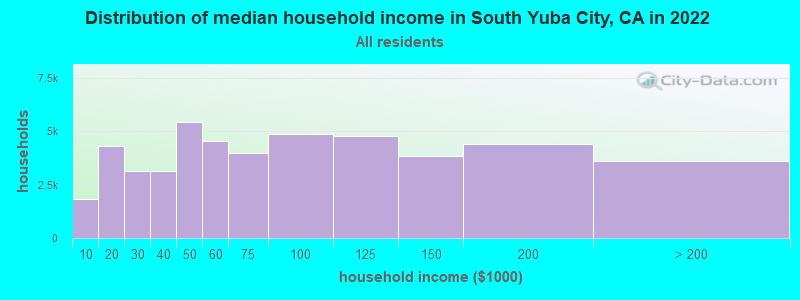
| South Yuba City: | $92,369 |
| CA: | $91,551 |
Estimated per capita income in 2022: $40,332 (it was $21,423 in 2000)
South Yuba City CDP income, earnings, and wages data
Estimated median house or condo value in 2022: $461,275 (it was $127,700 in 2000)
| South Yuba City: | $461,275 |
| CA: | $715,900 |
Mean prices in 2022: all housing units: $477,964; detached houses: $500,791; townhouses or other attached units: $492,332; in 2-unit structures: over $1,000,000; in 3-to-4-unit structures: $172,512; in 5-or-more-unit structures: $165,844; mobile homes: $158,826; occupied boats, rvs, vans, etc.: $69,481
South Yuba City, CA residents, houses, and apartments details
Detailed information about poverty and poor residents in South Yuba City, CA


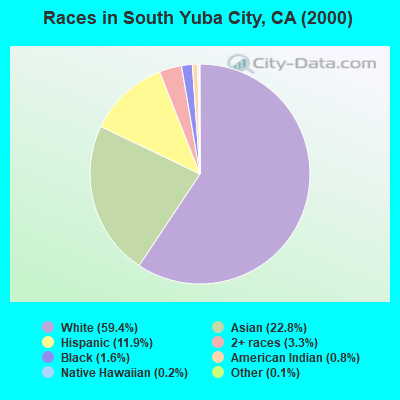
- 7,51559.4%White alone
- 2,88422.8%Asian alone
- 1,50111.9%Hispanic
- 4143.3%Two or more races
- 2001.6%Black alone
- 960.8%American Indian alone
- 280.2%Native Hawaiian and Other
Pacific Islander alone - 130.1%Other race alone
 Recent articles from our blog. Our writers, many of them Ph.D. graduates or candidates, create easy-to-read articles on a wide variety of topics.


 | Weather Thread (478 replies) |
| Half-asian/hapa populations (25 replies) |
| Which one? Folsom, Roseville, Rocklin, Lincoln, Yuba City (40 replies) |
| Best place to live close to Beale AFB (9 replies) |
Latest news from South Yuba City, CA collected exclusively by city-data.com from local newspapers, TV, and radio stations
Ancestries: German (14.2%), English (12.7%), Irish (9.1%), United States (7.3%), Italian (4.3%), French (3.0%).
Current Local Time: PST time zone
Elevation: 53 feet
Land area: 3.24 square miles.
Population density: 4,518 people per square mile (average).
2,531 residents are foreign born (15.6% Asia, 2.6% Latin America).
| This place: | 20.0% |
| California: | 26.2% |
| South Yuba City CDP: | 1.0% ($1,241) |
| California: | 0.8% ($1,564) |
Nearest city with pop. 50,000+: Roseville, CA  (31.2 miles , pop. 79,921).
Nearest city with pop. 200,000+: Sacramento, CA (39.6 miles , pop. 407,018).
Nearest city with pop. 1,000,000+: Los Angeles, CA (391.9 miles , pop. 3,694,820).
Nearest cities:
), ), ), )Latitude: 39.11 N, Longitude: 121.64 W
Daytime population change due to commuting: -4,593 (-36.3%)
Workers who live and work in this place: 353 (6.5%)
Area code commonly used in this area: 530
| Here: | 8.7% |
| California: | 5.1% |
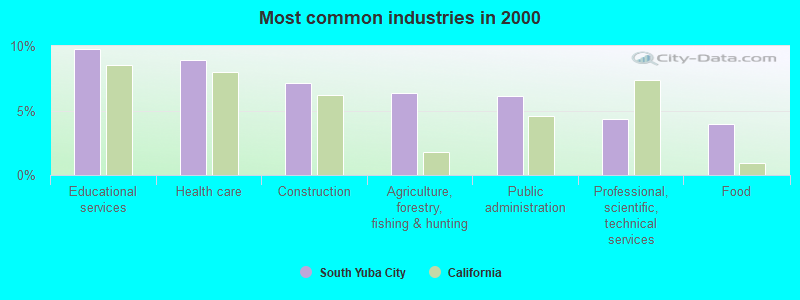
- Educational services (9.8%)
- Health care (8.9%)
- Construction (7.1%)
- Agriculture, forestry, fishing & hunting (6.3%)
- Public administration (6.1%)
- Professional, scientific, technical services (4.3%)
- Food (4.0%)
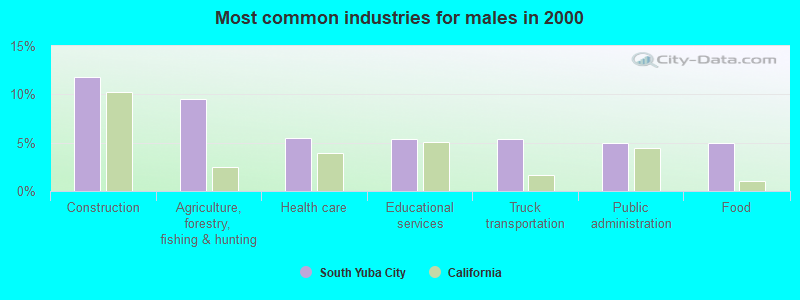
- Construction (11.7%)
- Agriculture, forestry, fishing & hunting (9.5%)
- Health care (5.5%)
- Educational services (5.4%)
- Truck transportation (5.4%)
- Public administration (5.0%)
- Food (4.9%)
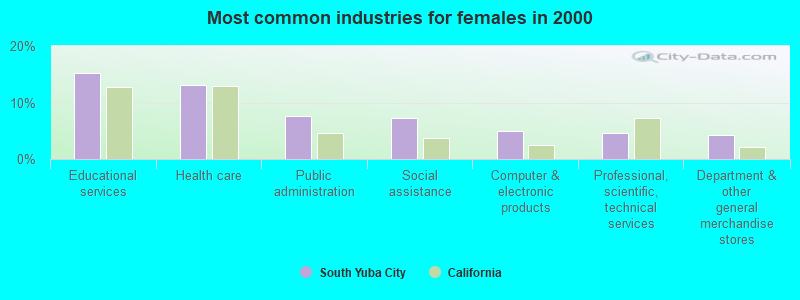
- Educational services (15.2%)
- Health care (13.1%)
- Public administration (7.6%)
- Social assistance (7.3%)
- Computer & electronic products (4.9%)
- Professional, scientific, technical services (4.6%)
- Department & other general merchandise stores (4.3%)
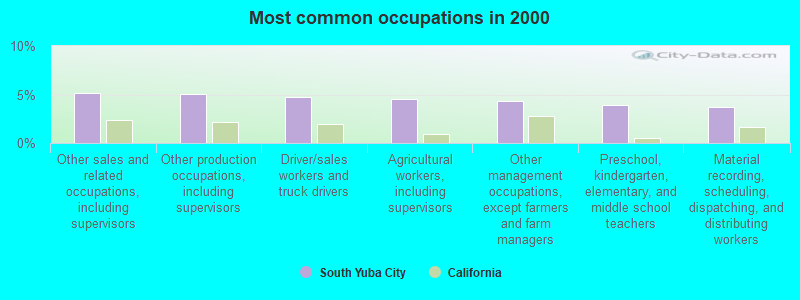
- Other sales and related occupations, including supervisors (5.2%)
- Other production occupations, including supervisors (5.0%)
- Driver/sales workers and truck drivers (4.7%)
- Agricultural workers, including supervisors (4.5%)
- Other management occupations, except farmers and farm managers (4.3%)
- Preschool, kindergarten, elementary, and middle school teachers (3.9%)
- Material recording, scheduling, dispatching, and distributing workers (3.7%)
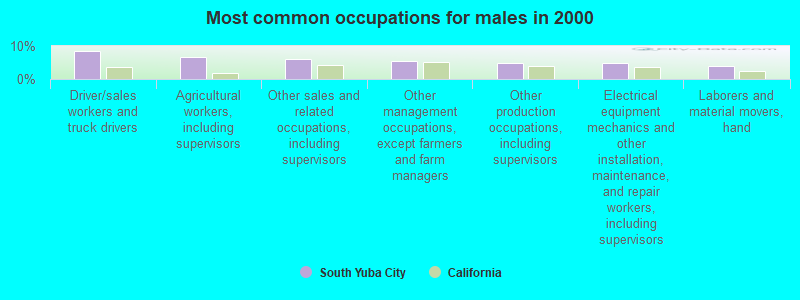
- Driver/sales workers and truck drivers (8.6%)
- Agricultural workers, including supervisors (6.6%)
- Other sales and related occupations, including supervisors (6.1%)
- Other management occupations, except farmers and farm managers (5.4%)
- Other production occupations, including supervisors (4.9%)
- Electrical equipment mechanics and other installation, maintenance, and repair workers, including supervisors (4.8%)
- Laborers and material movers, hand (3.9%)
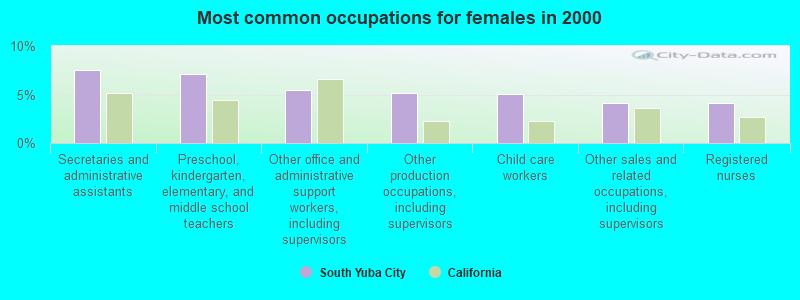
- Secretaries and administrative assistants (7.5%)
- Preschool, kindergarten, elementary, and middle school teachers (7.1%)
- Other office and administrative support workers, including supervisors (5.4%)
- Other production occupations, including supervisors (5.2%)
- Child care workers (5.0%)
- Other sales and related occupations, including supervisors (4.2%)
- Registered nurses (4.1%)
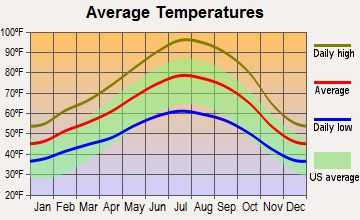
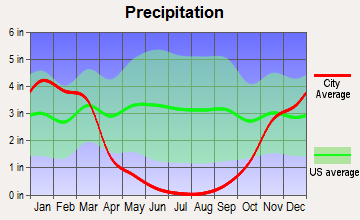
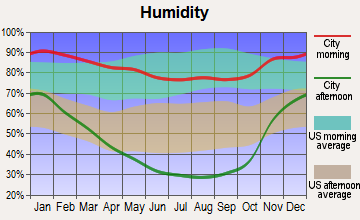
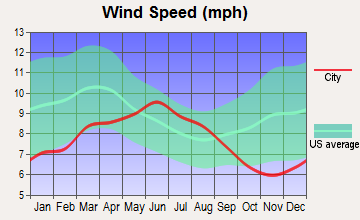
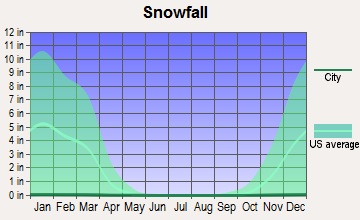
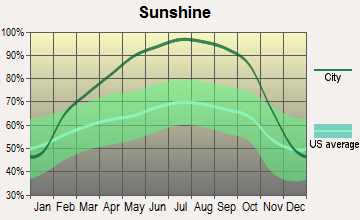
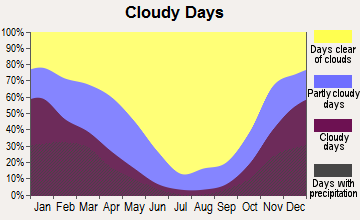
Average climate in South Yuba City, California
Based on data reported by over 4,000 weather stations
(lower is better)
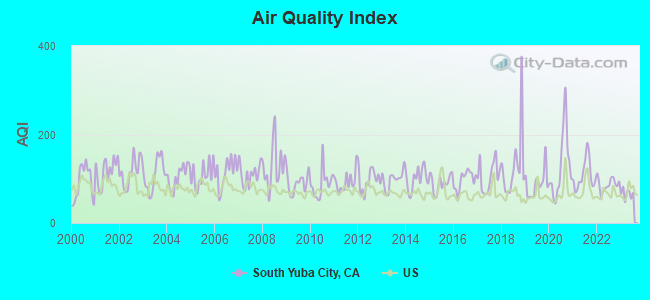
Air Quality Index (AQI) level in 2023 was 66.2. This is about average.
| City: | 66.2 |
| U.S.: | 72.6 |
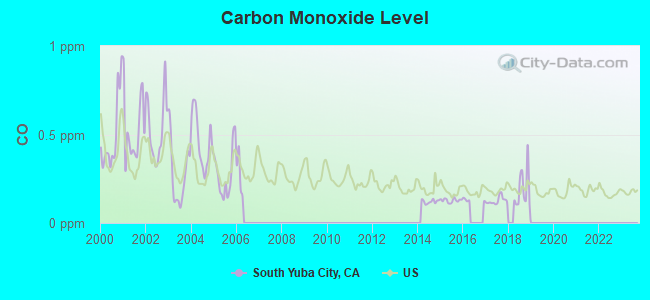
Carbon Monoxide (CO) [ppm] level in 2018 was 0.191. This is better than average. Closest monitor was 1.9 miles away from the city center.
| City: | 0.191 |
| U.S.: | 0.251 |
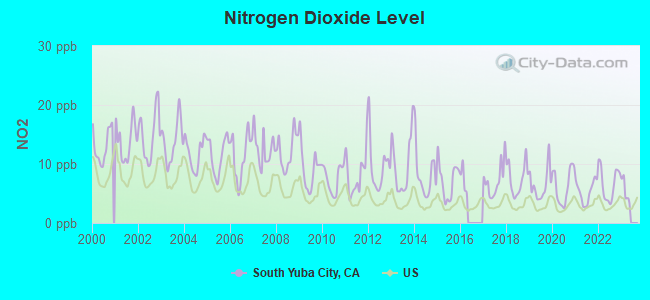
Nitrogen Dioxide (NO2) [ppb] level in 2022 was 6.65. This is worse than average. Closest monitor was 1.9 miles away from the city center.
| City: | 6.65 |
| U.S.: | 5.11 |
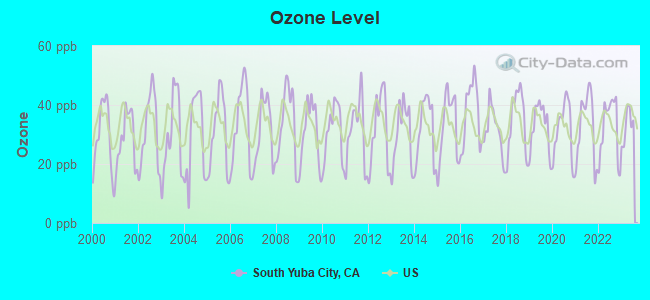
Ozone [ppb] level in 2023 was 32.9. This is about average. Closest monitor was 2.0 miles away from the city center.
| City: | 32.9 |
| U.S.: | 33.3 |
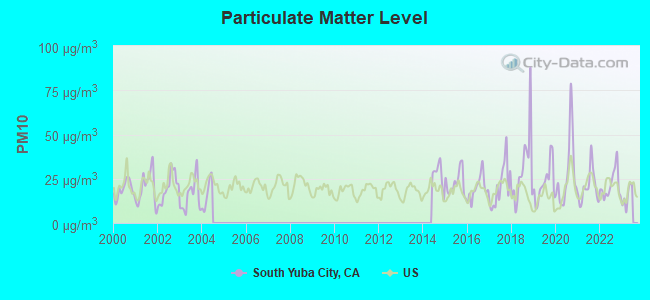
Particulate Matter (PM10) [µg/m3] level in 2022 was 21.5. This is about average. Closest monitor was 2.0 miles away from the city center.
| City: | 21.5 |
| U.S.: | 19.2 |
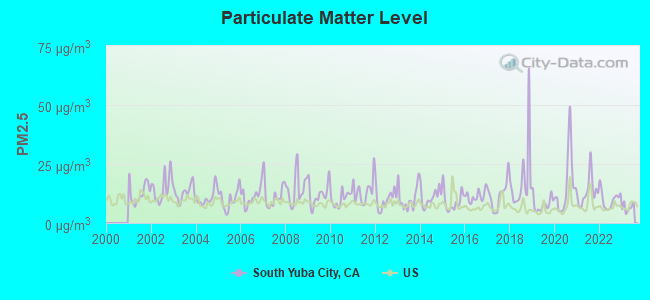
Particulate Matter (PM2.5) [µg/m3] level in 2023 was 6.54. This is better than average. Closest monitor was 2.1 miles away from the city center.
| City: | 6.54 |
| U.S.: | 8.11 |
Earthquake activity:
South Yuba City-area historical earthquake activity is significantly above California state average. It is 7276% greater than the overall U.S. average.On 4/18/1906 at 13:12:21, a magnitude 7.9 (7.9 UK, Class: Major, Intensity: VIII - XII) earthquake occurred 106.5 miles away from the city center, causing $524,000,000 total damage
On 1/31/1922 at 13:17:28, a magnitude 7.6 (7.6 UK) earthquake occurred 234.9 miles away from the city center
On 10/3/1915 at 06:52:48, a magnitude 7.6 (7.6 UK) earthquake occurred 239.9 miles away from South Yuba City center
On 4/25/1992 at 18:06:04, a magnitude 7.2 (6.3 MB, 7.1 MS, 7.2 MW, 7.1 MW, Depth: 9.4 mi) earthquake occurred 155.0 miles away from the city center, causing $75,000,000 total damage
On 10/18/1989 at 00:04:15, a magnitude 7.1 (6.5 MB, 7.1 MS, 6.9 MW, 7.0 ML) earthquake occurred 138.7 miles away from South Yuba City center, causing 62 deaths (62 shaking deaths) and 3757 injuries, causing $1,305,032,704 total damage
On 12/21/1932 at 06:10:09, a magnitude 7.2 (7.2 UK) earthquake occurred 196.1 miles away from South Yuba City center
Magnitude types: body-wave magnitude (MB), local magnitude (ML), surface-wave magnitude (MS), moment magnitude (MW)
Natural disasters:
The number of natural disasters in Sutter County (15) is near the US average (15).Major Disasters (Presidential) Declared: 10
Emergencies Declared: 2
Causes of natural disasters: Floods: 11, Storms: 5, Winter Storms: 5, Landslides: 3, Mudslides: 3, Drought: 1, Freeze: 1, Heavy Rain: 1, Hurricane: 1, Tornado: 1, Other: 1 (Note: some incidents may be assigned to more than one category).
Hospitals and medical centers near South Yuba City:
- SUTTER NORTH HOME HEALTH (Home Health Center, about 2 miles away; YUBA CITY, CA)
- SUTTER SURGICAL HOSPITAL - NORTH VALLEY Acute Care Hospitals (about 2 miles away; YUBA CITY, CA)
- FREMONT-RIDEOUT HOME HEALTH (Home Health Center, about 3 miles away; YUBA CITY, CA)
- SIERRA VISTA ICF/DD (Hospital, about 3 miles away; YUBA CITY, CA)
- SUN RIDGE HOSPITAL (Hospital, about 3 miles away; YUBA CITY, CA)
- FREMONT MEDICAL CENTER (Hospital, about 3 miles away; YUBA CITY, CA)
- FREMONT-RIDEOUT HOME HLTH/VALLEY HOSPICE (Hospital, about 3 miles away; YUBA CITY, CA)
Colleges/universities with over 2000 students nearest to South Yuba City:
- Yuba College (about 6 miles; Marysville, CA; Full-time enrollment: 4,737)
- Sierra College (about 32 miles; Rocklin, CA; FT enrollment: 11,488)
- Universal Technical Institute of Northern California Inc (about 33 miles; Sacramento, CA; FT enrollment: 3,193)
- University of Phoenix-Sacramento Valley Campus (about 35 miles; Sacramento, CA; FT enrollment: 2,855)
- American River College (about 36 miles; Sacramento, CA; FT enrollment: 20,452)
- Butte College (about 38 miles; Oroville, CA; FT enrollment: 8,649)
- University of California-Davis (about 41 miles; Davis, CA; FT enrollment: 30,845)
Points of interest:
Notable location: Yuba City Fire Department Station 4 (A). Display/hide its location on the map
Church in South Yuba City: Franklin Home Site Church (A). Display/hide its location on the map
| This place: | 3.1 people |
| California: | 2.9 people |
| This place: | 83.1% |
| Whole state: | 69.4% |
| This place: | 4.0% |
| Whole state: | 5.9% |
Likely homosexual households (counted as self-reported same-sex unmarried-partner households)
- Lesbian couples: 0.2% of all households
- Gay men: 0.1% of all households
| This place: | 5.8% |
| Whole state: | 14.2% |
| This place: | 2.1% |
| Whole state: | 6.3% |
People in group quarters in South Yuba City in 2000:
- 52 people in mental (psychiatric) hospitals or wards
- 6 people in other nonhousehold living situations
- 6 people in other noninstitutional group quarters
For population 15 years and over in South Yuba City:
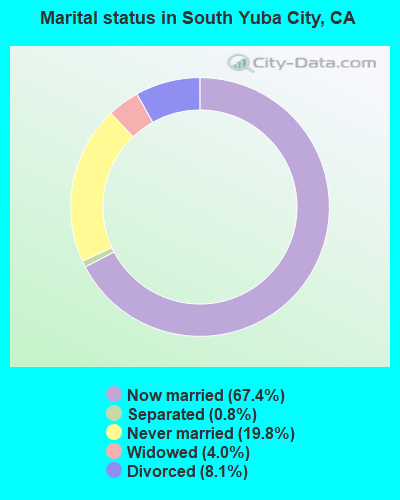
- Never married: 19.8%
- Now married: 67.4%
- Separated: 0.8%
- Widowed: 4.0%
- Divorced: 8.1%
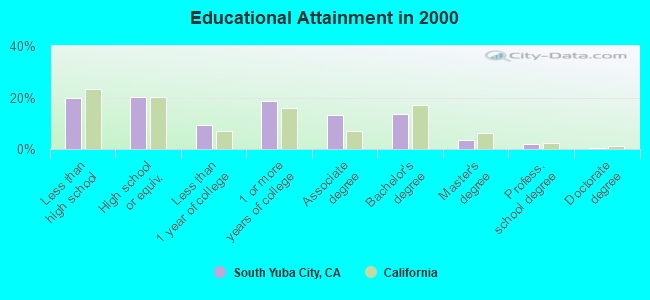
For population 25 years and over in South Yuba City:
- High school or higher: 80.3%
- Bachelor's degree or higher: 19.2%
- Graduate or professional degree: 5.7%
- Unemployed: 8.2%
- Mean travel time to work (commute): 27.5 minutes
| Here: | 13.8 |
| California average: | 16.1 |
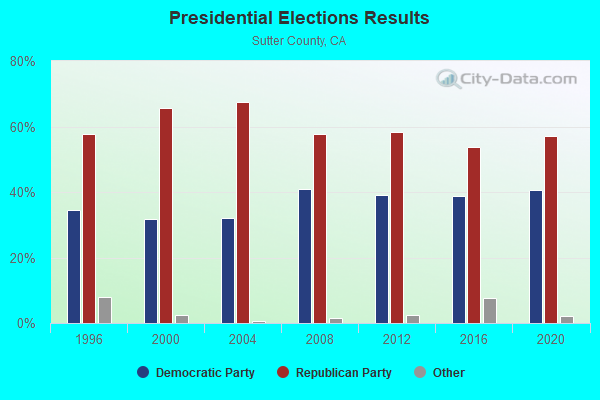
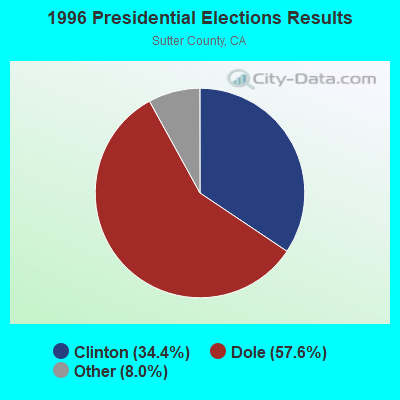
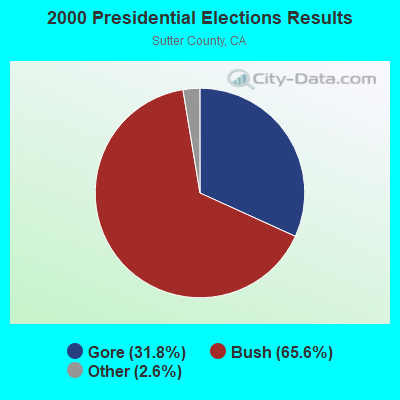
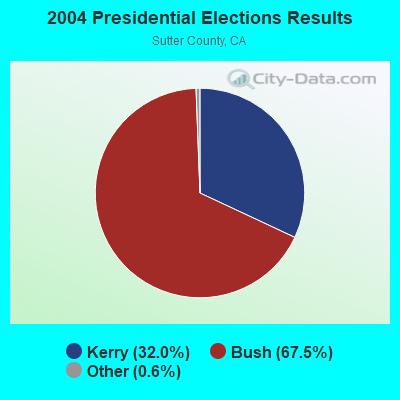
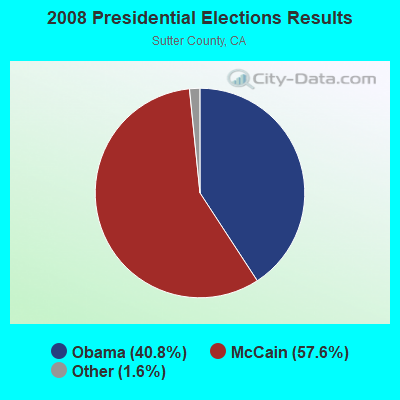
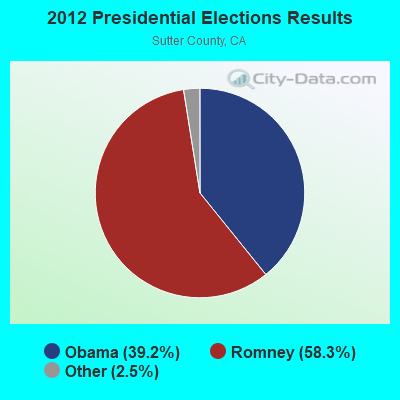
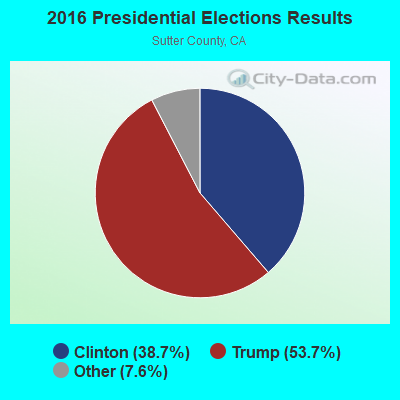
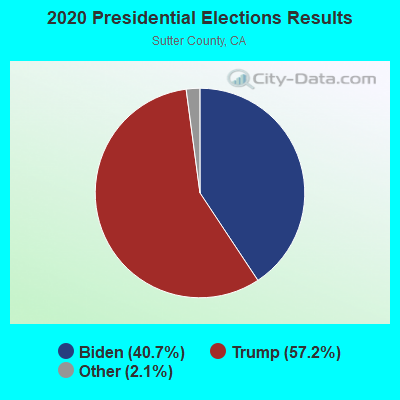
Graphs represent county-level data. Detailed 2008 Election Results
Religion statistics for South Yuba City, CA (based on Sutter County data)
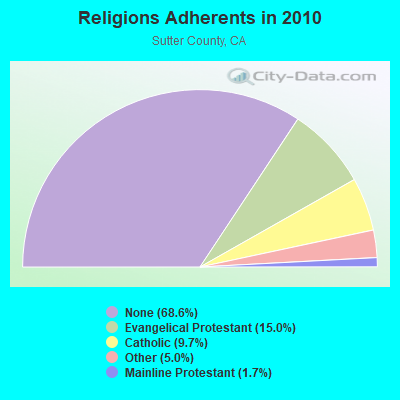
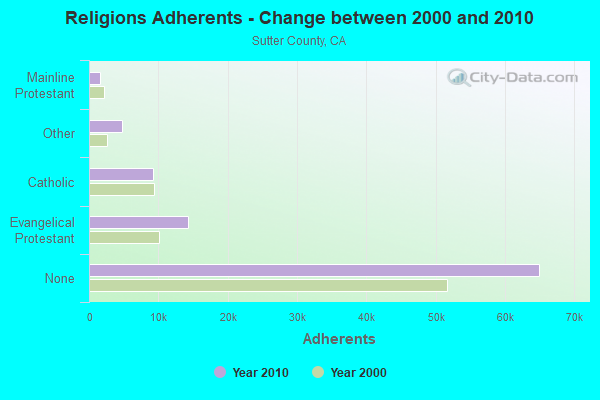
| Religion | Adherents | Congregations |
|---|---|---|
| Evangelical Protestant | 14,212 | 43 |
| Catholic | 9,181 | 3 |
| Other | 4,765 | 17 |
| Mainline Protestant | 1,624 | 7 |
| None | 64,955 | - |
Food Environment Statistics:
| Sutter County: | 2.29 / 10,000 pop. |
| California: | 2.14 / 10,000 pop. |
| Sutter County: | 0.11 / 10,000 pop. |
| California: | 0.04 / 10,000 pop. |
| This county: | 1.42 / 10,000 pop. |
| State: | 0.62 / 10,000 pop. |
| This county: | 2.08 / 10,000 pop. |
| California: | 1.49 / 10,000 pop. |
| Here: | 6.66 / 10,000 pop. |
| State: | 7.42 / 10,000 pop. |
| Here: | 7.4% |
| State: | 7.3% |
| Here: | 24.5% |
| California: | 21.3% |
| This county: | 16.2% |
| State: | 17.9% |
Strongest AM radio stations in South Yuba City:
- KUBA (1600 AM; 5 kW; YUBA CITY, CA; Owner: HARLAN COMMUNICATIONS, INC.)
- KMYC (1410 AM; 5 kW; MARYSVILLE, CA; Owner: THOMAS F. HUTH)
- KOBO (1450 AM; 1 kW; YUBA CITY, CA; Owner: MULTICULTURAL RADIO BROADCASTING INC)
- KFBK (1530 AM; 50 kW; SACRAMENTO, CA; Owner: AMFM RADIO LICENSES, L.L.C.)
- KFIA (710 AM; 25 kW; CARMICHAEL, CA; Owner: VISTA BROADCASTING INC.)
- KSTE (650 AM; 25 kW; RANCHO CORDOVA, CA; Owner: AMFM RADIO LICENSES, L.L.C.)
- KHTK (1140 AM; 50 kW; SACRAMENTO, CA; Owner: INFINITY RADIO SUBSIDIARY OPERATIONS INC.)
- KCBS (740 AM; 50 kW; SAN FRANCISCO, CA; Owner: INFINITY BROADCASTING OPERATIONS, INC.)
- KLIB (1110 AM; 10 kW; ROSEVILLE, CA; Owner: WAY BROADCASTING, INC.)
- KAHI (950 AM; 10 kW; AUBURN, CA; Owner: IHR EDUCATIONAL BROADCASTING)
- KCBC (770 AM; 50 kW; RIVERBANK, CA; Owner: KIERTRON, INC.)
- KTRB (860 AM; 50 kW; MODESTO, CA; Owner: PAPPAS RADIO OF CALIFORNIA, A CALIFORNIA LIMITED PARTNERSHIP)
- KKOH (780 AM; 50 kW; RENO, NV; Owner: CITADEL BROADCASTING COMPANY)
Strongest FM radio stations in South Yuba City:
- KRCX-FM (99.9 FM; MARYSVILLE, CA; Owner: ENTRAVISION HOLDINGS, LLC)
- KMJE (101.5 FM; GRIDLEY, CA; Owner: RESULTS RADIO LICENSEE, LLC)
- K213BZ (90.5 FM; RICHVALE, CA; Owner: FAMILY STATIONS, INC.)
- KXCL (103.9 FM; YUBA CITY, CA; Owner: HARLAN COMMUNICATIONS, INC.)
- KKCY (103.1 FM; COLUSA, CA; Owner: RESULTS RADIO LICENSEE, LLC)
- K258AQ (99.5 FM; YANKEE HILL, CA; Owner: CALVARY CHAPEL OF TWIN FALLS, INC.)
- KYIX (104.9 FM; SOUTH OROVILLE, CA; Owner: BUTTE BROADCASTING COMPANY, INC.)
- KNDL (89.9 FM; ANGWIN, CA; Owner: HOWELL MOUNTAIN BROADCASTING COMPANY)
- KLVR (91.9 FM; SANTA ROSA, CA; Owner: EDUCATIONAL MEDIA FOUNDATION)
- KXTS (100.9 FM; CALISTOGA, CA; Owner: SINCLAIR TELECABLE, INC.)
- KHAP (89.1 FM; CHICO, CA; Owner: FAMILY STATIONS, INC.)
- KHHZ (97.7 FM; OROVILLE, CA; Owner: CLEAR CHANNEL BROADCASTING LICENSES, INC.)
- KBBF (89.1 FM; SANTA ROSA, CA; Owner: BILINGUAL B/CING. FOUNDATION, INC.)
- K284AG (104.7 FM; WOODLAND, CA; Owner: EDUCATIONAL MEDIA FOUNDATION)
- KUIC (95.3 FM; VACAVILLE, CA; Owner: KUIC, INC.)
- KHGQ (100.3 FM; QUINCY, CA; Owner: KEILY MILLER)
- KKFS (105.5 FM; DUNNIGAN, CA; Owner: CARON BROADCASTING, INC.)
- KVMR (89.5 FM; NEVADA CITY, CA; Owner: NEVADA CITY COMMUNITY BROADCAST GRUP)
- KLVS (99.3 FM; GRASS VALLEY, CA; Owner: EDUCATIONAL MEDIA FOUNDATION)
- KSXY (98.7 FM; MIDDLETOWN, CA; Owner: COMMONWEALTH BROADCASTING, LLC)
TV broadcast stations around South Yuba City:
- KEZT-CA (Channel 23; SACRAMENTO, CA; Owner: TELEFUTURA SACRAMENTO LLC)
- KMMK-LP (Channel 14; SACRAMENTO, CA; Owner: CABALLERO TELEVISION TEXAS, L.L.C.)
- KSPX (Channel 29; SACRAMENTO, CA; Owner: PAXSON SACRAMENTO LICENSE, INC.)
- KTXL (Channel 40; SACRAMENTO, CA; Owner: CHANNEL 40, INC.)
- KOVR (Channel 13; STOCKTON, CA; Owner: SCI - SACRAMENTO LICENSEE, LLC)
- KXTV (Channel 10; SACRAMENTO, CA; Owner: KXTV, INC.)
- KQCA (Channel 58; STOCKTON, CA; Owner: KCRA HEARST-ARGYLE TELEVISION, INC.)
- KVIE (Channel 6; SACRAMENTO, CA; Owner: KVIE, INC.)
- KUVS (Channel 19; MODESTO, CA; Owner: KUVS LICENSE PARTNERSHIP, G.P.)
- KMAX-TV (Channel 31; SACRAMENTO, CA; Owner: UPN STATIONS GROUP INC.)
- K17EH (Channel 17; EUREKA, CA; Owner: MS COMMUNICATIONS, LLC)
- KSAO-LP (Channel 49; SACRAMENTO, CA; Owner: GARY M. COCOLA FAMILY TRUST, GARY M. COCOLA TRUSTEE)
- KBTV-LP (Channel 8; SACRAMENTO, CA; Owner: INCISOR COMMUNICATIONS, L.L.C.)
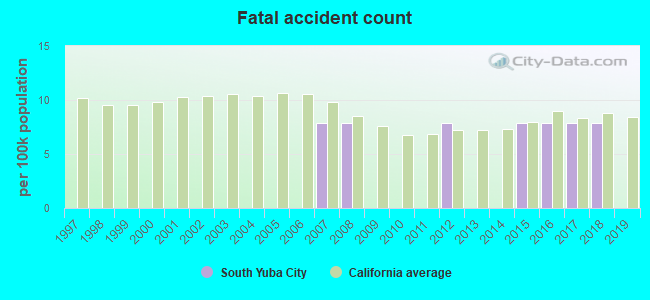
South Yuba City fatal accident list:
Feb 19, 2017 02:05 PM, Sr-99, Lat: 39.116258, Lon: -121.634806, Vehicles: 2, Persons: 3, Fatalities: 1
Mar 14, 2016 03:50 AM, Sr-99, Lat: 39.115689, Lon: -121.634767, Vehicles: 2, Persons: 3, Pedestrians: 1, Fatalities: 1
Jun 2, 2015 03:08 AM, Sr-99, Lat: 39.119681, Lon: -121.634608, Vehicles: 1, Persons: 1, Pedestrians: 1, Fatalities: 1
Jun 14, 2012 12:50 AM, Sr-99, Lat: 39.120514, Lon: -121.634597, Vehicles: 1, Persons: 1, Pedestrians: 1, Fatalities: 1
Sep 18, 2008 02:04 PM, Sr-99, Lat: 39.123090, Lon: -121.634620, Vehicles: 1, Persons: 2, Pedestrians: 1, Fatalities: 1
Nov 30, 2007 11:07 PM, Sr-99, Lincoln Rd, Lat: 39.112714, Lon: -121.634744, Vehicles: 2, Persons: 5, Fatalities: 1
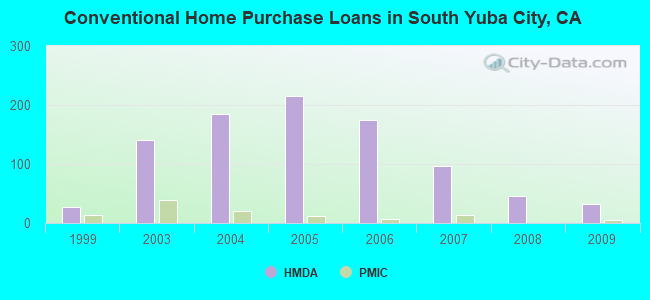
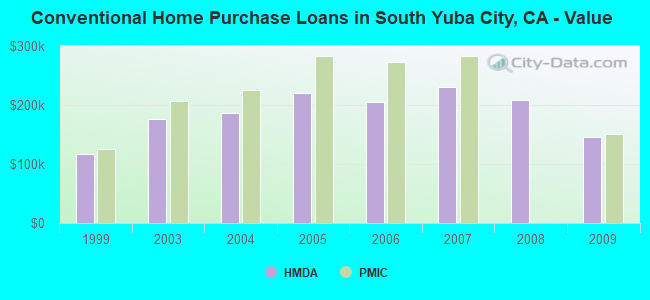
| Home Mortgage Disclosure Act Aggregated Statistics For Year 2009 (Based on 3 partial tracts) | ||||||||||
| A) FHA, FSA/RHS & VA Home Purchase Loans | B) Conventional Home Purchase Loans | C) Refinancings | D) Home Improvement Loans | F) Non-occupant Loans on < 5 Family Dwellings (A B C & D) | ||||||
|---|---|---|---|---|---|---|---|---|---|---|
| Number | Average Value | Number | Average Value | Number | Average Value | Number | Average Value | Number | Average Value | |
| LOANS ORIGINATED | 31 | $179,201 | 32 | $146,229 | 52 | $179,882 | 4 | $125,655 | 9 | $133,118 |
| APPLICATIONS APPROVED, NOT ACCEPTED | 2 | $164,085 | 3 | $167,163 | 3 | $167,003 | 0 | $0 | 0 | $0 |
| APPLICATIONS DENIED | 4 | $174,652 | 7 | $164,759 | 22 | $203,448 | 3 | $48,223 | 2 | $100,380 |
| APPLICATIONS WITHDRAWN | 7 | $217,971 | 4 | $171,512 | 17 | $202,917 | 1 | $103,770 | 2 | $199,525 |
| FILES CLOSED FOR INCOMPLETENESS | 1 | $307,640 | 0 | $0 | 4 | $157,195 | 0 | $0 | 0 | $0 |
Detailed HMDA statistics for the following Tracts: 0503.01 , 0505.03, 0505.04
| Private Mortgage Insurance Companies Aggregated Statistics For Year 2009 (Based on 3 partial tracts) | ||||
| A) Conventional Home Purchase Loans | B) Refinancings | |||
|---|---|---|---|---|
| Number | Average Value | Number | Average Value | |
| LOANS ORIGINATED | 5 | $150,632 | 1 | $202,320 |
| APPLICATIONS APPROVED, NOT ACCEPTED | 2 | $250,705 | 0 | $0 |
| APPLICATIONS DENIED | 2 | $182,710 | 0 | $0 |
| APPLICATIONS WITHDRAWN | 0 | $0 | 1 | $336,540 |
| FILES CLOSED FOR INCOMPLETENESS | 0 | $0 | 0 | $0 |
Detailed PMIC statistics for the following Tracts: 0503.01 , 0505.03, 0505.04
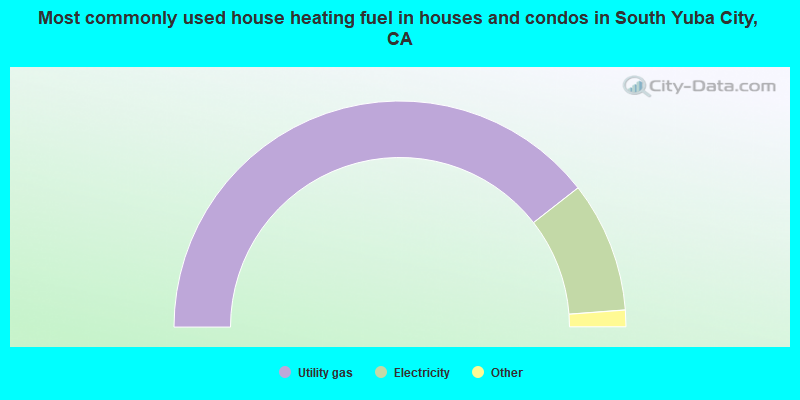
- 78.9%Utility gas
- 18.7%Electricity
- 1.2%Wood
- 0.9%Bottled, tank, or LP gas
- 0.3%Fuel oil, kerosene, etc.
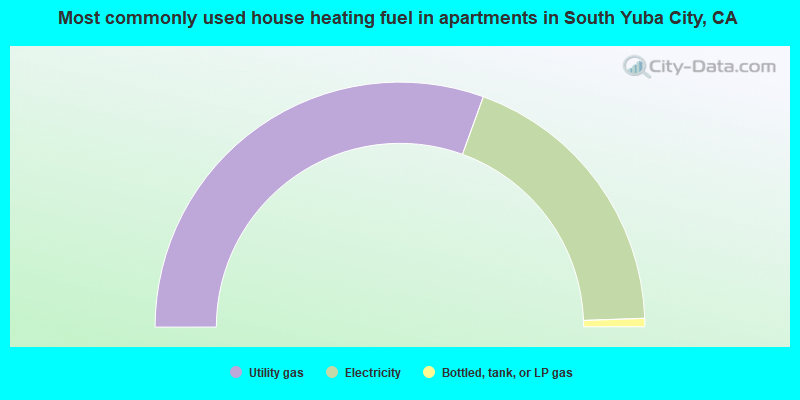
- 61.0%Utility gas
- 37.8%Electricity
- 1.1%Bottled, tank, or LP gas
South Yuba City compared to California state average:
- Median house value below state average.
- Unemployed percentage below state average.
- Black race population percentage significantly below state average.
- Hispanic race population percentage significantly below state average.
- Renting percentage significantly below state average.
- Length of stay since moving in significantly above state average.
- Number of rooms per house significantly below state average.
- House age significantly below state average.
- Institutionalized population percentage significantly above state average.
South Yuba City on our top lists:
- #5 on the list of "Top 101 cities with largest percentage of females in occupations: life, physical, and social science technicians (population 5,000+)"
- #23 on the list of "Top 101 cities with largest percentage of females in industries: u. s. postal service (population 5,000+)"
- #27 on the list of "Top 101 cities with largest percentage of males in industries: food (population 5,000+)"
- #29 on the list of "Top 101 cities with largest percentage of females in industries: vending machine operators (population 5,000+)"
- #30 on the list of "Top 101 cities with largest percentage of females in occupations: child care workers (population 5,000+)"
- #39 on the list of "Top 101 cities with largest percentage of males in occupations: agricultural workers including supervisors (population 5,000+)"
- #39 on the list of "Top 101 cities with largest percentage of females in occupations: mathematical science occupations (population 5,000+)"
- #41 on the list of "Top 101 cities with largest percentage of females in occupations: pipelayers, plumbers, pipefitters, and steamfitters (population 5,000+)"
- #46 on the list of "Top 101 cities with largest percentage of females in industries: social assistance (population 5,000+)"
- #55 on the list of "Top 101 cities with largest percentage of males in industries: alcoholic beverages merchant wholesalers (population 5,000+)"
- #55 on the list of "Top 101 cities with largest percentage of females in industries: computer and electronic products (population 5,000+)"
- #61 on the list of "Top 101 cities with largest percentage of females in occupations: agricultural workers including supervisors (population 5,000+)"
- #62 on the list of "Top 101 cities with largest percentage of females in industries: used merchandise, gift, novelty, and souvenir, and other miscellaneous stores (population 5,000+)"
- #63 on the list of "Top 101 cities with largest percentage of females in industries: food (population 5,000+)"
- #63 on the list of "Top 101 cities with largest percentage of females in industries: sporting goods, camera, and hobby and toy stores (population 5,000+)"
- #69 on the list of "Top 101 cities with largest percentage of males in industries: truck transportation (population 5,000+)"
- #86 on the list of "Top 101 cities with largest percentage of males in industries: used merchandise, gift, novelty, and souvenir, and other miscellaneous stores (population 5,000+)"
- #92 on the list of "Top 101 cities with largest percentage of males in industries: office supplies and stationery stores (population 5,000+)"
- #3 on the list of "Top 101 counties with the highest Ozone (1-hour) air pollution readings in 2012 (ppm)"
- #34 on the list of "Top 101 counties with the highest Nitrogen Dioxide air pollution readings in 2012 (ppm)"
- #64 on the list of "Top 101 counties with the largest number of people moving out compared to moving in (pop. 50,000+)"
- #66 on the list of "Top 101 counties with the largest decrease in the number of deaths per 1000 residents 2000-2006 to 2007-2013 (pop. 50,000+)"
- #92 on the list of "Top 101 counties with the lowest Particulate Matter (PM2.5) Annual air pollution readings in 2012 (µg/m3)"