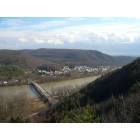
Shickshinny, Pennsylvania Submit your own pictures of this borough and show them to the world
OSM Map
General Map
Google Map
MSN Map
OSM Map
General Map
Google Map
MSN Map
OSM Map
General Map
Google Map
MSN Map
OSM Map
General Map
Google Map
MSN Map
Please wait while loading the map...
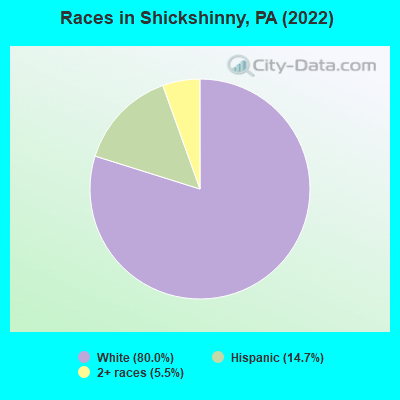
Population in 2022: 629 (0% urban, 100% rural). Population change since 2000: -34.4%Males: 303 Females: 326
March 2022 cost of living index in Shickshinny: 90.5 (less than average, U.S. average is 100) Percentage of residents living in poverty in 2022: 14.7%for White Non-Hispanic residents , 3.9% for Hispanic or Latino residents )
Profiles of local businesses
Business Search - 14 Million verified businesses
Data:
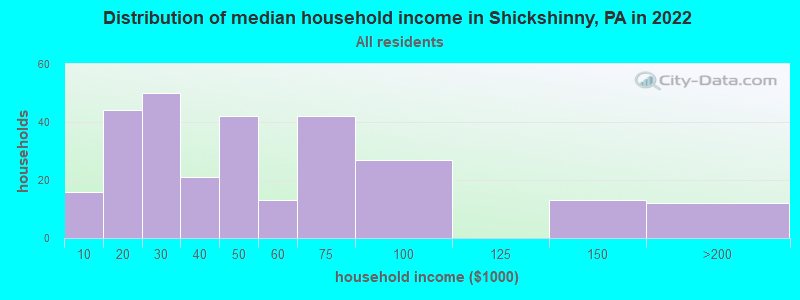
Median household income ($)
Median household income (% change since 2000)
Household income diversity
Ratio of average income to average house value (%)
Ratio of average income to average rent
Median household income ($) - White
Median household income ($) - Black or African American
Median household income ($) - Asian
Median household income ($) - Hispanic or Latino
Median household income ($) - American Indian and Alaska Native
Median household income ($) - Multirace
Median household income ($) - Other Race
Median household income for houses/condos with a mortgage ($)
Median household income for apartments without a mortgage ($)
Races - White alone (%)
Races - White alone (% change since 2000)
Races - Black alone (%)
Races - Black alone (% change since 2000)
Races - American Indian alone (%)
Races - American Indian alone (% change since 2000)
Races - Asian alone (%)
Races - Asian alone (% change since 2000)
Races - Hispanic (%)
Races - Hispanic (% change since 2000)
Races - Native Hawaiian and Other Pacific Islander alone (%)
Races - Native Hawaiian and Other Pacific Islander alone (% change since 2000)
Races - Two or more races (%)
Races - Two or more races (% change since 2000)
Races - Other race alone (%)
Races - Other race alone (% change since 2000)
Racial diversity
Unemployment (%)
Unemployment (% change since 2000)
Unemployment (%) - White
Unemployment (%) - Black or African American
Unemployment (%) - Asian
Unemployment (%) - Hispanic or Latino
Unemployment (%) - American Indian and Alaska Native
Unemployment (%) - Multirace
Unemployment (%) - Other Race
Population density (people per square mile)
Population - Males (%)
Population - Females (%)
Population - Males (%) - White
Population - Males (%) - Black or African American
Population - Males (%) - Asian
Population - Males (%) - Hispanic or Latino
Population - Males (%) - American Indian and Alaska Native
Population - Males (%) - Multirace
Population - Males (%) - Other Race
Population - Females (%) - White
Population - Females (%) - Black or African American
Population - Females (%) - Asian
Population - Females (%) - Hispanic or Latino
Population - Females (%) - American Indian and Alaska Native
Population - Females (%) - Multirace
Population - Females (%) - Other Race
Coronavirus confirmed cases (Jul 02, 2024)
Deaths caused by coronavirus (Jul 02, 2024)
Coronavirus confirmed cases (per 100k population) (Jul 02, 2024)
Deaths caused by coronavirus (per 100k population) (Jul 02, 2024)
Daily increase in number of cases (Jul 02, 2024)
Weekly increase in number of cases (Jul 02, 2024)
Cases doubled (in days) (Jul 02, 2024)
Hospitalized patients (Apr 18, 2022)
Negative test results (Apr 18, 2022)
Total test results (Apr 18, 2022)
COVID Vaccine doses distributed (per 100k population) (Sep 19, 2023)
COVID Vaccine doses administered (per 100k population) (Sep 19, 2023)
COVID Vaccine doses distributed (Sep 19, 2023)
COVID Vaccine doses administered (Sep 19, 2023)
Likely homosexual households (%)
Likely homosexual households (% change since 2000)
Likely homosexual households - Lesbian couples (%)
Likely homosexual households - Lesbian couples (% change since 2000)
Likely homosexual households - Gay men (%)
Likely homosexual households - Gay men (% change since 2000)
Cost of living index
Median gross rent ($)
Median contract rent ($)
Median monthly housing costs ($)
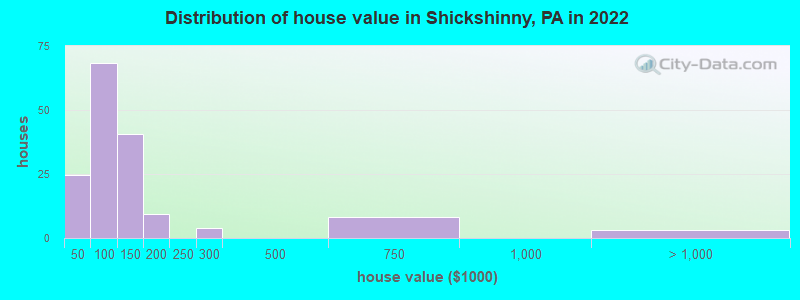
Median house or condo value ($)
Median house or condo value ($ change since 2000)
Mean house or condo value by units in structure - 1, detached ($)
Mean house or condo value by units in structure - 1, attached ($)
Mean house or condo value by units in structure - 2 ($)
Mean house or condo value by units in structure by units in structure - 3 or 4 ($)
Mean house or condo value by units in structure - 5 or more ($)
Mean house or condo value by units in structure - Boat, RV, van, etc. ($)
Mean house or condo value by units in structure - Mobile home ($)
Median house or condo value ($) - White
Median house or condo value ($) - Black or African American
Median house or condo value ($) - Asian
Median house or condo value ($) - Hispanic or Latino
Median house or condo value ($) - American Indian and Alaska Native
Median house or condo value ($) - Multirace
Median house or condo value ($) - Other Race
Median resident age
Resident age diversity
Median resident age - Males
Median resident age - Females
Median resident age - White
Median resident age - Black or African American
Median resident age - Asian
Median resident age - Hispanic or Latino
Median resident age - American Indian and Alaska Native
Median resident age - Multirace
Median resident age - Other Race
Median resident age - Males - White
Median resident age - Males - Black or African American
Median resident age - Males - Asian
Median resident age - Males - Hispanic or Latino
Median resident age - Males - American Indian and Alaska Native
Median resident age - Males - Multirace
Median resident age - Males - Other Race
Median resident age - Females - White
Median resident age - Females - Black or African American
Median resident age - Females - Asian
Median resident age - Females - Hispanic or Latino
Median resident age - Females - American Indian and Alaska Native
Median resident age - Females - Multirace
Median resident age - Females - Other Race
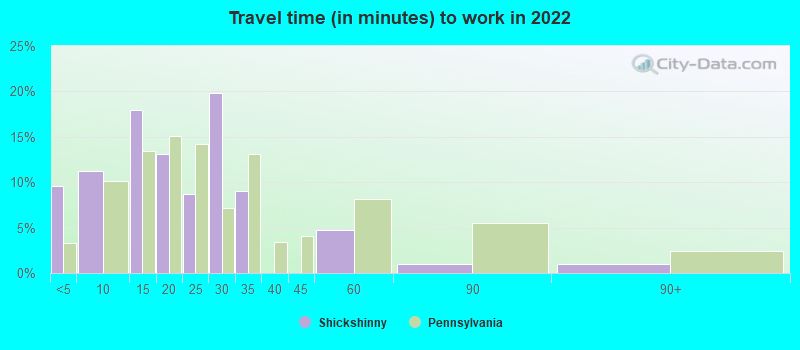
Commute - mean travel time to work (minutes)
Travel time to work - Less than 5 minutes (%)
Travel time to work - Less than 5 minutes (% change since 2000)
Travel time to work - 5 to 9 minutes (%)
Travel time to work - 5 to 9 minutes (% change since 2000)
Travel time to work - 10 to 19 minutes (%)
Travel time to work - 10 to 19 minutes (% change since 2000)
Travel time to work - 20 to 29 minutes (%)
Travel time to work - 20 to 29 minutes (% change since 2000)
Travel time to work - 30 to 39 minutes (%)
Travel time to work - 30 to 39 minutes (% change since 2000)
Travel time to work - 40 to 59 minutes (%)
Travel time to work - 40 to 59 minutes (% change since 2000)
Travel time to work - 60 to 89 minutes (%)
Travel time to work - 60 to 89 minutes (% change since 2000)
Travel time to work - 90 or more minutes (%)
Travel time to work - 90 or more minutes (% change since 2000)
Marital status - Never married (%)
Marital status - Now married (%)
Marital status - Separated (%)
Marital status - Widowed (%)
Marital status - Divorced (%)
Median family income ($)
Median family income (% change since 2000)
Median non-family income ($)
Median non-family income (% change since 2000)
Median per capita income ($)
Median per capita income (% change since 2000)
Median family income ($) - White
Median family income ($) - Black or African American
Median family income ($) - Asian
Median family income ($) - Hispanic or Latino
Median family income ($) - American Indian and Alaska Native
Median family income ($) - Multirace
Median family income ($) - Other Race
Median year house/condo built
Median year apartment built
Year house built - Built 2005 or later (%)
Year house built - Built 2000 to 2004 (%)
Year house built - Built 1990 to 1999 (%)
Year house built - Built 1980 to 1989 (%)
Year house built - Built 1970 to 1979 (%)
Year house built - Built 1960 to 1969 (%)
Year house built - Built 1950 to 1959 (%)
Year house built - Built 1940 to 1949 (%)
Year house built - Built 1939 or earlier (%)
Average household size
Household density (households per square mile)
Average household size - White
Average household size - Black or African American
Average household size - Asian
Average household size - Hispanic or Latino
Average household size - American Indian and Alaska Native
Average household size - Multirace
Average household size - Other Race
Occupied housing units (%)
Vacant housing units (%)
Owner occupied housing units (%)
Renter occupied housing units (%)
Vacancy status - For rent (%)
Vacancy status - For sale only (%)
Vacancy status - Rented or sold, not occupied (%)
Vacancy status - For seasonal, recreational, or occasional use (%)
Vacancy status - For migrant workers (%)
Vacancy status - Other vacant (%)
Residents with income below the poverty level (%)
Residents with income below 50% of the poverty level (%)
Children below poverty level (%)
Poor families by family type - Married-couple family (%)
Poor families by family type - Male, no wife present (%)
Poor families by family type - Female, no husband present (%)
Poverty status for native-born residents (%)
Poverty status for foreign-born residents (%)
Poverty among high school graduates not in families (%)
Poverty among people who did not graduate high school not in families (%)
Residents with income below the poverty level (%) - White
Residents with income below the poverty level (%) - Black or African American
Residents with income below the poverty level (%) - Asian
Residents with income below the poverty level (%) - Hispanic or Latino
Residents with income below the poverty level (%) - American Indian and Alaska Native
Residents with income below the poverty level (%) - Multirace
Residents with income below the poverty level (%) - Other Race
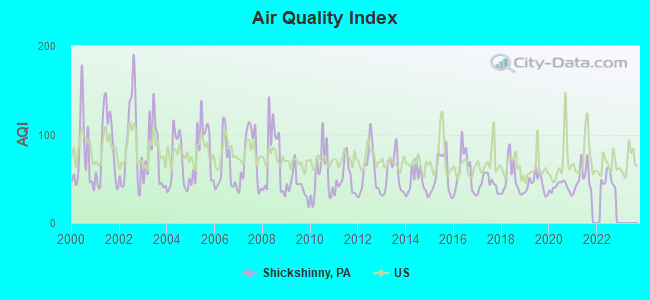
Air pollution - Air Quality Index (AQI)
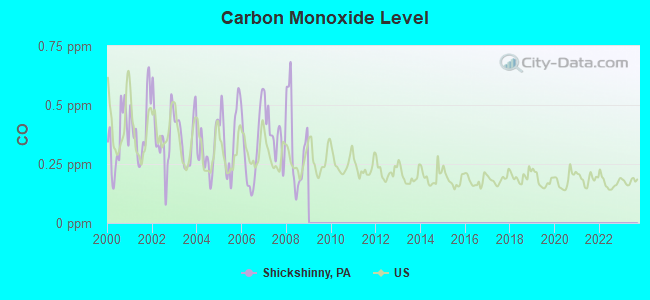
Air pollution - CO
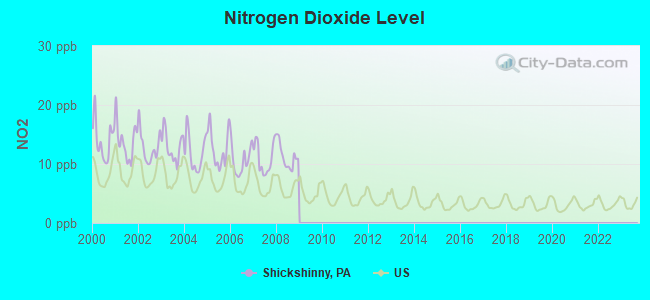
Air pollution - NO2
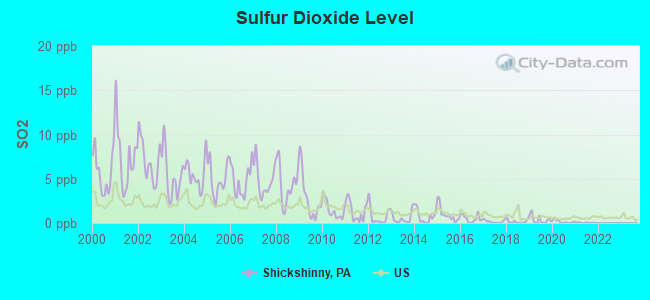
Air pollution - SO2
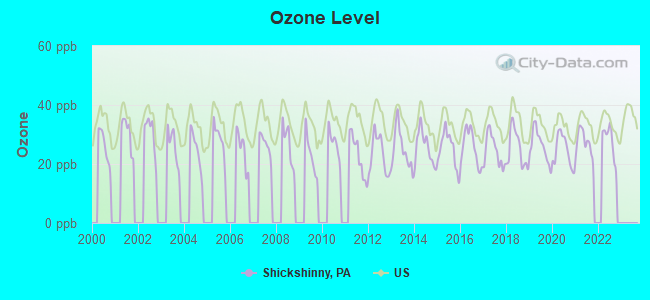
Air pollution - Ozone
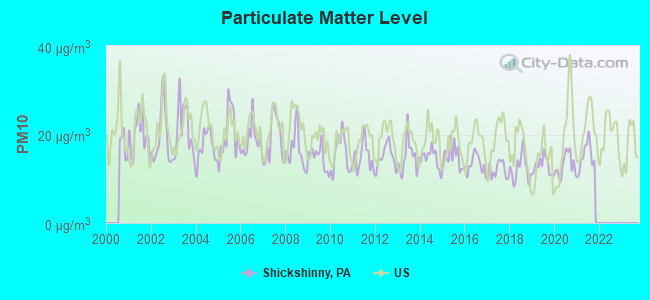
Air pollution - PM10
Air pollution - PM25
Air pollution - Pb
Crime - Murders per 100,000 population
Crime - Rapes per 100,000 population
Crime - Robberies per 100,000 population
Crime - Assaults per 100,000 population
Crime - Burglaries per 100,000 population
Crime - Thefts per 100,000 population
Crime - Auto thefts per 100,000 population
Crime - Arson per 100,000 population
Crime - City-data.com crime index
Crime - Violent crime index
Crime - Property crime index
Crime - Murders per 100,000 population (5 year average)
Crime - Rapes per 100,000 population (5 year average)
Crime - Robberies per 100,000 population (5 year average)
Crime - Assaults per 100,000 population (5 year average)
Crime - Burglaries per 100,000 population (5 year average)
Crime - Thefts per 100,000 population (5 year average)
Crime - Auto thefts per 100,000 population (5 year average)
Crime - Arson per 100,000 population (5 year average)
Crime - City-data.com crime index (5 year average)
Crime - Violent crime index (5 year average)
Crime - Property crime index (5 year average)
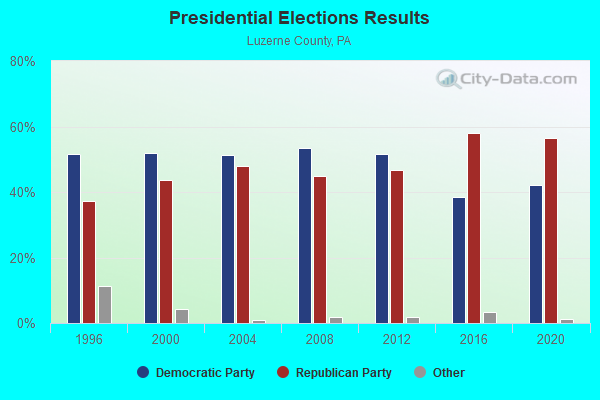
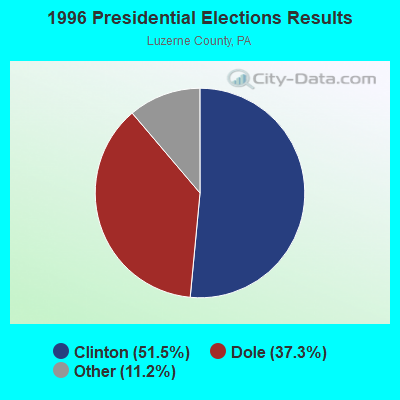
1996 Presidential Elections Results (%) - Democratic Party (Clinton)
1996 Presidential Elections Results (%) - Republican Party (Dole)
1996 Presidential Elections Results (%) - Other
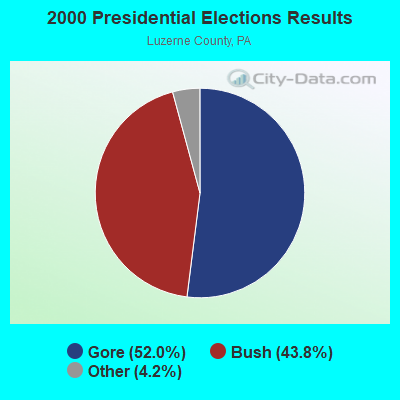
2000 Presidential Elections Results (%) - Democratic Party (Gore)
2000 Presidential Elections Results (%) - Republican Party (Bush)
2000 Presidential Elections Results (%) - Other
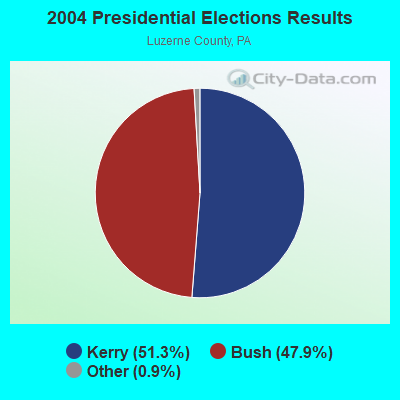
2004 Presidential Elections Results (%) - Democratic Party (Kerry)
2004 Presidential Elections Results (%) - Republican Party (Bush)
2004 Presidential Elections Results (%) - Other
2008 Presidential Elections Results (%) - Democratic Party (Obama)
2008 Presidential Elections Results (%) - Republican Party (McCain)
2008 Presidential Elections Results (%) - Other
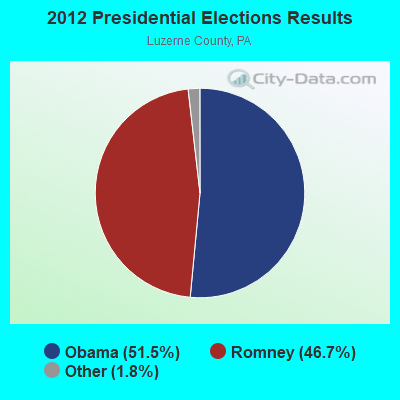
2012 Presidential Elections Results (%) - Democratic Party (Obama)
2012 Presidential Elections Results (%) - Republican Party (Romney)
2012 Presidential Elections Results (%) - Other
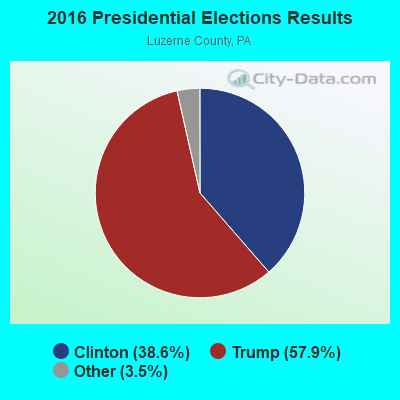
2016 Presidential Elections Results (%) - Democratic Party (Clinton)
2016 Presidential Elections Results (%) - Republican Party (Trump)
2016 Presidential Elections Results (%) - Other
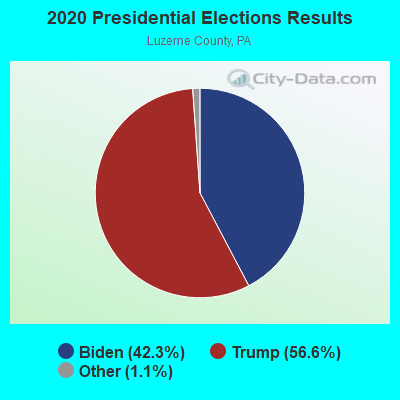
2020 Presidential Elections Results (%) - Democratic Party (Biden)
2020 Presidential Elections Results (%) - Republican Party (Trump)
2020 Presidential Elections Results (%) - Other
Ancestries Reported - Arab (%)
Ancestries Reported - Czech (%)
Ancestries Reported - Danish (%)
Ancestries Reported - Dutch (%)
Ancestries Reported - English (%)
Ancestries Reported - French (%)
Ancestries Reported - French Canadian (%)
Ancestries Reported - German (%)
Ancestries Reported - Greek (%)
Ancestries Reported - Hungarian (%)
Ancestries Reported - Irish (%)
Ancestries Reported - Italian (%)
Ancestries Reported - Lithuanian (%)
Ancestries Reported - Norwegian (%)
Ancestries Reported - Polish (%)
Ancestries Reported - Portuguese (%)
Ancestries Reported - Russian (%)
Ancestries Reported - Scotch-Irish (%)
Ancestries Reported - Scottish (%)
Ancestries Reported - Slovak (%)
Ancestries Reported - Subsaharan African (%)
Ancestries Reported - Swedish (%)
Ancestries Reported - Swiss (%)
Ancestries Reported - Ukrainian (%)
Ancestries Reported - United States (%)
Ancestries Reported - Welsh (%)
Ancestries Reported - West Indian (%)
Ancestries Reported - Other (%)
Educational Attainment - No schooling completed (%)
Educational Attainment - Less than high school (%)
Educational Attainment - High school or equivalent (%)
Educational Attainment - Less than 1 year of college (%)
Educational Attainment - 1 or more years of college (%)
Educational Attainment - Associate degree (%)
Educational Attainment - Bachelor's degree (%)
Educational Attainment - Master's degree (%)
Educational Attainment - Professional school degree (%)
Educational Attainment - Doctorate degree (%)
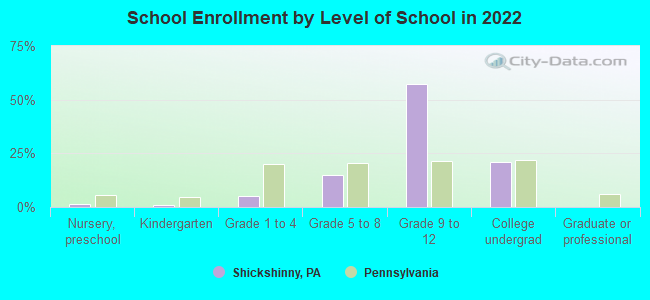
School Enrollment - Nursery, preschool (%)
School Enrollment - Kindergarten (%)
School Enrollment - Grade 1 to 4 (%)
School Enrollment - Grade 5 to 8 (%)
School Enrollment - Grade 9 to 12 (%)
School Enrollment - College undergrad (%)
School Enrollment - Graduate or professional (%)
School Enrollment - Not enrolled in school (%)
School enrollment - Public schools (%)
School enrollment - Private schools (%)
School enrollment - Not enrolled (%)
Median number of rooms in houses and condos
Median number of rooms in apartments
Housing units lacking complete plumbing facilities (%)
Housing units lacking complete kitchen facilities (%)
Density of houses
Urban houses (%)
Rural houses (%)
Households with people 60 years and over (%)
Households with people 65 years and over (%)
Households with people 75 years and over (%)
Households with one or more nonrelatives (%)
Households with no nonrelatives (%)
Population in households (%)
Family households (%)
Nonfamily households (%)
Population in families (%)
Family households with own children (%)
Median number of bedrooms in owner occupied houses
Mean number of bedrooms in owner occupied houses
Median number of bedrooms in renter occupied houses
Mean number of bedrooms in renter occupied houses
Median number of vehichles in owner occupied houses
Mean number of vehichles in owner occupied houses
Median number of vehichles in renter occupied houses
Mean number of vehichles in renter occupied houses
Mortgage status - with mortgage (%)
Mortgage status - with second mortgage (%)
Mortgage status - with home equity loan (%)
Mortgage status - with both second mortgage and home equity loan (%)
Mortgage status - without a mortgage (%)
Average family size
Average family size - White
Average family size - Black or African American
Average family size - Asian
Average family size - Hispanic or Latino
Average family size - American Indian and Alaska Native
Average family size - Multirace
Average family size - Other Race
Geographical mobility - Same house 1 year ago (%)
Geographical mobility - Moved within same county (%)
Geographical mobility - Moved from different county within same state (%)
Geographical mobility - Moved from different state (%)
Geographical mobility - Moved from abroad (%)
Place of birth - Born in state of residence (%)
Place of birth - Born in other state (%)
Place of birth - Native, outside of US (%)
Place of birth - Foreign born (%)
Housing units in structures - 1, detached (%)
Housing units in structures - 1, attached (%)
Housing units in structures - 2 (%)
Housing units in structures - 3 or 4 (%)
Housing units in structures - 5 to 9 (%)
Housing units in structures - 10 to 19 (%)
Housing units in structures - 20 to 49 (%)
Housing units in structures - 50 or more (%)
Housing units in structures - Mobile home (%)
Housing units in structures - Boat, RV, van, etc. (%)
House/condo owner moved in on average (years ago)
Renter moved in on average (years ago)
Year householder moved into unit - Moved in 1999 to March 2000 (%)
Year householder moved into unit - Moved in 1995 to 1998 (%)
Year householder moved into unit - Moved in 1990 to 1994 (%)
Year householder moved into unit - Moved in 1980 to 1989 (%)
Year householder moved into unit - Moved in 1970 to 1979 (%)
Year householder moved into unit - Moved in 1969 or earlier (%)
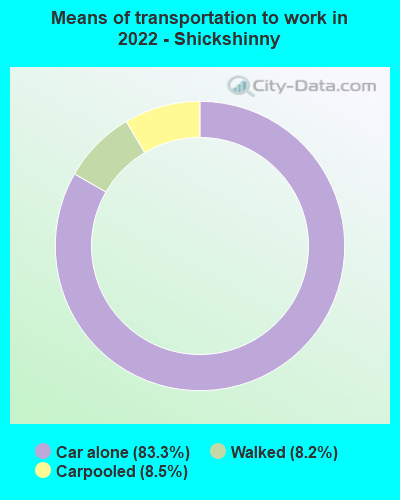
Means of transportation to work - Drove car alone (%)
Means of transportation to work - Carpooled (%)
Means of transportation to work - Public transportation (%)
Means of transportation to work - Bus or trolley bus (%)
Means of transportation to work - Streetcar or trolley car (%)
Means of transportation to work - Subway or elevated (%)
Means of transportation to work - Railroad (%)
Means of transportation to work - Ferryboat (%)
Means of transportation to work - Taxicab (%)
Means of transportation to work - Motorcycle (%)
Means of transportation to work - Bicycle (%)
Means of transportation to work - Walked (%)
Means of transportation to work - Other means (%)
Working at home (%)
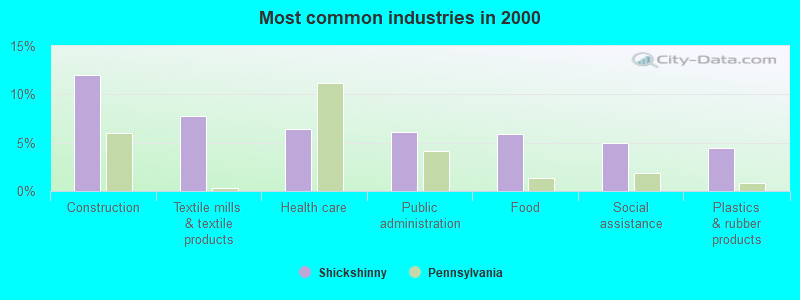
Industry diversity
Most Common Industries - Agriculture, forestry, fishing and hunting, and mining (%)
Most Common Industries - Agriculture, forestry, fishing and hunting (%)
Most Common Industries - Mining, quarrying, and oil and gas extraction (%)
Most Common Industries - Construction (%)
Most Common Industries - Manufacturing (%)
Most Common Industries - Wholesale trade (%)
Most Common Industries - Retail trade (%)
Most Common Industries - Transportation and warehousing, and utilities (%)
Most Common Industries - Transportation and warehousing (%)
Most Common Industries - Utilities (%)
Most Common Industries - Information (%)
Most Common Industries - Finance and insurance, and real estate and rental and leasing (%)
Most Common Industries - Finance and insurance (%)
Most Common Industries - Real estate and rental and leasing (%)
Most Common Industries - Professional, scientific, and management, and administrative and waste management services (%)
Most Common Industries - Professional, scientific, and technical services (%)
Most Common Industries - Management of companies and enterprises (%)
Most Common Industries - Administrative and support and waste management services (%)
Most Common Industries - Educational services, and health care and social assistance (%)
Most Common Industries - Educational services (%)
Most Common Industries - Health care and social assistance (%)
Most Common Industries - Arts, entertainment, and recreation, and accommodation and food services (%)
Most Common Industries - Arts, entertainment, and recreation (%)
Most Common Industries - Accommodation and food services (%)
Most Common Industries - Other services, except public administration (%)
Most Common Industries - Public administration (%)
Occupation diversity
Most Common Occupations - Management, business, science, and arts occupations (%)
Most Common Occupations - Management, business, and financial occupations (%)
Most Common Occupations - Management occupations (%)
Most Common Occupations - Business and financial operations occupations (%)
Most Common Occupations - Computer, engineering, and science occupations (%)
Most Common Occupations - Computer and mathematical occupations (%)
Most Common Occupations - Architecture and engineering occupations (%)
Most Common Occupations - Life, physical, and social science occupations (%)
Most Common Occupations - Education, legal, community service, arts, and media occupations (%)
Most Common Occupations - Community and social service occupations (%)
Most Common Occupations - Legal occupations (%)
Most Common Occupations - Education, training, and library occupations (%)
Most Common Occupations - Arts, design, entertainment, sports, and media occupations (%)
Most Common Occupations - Healthcare practitioners and technical occupations (%)
Most Common Occupations - Health diagnosing and treating practitioners and other technical occupations (%)
Most Common Occupations - Health technologists and technicians (%)
Most Common Occupations - Service occupations (%)
Most Common Occupations - Healthcare support occupations (%)
Most Common Occupations - Protective service occupations (%)
Most Common Occupations - Fire fighting and prevention, and other protective service workers including supervisors (%)
Most Common Occupations - Law enforcement workers including supervisors (%)
Most Common Occupations - Food preparation and serving related occupations (%)
Most Common Occupations - Building and grounds cleaning and maintenance occupations (%)
Most Common Occupations - Personal care and service occupations (%)
Most Common Occupations - Sales and office occupations (%)
Most Common Occupations - Sales and related occupations (%)
Most Common Occupations - Office and administrative support occupations (%)
Most Common Occupations - Natural resources, construction, and maintenance occupations (%)
Most Common Occupations - Farming, fishing, and forestry occupations (%)
Most Common Occupations - Construction and extraction occupations (%)
Most Common Occupations - Installation, maintenance, and repair occupations (%)
Most Common Occupations - Production, transportation, and material moving occupations (%)
Most Common Occupations - Production occupations (%)
Most Common Occupations - Transportation occupations (%)
Most Common Occupations - Material moving occupations (%)
People in Group quarters - Institutionalized population (%)
People in Group quarters - Correctional institutions (%)
People in Group quarters - Federal prisons and detention centers (%)
People in Group quarters - Halfway houses (%)
People in Group quarters - Local jails and other confinement facilities (including police lockups) (%)
People in Group quarters - Military disciplinary barracks (%)
People in Group quarters - State prisons (%)
People in Group quarters - Other types of correctional institutions (%)
People in Group quarters - Nursing homes (%)
People in Group quarters - Hospitals/wards, hospices, and schools for the handicapped (%)
People in Group quarters - Hospitals/wards and hospices for chronically ill (%)
People in Group quarters - Hospices or homes for chronically ill (%)
People in Group quarters - Military hospitals or wards for chronically ill (%)
People in Group quarters - Other hospitals or wards for chronically ill (%)
People in Group quarters - Hospitals or wards for drug/alcohol abuse (%)
People in Group quarters - Mental (Psychiatric) hospitals or wards (%)
People in Group quarters - Schools, hospitals, or wards for the mentally retarded (%)
People in Group quarters - Schools, hospitals, or wards for the physically handicapped (%)
People in Group quarters - Institutions for the deaf (%)
People in Group quarters - Institutions for the blind (%)
People in Group quarters - Orthopedic wards and institutions for the physically handicapped (%)
People in Group quarters - Wards in general hospitals for patients who have no usual home elsewhere (%)
People in Group quarters - Wards in military hospitals for patients who have no usual home elsewhere (%)
People in Group quarters - Juvenile institutions (%)
People in Group quarters - Long-term care (%)
People in Group quarters - Homes for abused, dependent, and neglected children (%)
People in Group quarters - Residential treatment centers for emotionally disturbed children (%)
People in Group quarters - Training schools for juvenile delinquents (%)
People in Group quarters - Short-term care, detention or diagnostic centers for delinquent children (%)
People in Group quarters - Type of juvenile institution unknown (%)
People in Group quarters - Noninstitutionalized population (%)
People in Group quarters - College dormitories (includes college quarters off campus) (%)
People in Group quarters - Military quarters (%)
People in Group quarters - On base (%)
People in Group quarters - Barracks, unaccompanied personnel housing (UPH), (Enlisted/Officer), ;and similar group living quarters for military personnel (%)
People in Group quarters - Transient quarters for temporary residents (%)
People in Group quarters - Military ships (%)
People in Group quarters - Group homes (%)
People in Group quarters - Homes or halfway houses for drug/alcohol abuse (%)
People in Group quarters - Homes for the mentally ill (%)
People in Group quarters - Homes for the mentally retarded (%)
People in Group quarters - Homes for the physically handicapped (%)
People in Group quarters - Other group homes (%)
People in Group quarters - Religious group quarters (%)
People in Group quarters - Dormitories (%)
People in Group quarters - Agriculture workers' dormitories on farms (%)
People in Group quarters - Job Corps and vocational training facilities (%)
People in Group quarters - Other workers' dormitories (%)
People in Group quarters - Crews of maritime vessels (%)
People in Group quarters - Other nonhousehold living situations (%)
People in Group quarters - Other noninstitutional group quarters (%)
Residents speaking English at home (%)
Residents speaking English at home - Born in the United States (%)
Residents speaking English at home - Native, born elsewhere (%)
Residents speaking English at home - Foreign born (%)
Residents speaking Spanish at home (%)
Residents speaking Spanish at home - Born in the United States (%)
Residents speaking Spanish at home - Native, born elsewhere (%)
Residents speaking Spanish at home - Foreign born (%)
Residents speaking other language at home (%)
Residents speaking other language at home - Born in the United States (%)
Residents speaking other language at home - Native, born elsewhere (%)
Residents speaking other language at home - Foreign born (%)
Class of Workers - Employee of private company (%)
Class of Workers - Self-employed in own incorporated business (%)
Class of Workers - Private not-for-profit wage and salary workers (%)
Class of Workers - Local government workers (%)
Class of Workers - State government workers (%)
Class of Workers - Federal government workers (%)
Class of Workers - Self-employed workers in own not incorporated business and Unpaid family workers (%)
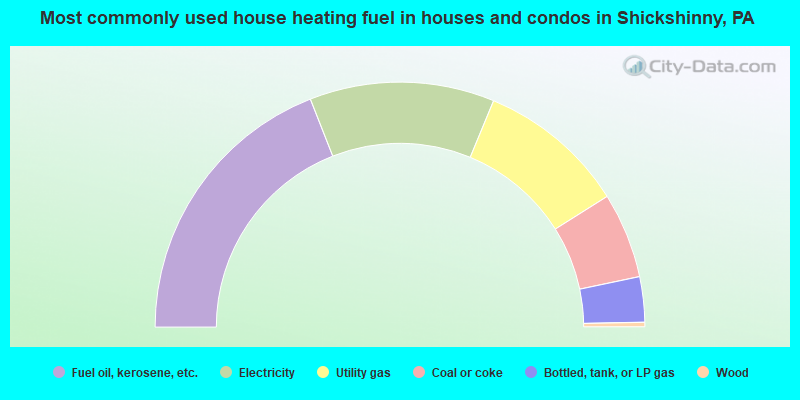
House heating fuel used in houses and condos - Utility gas (%)
House heating fuel used in houses and condos - Bottled, tank, or LP gas (%)
House heating fuel used in houses and condos - Electricity (%)
House heating fuel used in houses and condos - Fuel oil, kerosene, etc. (%)
House heating fuel used in houses and condos - Coal or coke (%)
House heating fuel used in houses and condos - Wood (%)
House heating fuel used in houses and condos - Solar energy (%)
House heating fuel used in houses and condos - Other fuel (%)
House heating fuel used in houses and condos - No fuel used (%)
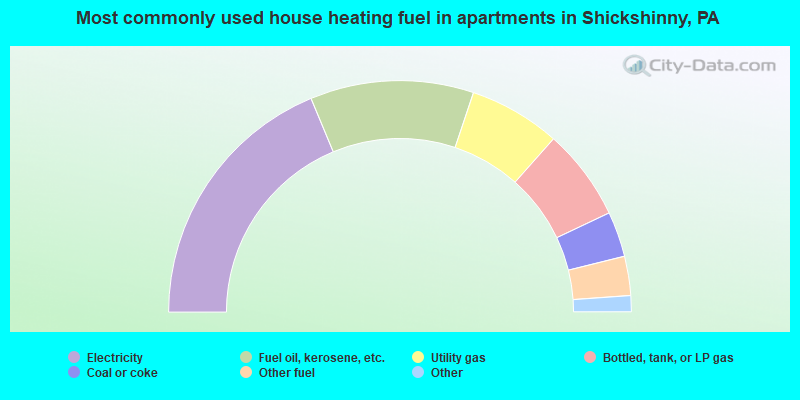
House heating fuel used in apartments - Utility gas (%)
House heating fuel used in apartments - Bottled, tank, or LP gas (%)
House heating fuel used in apartments - Electricity (%)
House heating fuel used in apartments - Fuel oil, kerosene, etc. (%)
House heating fuel used in apartments - Coal or coke (%)
House heating fuel used in apartments - Wood (%)
House heating fuel used in apartments - Solar energy (%)
House heating fuel used in apartments - Other fuel (%)
House heating fuel used in apartments - No fuel used (%)
Armed forces status - In Armed Forces (%)
Armed forces status - Civilian (%)
Armed forces status - Civilian - Veteran (%)
Armed forces status - Civilian - Nonveteran (%)
Fatal accidents locations in years 2005-2021
Fatal accidents locations in 2005
Fatal accidents locations in 2006
Fatal accidents locations in 2007
Fatal accidents locations in 2008
Fatal accidents locations in 2009
Fatal accidents locations in 2010
Fatal accidents locations in 2011
Fatal accidents locations in 2012
Fatal accidents locations in 2013
Fatal accidents locations in 2014
Fatal accidents locations in 2015
Fatal accidents locations in 2016
Fatal accidents locations in 2017
Fatal accidents locations in 2018
Fatal accidents locations in 2019
Fatal accidents locations in 2020
Fatal accidents locations in 2021
Alcohol use - People drinking some alcohol every month (%)
Alcohol use - People not drinking at all (%)
Alcohol use - Average days/month drinking alcohol
Alcohol use - Average drinks/week
Alcohol use - Average days/year people drink much
Audiometry - Average condition of hearing (%)
Audiometry - People that can hear a whisper from across a quiet room (%)
Audiometry - People that can hear normal voice from across a quiet room (%)
Audiometry - Ears ringing, roaring, buzzing (%)
Audiometry - Had a job exposure to loud noise (%)
Audiometry - Had off-work exposure to loud noise (%)
Blood Pressure & Cholesterol - Has high blood pressure (%)
Blood Pressure & Cholesterol - Checking blood pressure at home (%)
Blood Pressure & Cholesterol - Frequently checking blood cholesterol (%)
Blood Pressure & Cholesterol - Has high cholesterol level (%)
Consumer Behavior - Money monthly spent on food at supermarket/grocery store
Consumer Behavior - Money monthly spent on food at other stores
Consumer Behavior - Money monthly spent on eating out
Consumer Behavior - Money monthly spent on carryout/delivered foods
Consumer Behavior - Income spent on food at supermarket/grocery store (%)
Consumer Behavior - Income spent on food at other stores (%)
Consumer Behavior - Income spent on eating out (%)
Consumer Behavior - Income spent on carryout/delivered foods (%)
Current Health Status - General health condition (%)
Current Health Status - Blood donors (%)
Current Health Status - Has blood ever tested for HIV virus (%)
Current Health Status - Left-handed people (%)
Dermatology - People using sunscreen (%)
Diabetes - Diabetics (%)
Diabetes - Had a blood test for high blood sugar (%)
Diabetes - People taking insulin (%)
Diet Behavior & Nutrition - Diet health (%)
Diet Behavior & Nutrition - Milk product consumption (# of products/month)
Diet Behavior & Nutrition - Meals not home prepared (#/week)
Diet Behavior & Nutrition - Meals from fast food or pizza place (#/week)
Diet Behavior & Nutrition - Ready-to-eat foods (#/month)
Diet Behavior & Nutrition - Frozen meals/pizza (#/month)
Drug Use - People that ever used marijuana or hashish (%)
Drug Use - Ever used hard drugs (%)
Drug Use - Ever used any form of cocaine (%)
Drug Use - Ever used heroin (%)
Drug Use - Ever used methamphetamine (%)
Health Insurance - People covered by health insurance (%)
Kidney Conditions-Urology - Avg. # of times urinating at night
Medical Conditions - People with asthma (%)
Medical Conditions - People with anemia (%)
Medical Conditions - People with psoriasis (%)
Medical Conditions - People with overweight (%)
Medical Conditions - Elderly people having difficulties in thinking or remembering (%)
Medical Conditions - People who ever received blood transfusion (%)
Medical Conditions - People having trouble seeing even with glass/contacts (%)
Medical Conditions - People with arthritis (%)
Medical Conditions - People with gout (%)
Medical Conditions - People with congestive heart failure (%)
Medical Conditions - People with coronary heart disease (%)
Medical Conditions - People with angina pectoris (%)
Medical Conditions - People who ever had heart attack (%)
Medical Conditions - People who ever had stroke (%)
Medical Conditions - People with emphysema (%)
Medical Conditions - People with thyroid problem (%)
Medical Conditions - People with chronic bronchitis (%)
Medical Conditions - People with any liver condition (%)
Medical Conditions - People who ever had cancer or malignancy (%)
Mental Health - People who have little interest in doing things (%)
Mental Health - People feeling down, depressed, or hopeless (%)
Mental Health - People who have trouble sleeping or sleeping too much (%)
Mental Health - People feeling tired or having little energy (%)
Mental Health - People with poor appetite or overeating (%)
Mental Health - People feeling bad about themself (%)
Mental Health - People who have trouble concentrating on things (%)
Mental Health - People moving or speaking slowly or too fast (%)
Mental Health - People having thoughts they would be better off dead (%)
Oral Health - Average years since last visit a dentist
Oral Health - People embarrassed because of mouth (%)
Oral Health - People with gum disease (%)
Oral Health - General health of teeth and gums (%)
Oral Health - Average days a week using dental floss/device
Oral Health - Average days a week using mouthwash for dental problem
Oral Health - Average number of teeth
Pesticide Use - Households using pesticides to control insects (%)
Pesticide Use - Households using pesticides to kill weeds (%)
Physical Activity - People doing vigorous-intensity work activities (%)
Physical Activity - People doing moderate-intensity work activities (%)
Physical Activity - People walking or bicycling (%)
Physical Activity - People doing vigorous-intensity recreational activities (%)
Physical Activity - People doing moderate-intensity recreational activities (%)
Physical Activity - Average hours a day doing sedentary activities
Physical Activity - Average hours a day watching TV or videos
Physical Activity - Average hours a day using computer
Physical Functioning - People having limitations keeping them from working (%)
Physical Functioning - People limited in amount of work they can do (%)
Physical Functioning - People that need special equipment to walk (%)
Physical Functioning - People experiencing confusion/memory problems (%)
Physical Functioning - People requiring special healthcare equipment (%)
Prescription Medications - Average number of prescription medicines taking
Preventive Aspirin Use - Adults 40+ taking low-dose aspirin (%)
Reproductive Health - Vaginal deliveries (%)
Reproductive Health - Cesarean deliveries (%)
Reproductive Health - Deliveries resulted in a live birth (%)
Reproductive Health - Pregnancies resulted in a delivery (%)
Reproductive Health - Women breastfeeding newborns (%)
Reproductive Health - Women that had a hysterectomy (%)
Reproductive Health - Women that had both ovaries removed (%)
Reproductive Health - Women that have ever taken birth control pills (%)
Reproductive Health - Women taking birth control pills (%)
Reproductive Health - Women that have ever used Depo-Provera or injectables (%)
Reproductive Health - Women that have ever used female hormones (%)
Sexual Behavior - People 18+ that ever had sex (vaginal, anal, or oral) (%)
Sexual Behavior - Males 18+ that ever had vaginal sex with a woman (%)
Sexual Behavior - Males 18+ that ever performed oral sex on a woman (%)
Sexual Behavior - Males 18+ that ever had anal sex with a woman (%)
Sexual Behavior - Males 18+ that ever had any sex with a man (%)
Sexual Behavior - Females 18+ that ever had vaginal sex with a man (%)
Sexual Behavior - Females 18+ that ever performed oral sex on a man (%)
Sexual Behavior - Females 18+ that ever had anal sex with a man (%)
Sexual Behavior - Females 18+ that ever had any kind of sex with a woman (%)
Sexual Behavior - Average age people first had sex
Sexual Behavior - Average number of female sex partners in lifetime (males 18+)
Sexual Behavior - Average number of female vaginal sex partners in lifetime (males 18+)
Sexual Behavior - Average age people first performed oral sex on a woman (18+)
Sexual Behavior - Average number of woman performed oral sex on in lifetime (18+)
Sexual Behavior - Average number of male sex partners in lifetime (males 18+)
Sexual Behavior - Average number of male anal sex partners in lifetime (males 18+)
Sexual Behavior - Average age people first performed oral sex on a man (18+)
Sexual Behavior - Average number of male oral sex partners in lifetime (18+)
Sexual Behavior - People using protection when performing oral sex (%)
Sexual Behavior - Average number of times people have vaginal or anal sex a year
Sexual Behavior - People having sex without condom (%)
Sexual Behavior - Average number of male sex partners in lifetime (females 18+)
Sexual Behavior - Average number of male vaginal sex partners in lifetime (females 18+)
Sexual Behavior - Average number of female sex partners in lifetime (females 18+)
Sexual Behavior - Circumcised males 18+ (%)
Sleep Disorders - Average hours sleeping at night
Sleep Disorders - People that has trouble sleeping (%)
Smoking-Cigarette Use - People smoking cigarettes (%)
Taste & Smell - People 40+ having problems with smell (%)
Taste & Smell - People 40+ having problems with taste (%)
Taste & Smell - People 40+ that ever had wisdom teeth removed (%)
Taste & Smell - People 40+ that ever had tonsils teeth removed (%)
Taste & Smell - People 40+ that ever had a loss of consciousness because of a head injury (%)
Taste & Smell - People 40+ that ever had a broken nose or other serious injury to face or skull (%)
Taste & Smell - People 40+ that ever had two or more sinus infections (%)
Weight - Average height (inches)
Weight - Average weight (pounds)
Weight - Average BMI
Weight - People that are obese (%)
Weight - People that ever were obese (%)
Weight - People trying to lose weight (%)
Latest news from Shickshinny, PA collected exclusively by city-data.com from local newspapers, TV, and radio stations
Ancestries: German (21.7%), Polish (15.4%), Slavic (12.5%), American (7.0%), English (4.8%), Irish (2.6%).
Current Local Time:
Incorporated on 11/30/1861
Land area: 0.37 square miles.
Population density: 1,700 people per square mile (low).
13 residents are foreign born
This borough:
1.4%Pennsylvania:
4.1%
Median real estate property taxes paid for housing units with mortgages in 2022: $1,103 (1.2%)Median real estate property taxes paid for housing units with no mortgage in 2022: $2,172 (2.0%)
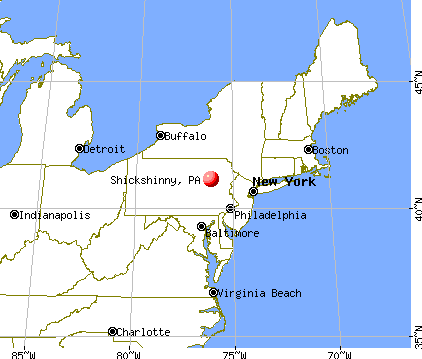
Nearest city with pop. 50,000+: Scranton, PA
Nearest city with pop. 200,000+: Philadelphia, PA
Nearest cities:
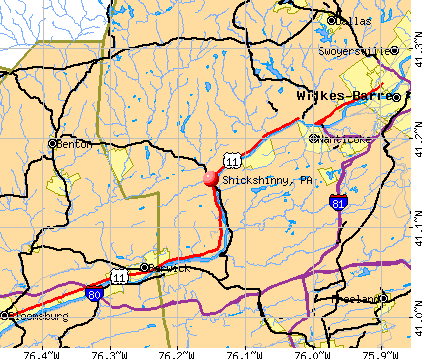
Latitude: 41.15 N, Longitude: 76.15 W
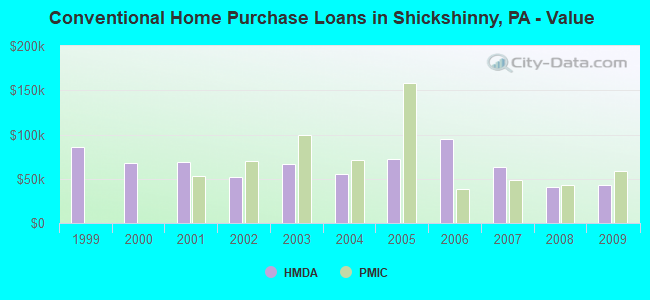
Property values in Shickshinny, PA
Unemployment in December 2023: Here:
3.8%Pennsylvania:
2.9%
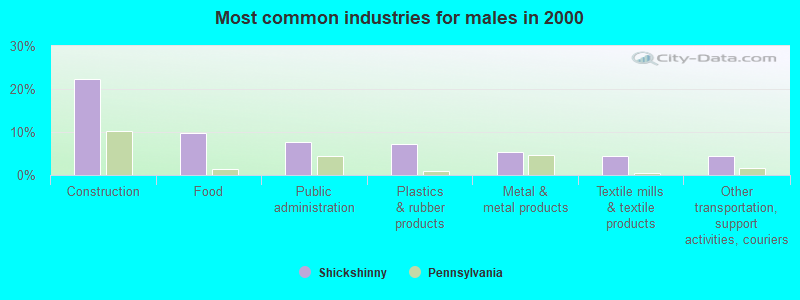
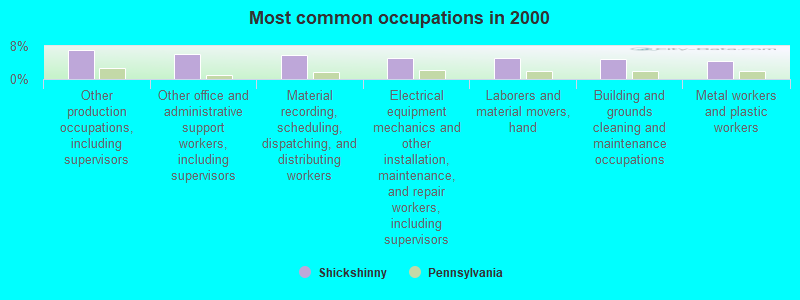
Most common occupations in Shickshinny, PA (%)
Both Males Females
Other production occupations, including supervisors (7.0%)
Other office and administrative support workers, including supervisors (6.1%)
Material recording, scheduling, dispatching, and distributing workers (5.8%)
Electrical equipment mechanics and other installation, maintenance, and repair workers, including supervisors (5.0%)
Laborers and material movers, hand (5.0%)
Building and grounds cleaning and maintenance occupations (4.7%)
Metal workers and plastic workers (4.5%)
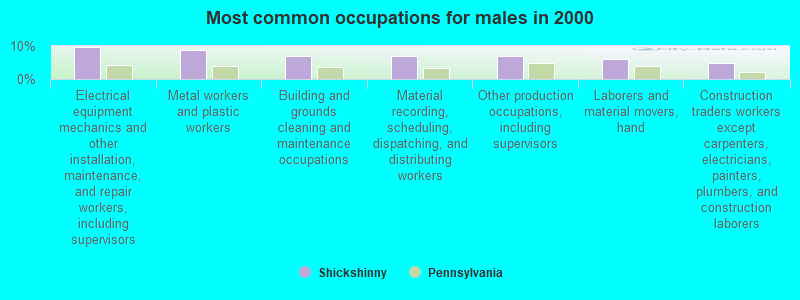
Electrical equipment mechanics and other installation, maintenance, and repair workers, including supervisors (9.8%)
Metal workers and plastic workers (8.7%)
Building and grounds cleaning and maintenance occupations (7.1%)
Material recording, scheduling, dispatching, and distributing workers (7.1%)
Other production occupations, including supervisors (7.1%)
Laborers and material movers, hand (6.0%)
Construction traders workers except carpenters, electricians, painters, plumbers, and construction laborers (4.9%)
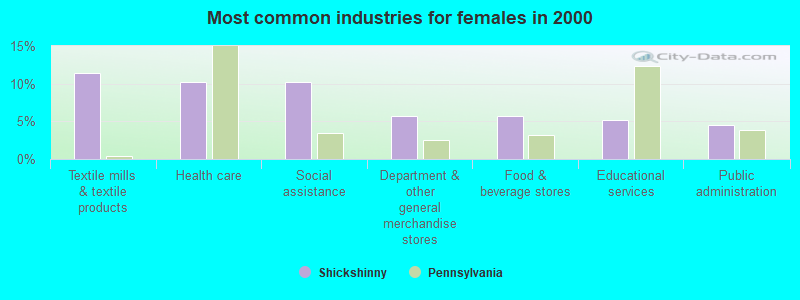
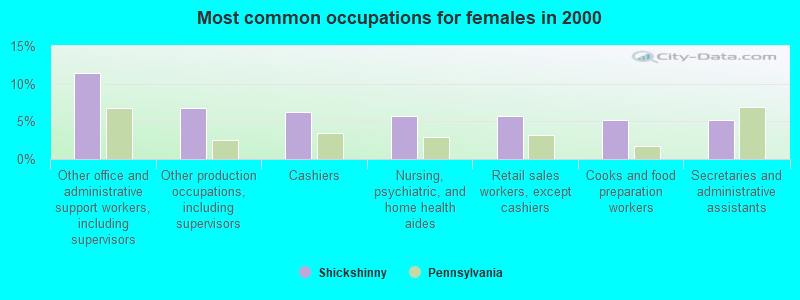
Other office and administrative support workers, including supervisors (11.4%)
Other production occupations, including supervisors (6.8%)
Cashiers (6.2%)
Nursing, psychiatric, and home health aides (5.7%)
Retail sales workers, except cashiers (5.7%)
Cooks and food preparation workers (5.1%)
Secretaries and administrative assistants (5.1%)
Tornado activity:
Shickshinny-area historical tornado activity is near Pennsylvania state average. It is 24% smaller than the overall U.S. average.
On 6/2/1998, a category F3 (max. wind speeds 158-206 mph) tornado 32.7 miles away from the Shickshinny borough center killed 2 people and injured 15 people and caused $2 million in damages.
On 7/29/1976, a category F3 tornado 33.1 miles away from the borough center caused between $500,000 and $5,000,000 in damages.
Earthquake activity:
Shickshinny-area historical earthquake activity is significantly above Pennsylvania state average. It is 65% smaller than the overall U.S. average. On 8/23/2011 at 17:51:04, a magnitude 5.8 (5.8 MW, Depth: 3.7 mi, Class: Moderate, Intensity: VI - VII) earthquake occurred 243.8 miles away from the city center On 1/16/1994 at 01:49:16, a magnitude 4.6 (4.6 MB, 4.6 LG, Depth: 3.1 mi, Class: Light, Intensity: IV - V) earthquake occurred 57.3 miles away from the city center On 10/7/1983 at 10:18:46, a magnitude 5.3 (5.1 MB, 5.3 LG, 5.1 ML) earthquake occurred 214.4 miles away from the city center On 9/25/1998 at 19:52:52, a magnitude 5.2 (4.8 MB, 4.3 MS, 5.2 LG, 4.5 MW, Depth: 3.1 mi) earthquake occurred 221.7 miles away from Shickshinny center On 4/20/2002 at 10:50:47, a magnitude 5.3 (5.3 ML, Depth: 3.0 mi) earthquake occurred 263.5 miles away from the city center On 1/16/1994 at 00:42:43, a magnitude 4.2 (4.2 MB, 4.0 LG, Depth: 3.1 mi) earthquake occurred 57.7 miles away from Shickshinny center Magnitude types: regional Lg-wave magnitude (LG), body-wave magnitude (MB), local magnitude (ML), surface-wave magnitude (MS), moment magnitude (MW) Natural disasters: The number of natural disasters in Luzerne County (20) is greater than the US average (15).Major Disasters (Presidential) Declared: 15Emergencies Declared: 5Floods: 6, Storms: 6, Hurricanes: 5, Tropical Storms: 3, Winter Storms: 2, Blizzard: 1, Heavy Rain: 1, Mudslide: 1, Snowfall: 1, Snowstorm: 1, Tropical Depression: 1, Other: 1 (Note: some incidents may be assigned to more than one category). Hospitals and medical centers near Shickshinny: BERWICK HOSPITAL CENTER (about 8 miles away; BERWICK, PA)
BERWICK RETIREMENT VILLAGE NRS (Nursing Home, about 8 miles away; BERWICK, PA)
GUARDIAN ELDER CARE CENTER (Nursing Home, about 8 miles away; NANTICOKE, PA)
BERWICK HOME HEALTH HOSPICE CA (Hospital, about 8 miles away; BERWICK, PA)
FRESENIUS MEDICAL CARE NANTICOKE (Dialysis Facility, about 8 miles away; NANTICOKE, PA)
FRESENIUS MEDICAL CARE BERWICK (Dialysis Facility, about 9 miles away; BERWICK, PA)
MERCY HOME CARE (Home Health Center, about 9 miles away; NANTICOKE, PA)
Operable nuclear power plants near Shickshinny:
9 miles: Susquehanna 1 and 2 in Berwick, PA.
Colleges/universities with over 2000 students nearest to Shickshinny:
Luzerne County Community College (about 9 miles; Nanticoke, PA ; Full-time enrollment: 4,724)
Wilkes University (about 16 miles; Wilkes-Barre, PA ; FT enrollment: 3,912)
King's College (about 16 miles; Wilkes-Barre, PA ; FT enrollment: 2,392)
Misericordia University (about 17 miles; Dallas, PA ; FT enrollment: 2,554)
Bloomsburg University of Pennsylvania (about 19 miles; Bloomsburg, PA ; FT enrollment: 9,452)
University of Scranton (about 32 miles; Scranton, PA ; FT enrollment: 5,488)
Marywood University (about 34 miles; Scranton, PA ; FT enrollment: 2,959)
Public high school in Shickshinny: NORTHWEST AREA HS Location: 243 THORNE HILL RD, Grades: 7-12)
Public elementary/middle schools in Shickshinny: NORTHWEST AREA PRIMARY SCH Students: 698, Location: 417 SHICKSHINNY LAKE RD, Grades: KG-2)NORTHWEST AREA INTERMEDIATE SCH Location: 21 SUNSET LAKE RD, Grades: 3-6)
See full list of schools located in Shickshinny Birthplace of: Ryan McGlynn - Nextel Cup series NASCAR driver (born : Nov 22, 1974), Carl Sawatski - Baseball player, Lee Vincent - Musician.
Luzerne County has a predicted average indoor radon screening level greater than 4 pCi/L (pico curies per liter) - Highest Potential Drinking water stations with addresses in Shickshinny and their reported violations in the past:
NINOS PIZZA (Population served: 50, Groundwater):
Past monitoring violations:
6 routine major monitoring violations
2 regular monitoring violations
Population served: 35, Groundwater):
Past monitoring violations:
3 regular monitoring violations
Population served: 30, Groundwater):
Past health violations:
MCL, Monthly (TCR) - Between JUL-2013 and SEP-2013, Contaminant: Coliform. Follow-up actions: St Public Notif requested (NOV-07-2013), St Violation/Reminder Notice (NOV-07-2013), St Public Notif received (NOV-07-2013), St Compliance achieved (JAN-03-2014)
MCL, Monthly (TCR) - In OCT-2011, Contaminant: Coliform. Follow-up actions: St Public Notif requested (DEC-22-2011), St Site Visit (enforcement) (DEC-22-2011), St Public Notif received (DEC-22-2011), St Compliance achieved (MAR-05-2012)
Past monitoring violations:
Monitoring, Source Water (GWR) - Between JUL-06-2013 and AUG-06-2013, Contaminant: E. COLI. Follow-up actions: St Public Notif requested (AUG-30-2013), St Violation/Reminder Notice (AUG-30-2013), St Compliance achieved (AUG-30-2013), St Public Notif received (JAN-03-2014)
Monitoring, Source Water (GWR) - Between OCT-03-2011 and NOV-03-2011, Contaminant: E. COLI. Follow-up actions: St Formal NOV issued (DEC-22-2011), St Public Notif requested (DEC-22-2011), St Compliance achieved (JUN-14-2012)
Monitoring, Repeat Major (TCR) - Between JUL-2011 and SEP-2011, Contaminant: Coliform (TCR). Follow-up actions: St Public Notif requested (DEC-22-2011), St Public Notif received (DEC-22-2011), St Compliance achieved (DEC-22-2011), St Site Visit (enforcement) (DEC-22-2011)
8 routine major monitoring violations
Population served: 25, Groundwater):
Past monitoring violations:
3 routine major monitoring violations
Population served: 25, Groundwater):
Past monitoring violations:
2 routine major monitoring violations
Drinking water stations with addresses in Shickshinny that have no violations reported:
HUNTINGTON MILLS GROCERY SHOP (Population served: 30, Primary Water Source Type: Groundwater)
Average household size: This borough:
2.3 peoplePennsylvania:
2.5 people
Percentage of family households: This borough:
59.0%Whole state:
65.0%
Percentage of households with unmarried partners: This borough:
6.2%Whole state:
6.6%
No gay or lesbian households reported
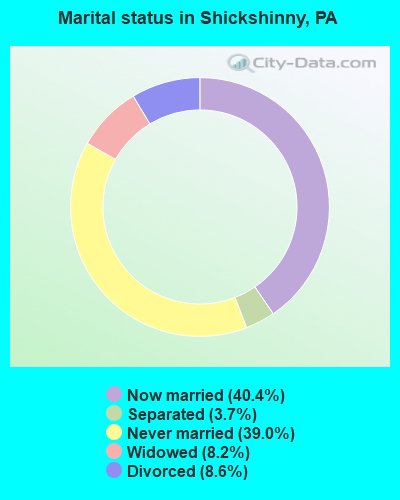
For population 15 years and over in Shickshinny:
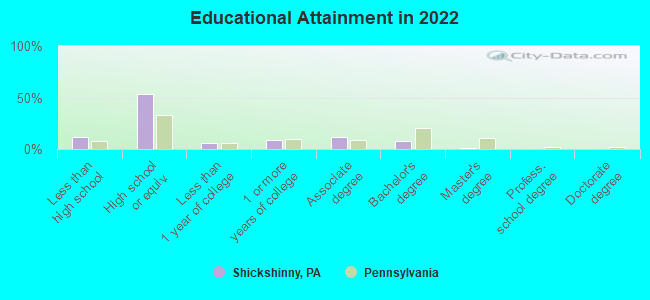
Never married: 39.0%Now married: 40.4%Separated: 3.7%Widowed: 8.2%Divorced: 8.6% For population 25 years and over in Shickshinny:
High school or higher: 86.9%Bachelor's degree or higher: 9.0%Graduate or professional degree: 1.5%Unemployed: 10.9%Mean travel time to work (commute): 23.7 minutes
Education Gini index (Inequality in education) Here:
8.9Pennsylvania average:
11.4
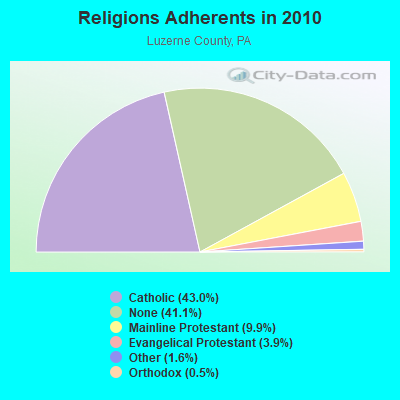
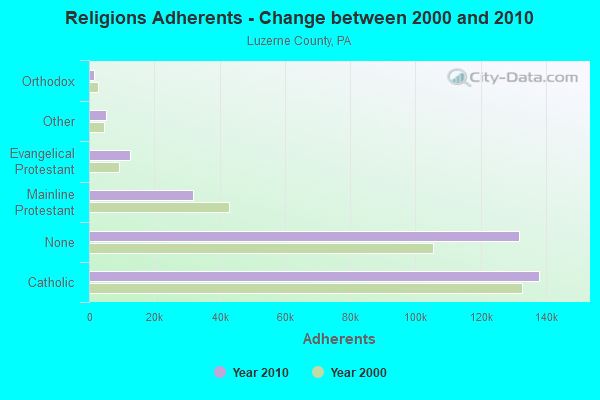
Religion statistics for Shickshinny, PA (based on Luzerne County data)
Religion Adherents Congregations Catholic 138,000 75 Mainline Protestant 31,734 142 Evangelical Protestant 12,502 108 Other 5,134 17 Orthodox 1,667 12 Black Protestant 118 1 None 131,763 -
Source: Clifford Grammich, Kirk Hadaway, Richard Houseal, Dale E.Jones, Alexei Krindatch, Richie Stanley and Richard H.Taylor. 2012. 2010 U.S.Religion Census: Religious Congregations & Membership Study. Association of Statisticians of American Religious Bodies. Jones, Dale E., et al. 2002. Congregations and Membership in the United States 2000. Nashville, TN: Glenmary Research Center. Graphs represent county-level data
Food Environment Statistics: Number of grocery stores : 65Luzerne County :
2.08 / 10,000 pop.Pennsylvania :
2.04 / 10,000 pop.
Number of supercenters and club stores : 2Luzerne County :
0.06 / 10,000 pop.Pennsylvania :
0.09 / 10,000 pop.
Number of convenience stores (no gas) : 34Luzerne County :
1.09 / 10,000 pop.Pennsylvania :
0.88 / 10,000 pop.
Number of convenience stores (with gas) : 96Luzerne County :
3.08 / 10,000 pop.State :
2.52 / 10,000 pop.
Number of full-service restaurants : 294This county :
9.42 / 10,000 pop.State :
7.12 / 10,000 pop.
Adult diabetes rate : Here :
9.6%Pennsylvania :
9.1%
Adult obesity rate : Luzerne County :
27.4%Pennsylvania :
27.2%
Low-income preschool obesity rate : Luzerne County :
9.6%Pennsylvania :
11.5%
Health and Nutrition: Healthy diet rate : This city:
49.3%State:
50.2%
Average overall health of teeth and gums : This city:
43.6%Pennsylvania:
47.1%
Average BMI : This city:
28.8Pennsylvania:
28.7
People feeling badly about themselves : This city:
17.8%Pennsylvania:
20.8%
People not drinking alcohol at all : Shickshinny:
7.6%Pennsylvania:
10.9%
Average hours sleeping at night : Shickshinny:
6.8Pennsylvania:
6.8
Overweight people : Shickshinny:
25.9%Pennsylvania:
34.3%
General health condition : This city:
57.4%Pennsylvania:
56.2%
Average condition of hearing : More about Health and Nutrition of Shickshinny, PA Residents
Local government employment and payroll (March 2022)
Function
Full-time employees
Monthly full-time payroll
Average yearly full-time wage
Part-time employees
Monthly part-time payroll
Financial Administration
0 $0 1 $1,637 Other Government Administration
0 $0 11 $4,632
Totals for Government
0 $0 12 $6,270
Shickshinny government finances - Expenditure in 2017 (per resident):
Current Operations - Regular Highways: $1,728,000 ($2747.22)
Housing and Community Development: $151,000 ($240.06)General - Other: $73,000 ($116.06)Central Staff Services: $40,000 ($63.59)Parks and Recreation: $30,000 ($47.69)Judicial and Legal Services: $18,000 ($28.62)General Public Buildings: $12,000 ($19.08)Protective Inspection and Regulation - Other: $9,000 ($14.31)Financial Administration: $8,000 ($12.72)Police Protection: $6,000 ($9.54)Local Fire Protection: $4,000 ($6.36)Miscellaneous Commercial Activities - Other: $1,000 ($1.59)Total Salaries and Wages: $63,000 ($100.16)
Shickshinny government finances - Revenue in 2017 (per resident):
Local Intergovernmental - Other: $1,917,000 ($3047.69)
General Local Government Support: $1,000 ($1.59)Miscellaneous - Rents: $27,000 ($42.93)
Fines and Forfeits: $3,000 ($4.77)Donations From Private Sources: $1,000 ($1.59)State Intergovernmental - Housing and Community Development: $97,000 ($154.21)
Highways: $35,000 ($55.64)Other: $4,000 ($6.36)Tax - Individual Income: $55,000 ($87.44)
Property: $34,000 ($54.05)Public Utility License: $7,000 ($11.13)Documentary and Stock Transfer: $7,000 ($11.13)Occupation and Business License - Other: $6,000 ($9.54)
Shickshinny government finances - Cash and Securities in 2017 (per resident):
Other Funds - Cash and Securities: $192,000 ($305.25)
4.53% of this county's 2021 resident taxpayers lived in other counties in 2020 ($51,556 average adjusted gross income )
Here:
4.53%Pennsylvania average:
5.27%
0.02% of residents moved from foreign countries ($67 average AGI )Luzerne County:
0.02%Pennsylvania average:
0.01%
Top counties from which taxpayers relocated into this county between 2020 and 2021:
3.97% of this county's 2020 resident taxpayers moved to other counties in 2021 ($53,147 average adjusted gross income )
Here:
3.97%Pennsylvania average:
5.44%
0.02% of residents moved to foreign countries ($144 average AGI )Luzerne County:
0.02%Pennsylvania average:
0.01%
Top counties to which taxpayers relocated from this county between 2020 and 2021: Businesses in Shickshinny, PA
Strongest AM radio stations in Shickshinny:
WILK (980 AM; 5 kW; WILKES-BARRE, PA; Owner: ENTERCOM WILKES-BARRE SCRANTON, LLC)
WNAK (730 AM; 1 kW; NANTICOKE, PA; Owner: SEVEN-THIRTY BROADCASTERS, INC.)
WWJZ (640 AM; 50 kW; MOUNT HOLLY, NJ; Owner: ABC, INC.)
WOGY (1300 AM; 5 kW; WEST HAZLETON, PA; Owner: ENTERCOM WILKES-BARRE SCRANTON, LLC)
WFBS (1280 AM; 1 kW; BERWICK, PA; Owner: FBS WIRELESS CORPORATION)
WITK (1550 AM; 10 kW; PITTSTON, PA; Owner: ROBERT C. CORDARO, INC.)
WARM (590 AM; 5 kW; SCRANTON, PA; Owner: CITADEL BROADCASTING COMPANY)
WRKK (1200 AM; 10 kW; HUGHESVILLE, PA; Owner: CLEAR CHANNEL BROADCASTING LICENSES, INC.)
WEEU (830 AM; 20 kW; READING, PA; Owner: WEEU BROADCASTING COMPANY)
WVCH (740 AM; 50 kW; CHESTER, PA; Owner: WVCH COMMUNICATIONS, INC.)
WZZD (990 AM; 50 kW; PHILADELPHIA, PA; Owner: PENNSYLVANIA MEDIA ASSOCIATES, INC.)
WMCA (570 AM; 50 kW; NEW YORK, NY; Owner: SALEM MEDIA OF NEW YORK, LLC)
KYW (1060 AM; 50 kW; PHILADELPHIA, PA; Owner: INFINITY BROADCASTING OPERATIONS, INC.)
Strongest FM radio stations in Shickshinny:
WBSX (97.9 FM; HAZLETON, PA; Owner: CITADEL BROADCASTING COMPANY)
WMGS (92.9 FM; WILKES-BARRE, PA; Owner: CITADEL BROADCASTING COMPANY)
WVIA-FM (89.9 FM; SCRANTON, PA; Owner: NORTHEASTERN PENNSYLVANIA EDUCATIONAL TV ASSN.)
WBHT (97.1 FM; MOUNTAIN TOP, PA; Owner: CITADEL BROADCASTING COMPANY)
WCLH (90.7 FM; WILKES-BARRE, PA; Owner: WILKES COLLEGE)
W219CG (91.7 FM; WILKER-BARRE, PA; Owner: PENSACOLA CHRISTIAN COLLEGE, INC.)
WQFM (92.1 FM; NANTICOKE, PA; Owner: THE SCRANTON TIMES, L.P.)
WKRZ (98.5 FM; WILKES-BARRE, PA; Owner: ENTERCOM WILKES-BARRE SCRANTON, LLC)
WCWQ (93.7 FM; DALLAS, PA; Owner: CITADEL BROADCASTING COMPANY)
WKAB (103.5 FM; BERWICK, PA; Owner: 4M BROADCASTING, INC.)
WFYY (106.5 FM; BLOOMSBURG, PA; Owner: RADIO FRIENDZ, INC.)
WAMT (103.1 FM; FREELAND, PA; Owner: ENTERCOM WILKES-BARRE SCRANTON, LLC)
W299AF (107.7 FM; CATAWISSA, PA; Owner: SALT & LIGHT MEDIA MINISTRIES, INC.)
WCWY (107.7 FM; TUNKHANNOCK, PA; Owner: CITADEL BROADCASTING COMPANY)
WEZX (106.9 FM; SCRANTON, PA; Owner: THE SCRANTON TIMES, L.P.)
W288BE (105.5 FM; WILKES-BARRE, PA; Owner: LUZERNE COUNTY COMMUNITY COLLEGE)
WGGY (101.3 FM; SCRANTON, PA; Owner: ENTERCOM WILKES-BARRE SCRANTON, LLC)
WRGN (88.1 FM; SWEET VALLEY, PA; Owner: GOSPEL MEDIA INSTITUTE, INC.)
WWDL-FM (104.9 FM; SCRANTON, PA; Owner: LANE BROADCASTING CORPORATION)
WGGI (95.9 FM; BENTON, PA; Owner: ENTERCOM WILKES-BARRE SCRANTON, LLC)
TV broadcast stations around Shickshinny:
W68CE (Channel 68; SHICKSHINNY, PA; Owner: TRIPLE J COMMUNITY BROADCASTING., L.L.C.)
WBRE-TV (Channel 28; WILKES-BARRE, PA; Owner: NEXSTAR BROADCASTING OF NORTHEASTERN PENNSYLVANIA, L.L.C.)
WYOU (Channel 22; SCRANTON, PA; Owner: MISSION BROADCASTING, INC.)
WNEP-TV (Channel 16; SCRANTON, PA; Owner: NEW YORK TIMES MANAGEMENT SERVICES)
WVIA-TV (Channel 44; SCRANTON, PA; Owner: NE PA ED TV ASSOCIATION)
WOLF-TV (Channel 56; HAZLETON, PA; Owner: WOLF LICENSE CORP.)
W07BV (Channel 7; WILKES-BARRE, ETC., PA; Owner: CATHOLIC BROADCASTING OF SCRANTON, INC.)
W67DE (Channel 67; NEWPORT, PA; Owner: TRIPLE J COMMUNITY BROADCASTING., L.L.C.)
WQPX (Channel 64; SCRANTON, PA; Owner: PAXSON SCRANTON LICENSE, INC.)
W47AO (Channel 47; BERWICK, PA; Owner: TRIPLE J COMMUNITY BROADCASTING., L.L.C.)
W19CI (Channel 19; BERWICK, PA; Owner: CATHOLIC BROADCASTING OF SCRANTON, INC.)
Shickshinny fatal accident list:
May 23, 2019 01:59 PM, Us-11 S Main St, Sr-4004 W Butler St, Lat: 41.150983, Lon: -76.151181, Vehicles: 2, Persons: 4, Fatalities: 1Lat: 41.146140, Lon: -76.149110, Vehicles: 3, Persons: 5, Fatalities: 1, Drunk persons involved: 1Vehicles: 2, Persons: 3, Fatalities: 1Vehicles: 3, Persons: 3, Fatalities: 1, Drunk persons involved: 1Vehicles: 2, Persons: 2, Fatalities: 1, Drunk persons involved: 1Vehicles: 2, Persons: 4, Fatalities: 1
National Bridge Inventory (NBI) Statistics 8 Number of bridges115ft / 34.8m Total length $20,292,000 Total costs16,727 Total average daily traffic970 Total average daily truck traffic25,103 Total future (year 2031) average daily traffic
FCC Registered Antenna Towers: 2
Robin Wesstrom, 21 Sunset Lake Road (Lat: 41.219167 Lon: -76.107500), Type: 79.2, Structure height: 42079 m, Overall height: 79.2 m, Registrant: Keystone Communications, Rwesstrom@keystone-Communications.Com, , North-umberland, Phone: (570) 473-3146 Robin R Wesstrom, 21 Sunset Lake Road (Lat: 41.219167 Lon: -76.107500), Type: 79.2, Structure height: 42079 m, Overall height: 79.2 m, Registrant: Keystone Communications, Rwesstrom@keystone-Communications.Com, , North-umberland, Phone: (570) 473-3146 FCC Registered Broadcast Land Mobile Towers: 7
Huntington Mountain 5300 Ft W Of Int Rt 11 And 239 (Lat: 41.157028 Lon: -76.173000), Structure height: 37 m, Call Sign: KXH338, Assigned Frequencies: 154.755 MHz, 155.505 MHz, 155.670 MHz, Grant Date: 01/04/2024, Expiration Date: 03/25/2034, Registrant: State Police Bcis, 8001 Bretz Dr, Harrisburg, PA 17112, Phone: (717) 787-8596, Fax: (717) 705-4050, Email:
Pa Game Lands 260 2 Mi W (Lat: 41.157028 Lon: -76.173278), Type: Tower, Structure height: 58 m, Call Sign: WPFU618, Assigned Frequencies: 460.475 MHz, Grant Date: 07/23/2004, Expiration Date: 10/13/2014, Cancellation Date: 02/15/2013, Registrant: Comm. Of Pa, Office Of Attorney General, 106 Lowther Street, Lemoyne, PA 17043, Phone: (717) 712-1300, Fax: (717) 712-1257, Email:
Shickshinny Fire Twr (Lat: 41.166472 Lon: -76.149917), Type: Building, Structure height: 14 m, Overall height: 20 m, Call Sign: WNJI344, Assigned Frequencies: 48.1800 MHz, Grant Date: 05/07/2002, Expiration Date: 07/15/2012, Cancellation Date: 03/29/2012, Certifier: Signature On File, Registrant: Ugi Utilities, 1 Ugi Center, Wilkes Barre, PA 18711, Phone: (570) 829-8849, Fax: (570) 829-8743, Email:
Luze04, 1 Miles West Of (Lat: 41.158833 Lon: -76.169111), Type: Tower, Structure height: 54.9 m, Overall height: 59.4 m, Call Sign: WPWJ886, Assigned Frequencies: 851.687 MHz, 852.037 MHz, Grant Date: 11/09/2022, Expiration Date: 12/03/2032, Certifier: Donald R Appleby Jr, Registrant: Commonwealth Of Pennsylvania, 8001 Bretz Dr., Harrisburg, PA 17112, Phone: (717) 425-5490, Fax: (717) 772-8097, Email:
SHICKSHINNY, Shickshinny Remote (Lat: 41.167222 Lon: -76.151944), Type: Tower, Structure height: 30.5 m, Call Sign: WQHR890, Assigned Frequencies: 155.925 MHz, Grant Date: 10/31/2017, Expiration Date: 10/19/2027, Certifier: John Ankenbrand, Registrant: Luzerne County 911, 100 Young St, Wilkes Barre, PA 18706, Phone: (570) 826-3059, Fax: (570) 826-3056, Email:
Lat: 41.184167 Lon: -76.187750, Call Sign: WQJR989, Assigned Frequencies: 464.462 MHz, 469.462 MHz, 463.437 MHz, 464.837 MHz, 463.212 MHz, Grant Date: 12/09/2008, Expiration Date: 12/09/2018, Cancellation Date: 02/16/2019, Certifier: Ryan Craig, Registrant: Washington Radio Reports, 1588 Fairfield Road Ste 7, Gettysburg, PA 17325, Phone: (717) 334-0668, Fax: (717) 334-6440, Email:
Lat: 41.206083 Lon: -76.138194, Call Sign: WQVY918, Assigned Frequencies: 158.880 MHz, Grant Date: 06/18/2015, Expiration Date: 06/18/2025, Certifier: Lori A Ragazzo, Registrant: Washington Radio Reports, Gettysburg, PA 17325, Phone: (717) 334-0668, Fax: (717) 334-6440, Email:
FCC Registered Microwave Towers: 10 (
See the full list of FCC Registered Microwave Towers in this town )
FCC Registered Amateur Radio Licenses: 33 (
See the full list of FCC Registered Amateur Radio Licenses in Shickshinny )
FAA Registered Aircraft: 2
Aircraft: CESSNA 172A (Category: Land, Seats: 4, Weight: Up to 12,499 Pounds, Speed: 105 mph), Engine: CONT MOTOR 0-300 SER (145 HP) (Reciprocating)N-Number: 172R, N172R, N-172R, Serial Number: 47349, Year manufactured: 1961, Airworthiness Date: 02/19/1960, Certificate Issue Date: 09/09/2013Registrant (Individual): Jeffrey Hartman, 1027 State Route 11, Shickshinny, PA 18655Aircraft: KLUSMIER LAWRENCE A RV-6A (Category: Land, Seats: 2, Weight: Up to 12,499 Pounds), Engine: LYCOMING 0-320 SERIES (180 HP) (Reciprocating)N-Number: 17LD, N17LD, N-17LD, Serial Number: 21385, Airworthiness Date: 01/15/2002, Certificate Issue Date: 11/15/1994Registrant (Individual): Lawrence A Klusmier, 1076 Shickshinny Valley Rd, Shickshinny, PA 18655
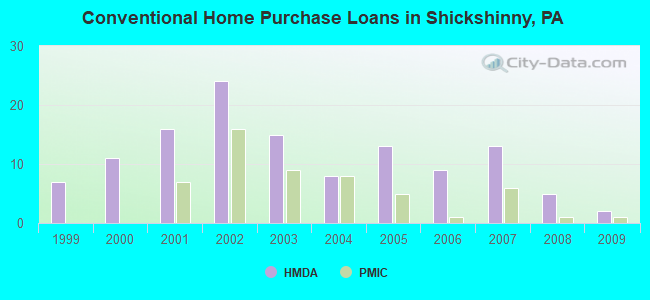
Home Mortgage Disclosure Act Aggregated Statistics For Year 2009(Based on 1 full tract) A) FHA, FSA/RHS & VA B) Conventional C) Refinancings D) Home Improvement Loans F) Non-occupant Loans on Number Average Value Number Average Value Number Average Value Number Average Value Number Average Value
LOANS ORIGINATED 4 $64,500 2 $43,500 4 $70,500 4 $38,750 0 $0 APPLICATIONS APPROVED, NOT ACCEPTED 0 $0 0 $0 0 $0 1 $25,000 0 $0 APPLICATIONS DENIED 2 $53,500 1 $44,000 8 $58,625 2 $56,500 0 $0 APPLICATIONS WITHDRAWN 0 $0 1 $26,000 4 $82,250 0 $0 1 $35,000 FILES CLOSED FOR INCOMPLETENESS 0 $0 0 $0 2 $108,000 0 $0 0 $0
Aggregated Statistics For Year 2008(Based on 1 full tract) A) FHA, FSA/RHS & VA B) Conventional C) Refinancings D) Home Improvement Loans F) Non-occupant Loans on Number Average Value Number Average Value Number Average Value Number Average Value Number Average Value
LOANS ORIGINATED 2 $72,000 5 $40,800 5 $56,600 4 $33,000 0 $0 APPLICATIONS APPROVED, NOT ACCEPTED 0 $0 4 $60,000 0 $0 1 $10,000 1 $10,000 APPLICATIONS DENIED 1 $61,000 2 $26,500 6 $47,833 8 $20,500 0 $0 APPLICATIONS WITHDRAWN 0 $0 1 $124,000 2 $139,500 1 $81,000 0 $0 FILES CLOSED FOR INCOMPLETENESS 0 $0 0 $0 0 $0 0 $0 0 $0
Aggregated Statistics For Year 2007(Based on 1 full tract) A) FHA, FSA/RHS & VA B) Conventional C) Refinancings D) Home Improvement Loans E) Loans on Dwellings For 5+ Families F) Non-occupant Loans on Number Average Value Number Average Value Number Average Value Number Average Value Number Average Value Number Average Value
LOANS ORIGINATED 3 $120,667 13 $63,692 25 $75,760 15 $23,200 0 $0 6 $52,833 APPLICATIONS APPROVED, NOT ACCEPTED 1 $50,000 0 $0 0 $0 2 $11,500 0 $0 0 $0 APPLICATIONS DENIED 0 $0 6 $55,500 18 $100,833 20 $26,300 1 $7,000 2 $37,500 APPLICATIONS WITHDRAWN 0 $0 1 $31,000 12 $73,000 3 $110,333 0 $0 1 $31,000 FILES CLOSED FOR INCOMPLETENESS 0 $0 1 $108,000 3 $75,000 0 $0 0 $0 0 $0
Aggregated Statistics For Year 2006(Based on 1 full tract) B) Conventional C) Refinancings D) Home Improvement Loans F) Non-occupant Loans on G) Loans On Manufactured Number Average Value Number Average Value Number Average Value Number Average Value Number Average Value
LOANS ORIGINATED 9 $95,000 18 $85,167 7 $19,571 7 $102,286 0 $0 APPLICATIONS APPROVED, NOT ACCEPTED 3 $71,333 5 $97,200 2 $51,000 0 $0 0 $0 APPLICATIONS DENIED 7 $41,429 32 $86,938 21 $28,857 0 $0 3 $60,333 APPLICATIONS WITHDRAWN 1 $140,000 15 $84,867 0 $0 0 $0 0 $0 FILES CLOSED FOR INCOMPLETENESS 0 $0 7 $87,429 0 $0 0 $0 0 $0
Aggregated Statistics For Year 2005(Based on 1 full tract) A) FHA, FSA/RHS & VA B) Conventional C) Refinancings D) Home Improvement Loans F) Non-occupant Loans on G) Loans On Manufactured Number Average Value Number Average Value Number Average Value Number Average Value Number Average Value Number Average Value
LOANS ORIGINATED 3 $72,000 13 $72,692 16 $52,812 6 $31,500 4 $39,500 0 $0 APPLICATIONS APPROVED, NOT ACCEPTED 0 $0 7 $39,429 6 $58,000 1 $40,000 3 $52,000 1 $77,000 APPLICATIONS DENIED 0 $0 9 $53,667 34 $74,647 16 $22,438 1 $35,000 2 $26,000 APPLICATIONS WITHDRAWN 0 $0 1 $83,000 17 $106,824 4 $92,250 0 $0 0 $0 FILES CLOSED FOR INCOMPLETENESS 0 $0 0 $0 0 $0 0 $0 0 $0 0 $0
Aggregated Statistics For Year 2004(Based on 1 full tract) A) FHA, FSA/RHS & VA B) Conventional C) Refinancings D) Home Improvement Loans F) Non-occupant Loans on G) Loans On Manufactured Number Average Value Number Average Value Number Average Value Number Average Value Number Average Value Number Average Value
LOANS ORIGINATED 1 $60,000 8 $55,000 25 $67,640 6 $21,000 2 $43,500 1 $60,000 APPLICATIONS APPROVED, NOT ACCEPTED 0 $0 1 $42,000 9 $61,222 1 $50,000 0 $0 1 $42,000 APPLICATIONS DENIED 1 $45,000 10 $58,200 38 $79,895 6 $21,667 3 $39,667 3 $32,000 APPLICATIONS WITHDRAWN 0 $0 2 $38,500 15 $76,400 1 $17,000 1 $32,000 0 $0 FILES CLOSED FOR INCOMPLETENESS 0 $0 1 $41,000 1 $88,000 1 $65,000 1 $88,000 0 $0
Aggregated Statistics For Year 2003(Based on 1 full tract) A) FHA, FSA/RHS & VA B) Conventional C) Refinancings D) Home Improvement Loans F) Non-occupant Loans on Number Average Value Number Average Value Number Average Value Number Average Value Number Average Value
LOANS ORIGINATED 1 $81,000 15 $66,467 40 $69,125 7 $35,571 7 $41,714 APPLICATIONS APPROVED, NOT ACCEPTED 0 $0 4 $72,750 12 $75,333 5 $37,400 0 $0 APPLICATIONS DENIED 0 $0 9 $44,556 49 $67,633 7 $26,571 0 $0 APPLICATIONS WITHDRAWN 0 $0 1 $144,000 37 $69,757 0 $0 0 $0 FILES CLOSED FOR INCOMPLETENESS 0 $0 1 $41,000 2 $57,500 0 $0 0 $0
Aggregated Statistics For Year 2002(Based on 1 full tract) A) FHA, FSA/RHS & VA B) Conventional C) Refinancings D) Home Improvement Loans F) Non-occupant Loans on Number Average Value Number Average Value Number Average Value Number Average Value Number Average Value
LOANS ORIGINATED 1 $62,000 24 $52,292 37 $70,135 6 $43,500 4 $37,250 APPLICATIONS APPROVED, NOT ACCEPTED 0 $0 3 $95,333 14 $84,714 0 $0 2 $100,500 APPLICATIONS DENIED 0 $0 4 $109,000 36 $67,667 9 $34,000 0 $0 APPLICATIONS WITHDRAWN 0 $0 5 $106,400 11 $70,727 2 $29,500 1 $11,000 FILES CLOSED FOR INCOMPLETENESS 0 $0 2 $42,000 6 $75,000 0 $0 0 $0
Aggregated Statistics For Year 2001(Based on 1 full tract) A) FHA, FSA/RHS & VA B) Conventional C) Refinancings D) Home Improvement Loans F) Non-occupant Loans on Number Average Value Number Average Value Number Average Value Number Average Value Number Average Value
LOANS ORIGINATED 4 $65,250 16 $69,062 49 $72,184 13 $26,923 5 $52,200 APPLICATIONS APPROVED, NOT ACCEPTED 0 $0 4 $42,500 14 $70,643 2 $13,500 2 $90,500 APPLICATIONS DENIED 1 $38,000 9 $32,667 25 $62,840 4 $20,250 1 $50,000 APPLICATIONS WITHDRAWN 1 $97,000 5 $65,000 17 $79,353 1 $6,000 1 $49,000 FILES CLOSED FOR INCOMPLETENESS 0 $0 0 $0 4 $82,750 0 $0 0 $0
Aggregated Statistics For Year 2000(Based on 1 full tract) A) FHA, FSA/RHS & VA B) Conventional C) Refinancings D) Home Improvement Loans F) Non-occupant Loans on Number Average Value Number Average Value Number Average Value Number Average Value Number Average Value
LOANS ORIGINATED 5 $56,400 11 $68,000 35 $45,857 12 $29,167 2 $90,500 APPLICATIONS APPROVED, NOT ACCEPTED 0 $0 2 $42,500 8 $56,500 3 $28,000 1 $53,000 APPLICATIONS DENIED 1 $94,000 5 $46,400 23 $66,174 10 $30,400 0 $0 APPLICATIONS WITHDRAWN 0 $0 4 $53,750 9 $51,222 0 $0 0 $0 FILES CLOSED FOR INCOMPLETENESS 0 $0 0 $0 2 $73,000 0 $0 0 $0
Aggregated Statistics For Year 1999(Based on 1 partial tract) A) FHA, FSA/RHS & VA B) Conventional C) Refinancings D) Home Improvement Loans F) Non-occupant Loans on Number Average Value Number Average Value Number Average Value Number Average Value Number Average Value
LOANS ORIGINATED 2 $50,045 7 $85,600 24 $59,852 16 $20,416 1 $56,130 APPLICATIONS APPROVED, NOT ACCEPTED 0 $0 2 $33,475 12 $59,345 1 $7,440 0 $0 APPLICATIONS DENIED 0 $0 5 $35,574 20 $45,076 11 $19,121 1 $14,200 APPLICATIONS WITHDRAWN 0 $0 3 $60,190 11 $46,480 0 $0 1 $13,530 FILES CLOSED FOR INCOMPLETENESS 0 $0 0 $0 5 $44,366 0 $0 0 $0
Detailed HMDA statistics for the following Tracts:
2160.00
Private Mortgage Insurance Companies Aggregated Statistics For Year 2009(Based on 1 full tract) A) Conventional Number Average Value
LOANS ORIGINATED 1 $59,000 APPLICATIONS APPROVED, NOT ACCEPTED 0 $0 APPLICATIONS DENIED 0 $0 APPLICATIONS WITHDRAWN 0 $0 FILES CLOSED FOR INCOMPLETENESS 0 $0
Aggregated Statistics For Year 2008(Based on 1 full tract) A) Conventional Number Average Value
LOANS ORIGINATED 1 $43,000 APPLICATIONS APPROVED, NOT ACCEPTED 0 $0 APPLICATIONS DENIED 0 $0 APPLICATIONS WITHDRAWN 0 $0 FILES CLOSED FOR INCOMPLETENESS 0 $0
Aggregated Statistics For Year 2007(Based on 1 full tract) A) Conventional B) Refinancings Number Average Value Number Average Value
LOANS ORIGINATED 6 $48,500 1 $72,000 APPLICATIONS APPROVED, NOT ACCEPTED 0 $0 1 $56,000 APPLICATIONS DENIED 0 $0 0 $0 APPLICATIONS WITHDRAWN 0 $0 0 $0 FILES CLOSED FOR INCOMPLETENESS 0 $0 0 $0
Aggregated Statistics For Year 2006(Based on 1 full tract) A) Conventional B) Refinancings Number Average Value Number Average Value
LOANS ORIGINATED 1 $38,000 0 $0 APPLICATIONS APPROVED, NOT ACCEPTED 0 $0 2 $188,500 APPLICATIONS DENIED 0 $0 0 $0 APPLICATIONS WITHDRAWN 0 $0 0 $0 FILES CLOSED FOR INCOMPLETENESS 0 $0 0 $0
Aggregated Statistics For Year 2005(Based on 1 full tract) A) Conventional B) Refinancings D) Loans On Manufactured Number Average Value Number Average Value Number Average Value
LOANS ORIGINATED 5 $158,600 2 $156,500 0 $0 APPLICATIONS APPROVED, NOT ACCEPTED 0 $0 1 $95,000 0 $0 APPLICATIONS DENIED 1 $61,000 0 $0 1 $61,000 APPLICATIONS WITHDRAWN 0 $0 0 $0 0 $0 FILES CLOSED FOR INCOMPLETENESS 0 $0 0 $0 0 $0
Aggregated Statistics For Year 2004(Based on 1 full tract) A) Conventional B) Refinancings C) Non-occupant Loans on D) Loans On Manufactured Number Average Value Number Average Value Number Average Value Number Average Value
LOANS ORIGINATED 8 $71,500 6 $96,333 2 $48,000 1 $133,000 APPLICATIONS APPROVED, NOT ACCEPTED 3 $74,000 1 $131,000 0 $0 0 $0 APPLICATIONS DENIED 0 $0 0 $0 0 $0 0 $0 APPLICATIONS WITHDRAWN 0 $0 0 $0 0 $0 0 $0 FILES CLOSED FOR INCOMPLETENESS 0 $0 0 $0 0 $0 0 $0
Aggregated Statistics For Year 2003(Based on 1 full tract) A) Conventional B) Refinancings C) Non-occupant Loans on Number Average Value Number Average Value Number Average Value
LOANS ORIGINATED 9 $100,000 4 $96,000 1 $51,000 APPLICATIONS APPROVED, NOT ACCEPTED 1 $32,000 1 $97,000 0 $0 APPLICATIONS DENIED 0 $0 1 $94,000 0 $0 APPLICATIONS WITHDRAWN 2 $92,500 1 $43,000 1 $43,000 FILES CLOSED FOR INCOMPLETENESS 0 $0 0 $0 0 $0
Aggregated Statistics For Year 2002(Based on 1 full tract) A) Conventional B) Refinancings C) Non-occupant Loans on Number Average Value Number Average Value Number Average Value
LOANS ORIGINATED 16 $69,688 5 $81,400 1 $47,000 APPLICATIONS APPROVED, NOT ACCEPTED 2 $57,000 2 $92,000 0 $0 APPLICATIONS DENIED 0 $0 0 $0 0 $0 APPLICATIONS WITHDRAWN 1 $36,000 1 $87,000 0 $0 FILES CLOSED FOR INCOMPLETENESS 0 $0 0 $0 0 $0
Aggregated Statistics For Year 2001(Based on 1 full tract) A) Conventional B) Refinancings C) Non-occupant Loans on Number Average Value Number Average Value Number Average Value
LOANS ORIGINATED 7 $52,571 4 $96,500 0 $0 APPLICATIONS APPROVED, NOT ACCEPTED 1 $47,000 0 $0 1 $47,000 APPLICATIONS DENIED 1 $121,000 0 $0 0 $0 APPLICATIONS WITHDRAWN 1 $85,000 0 $0 0 $0 FILES CLOSED FOR INCOMPLETENESS 0 $0 0 $0 0 $0
Aggregated Statistics For Year 1999(Based on 1 partial tract) A) Conventional B) Refinancings Number Average Value Number Average Value
LOANS ORIGINATED 0 $0 1 $36,520 APPLICATIONS APPROVED, NOT ACCEPTED 1 $27,050 0 $0 APPLICATIONS DENIED 0 $0 0 $0 APPLICATIONS WITHDRAWN 0 $0 0 $0 FILES CLOSED FOR INCOMPLETENESS 0 $0 0 $0
Detailed PMIC statistics for the following Tracts:
2160.00
Most common first names in Shickshinny, PA among deceased individuals Name Count Lived (average)
John 110 75.4 years Mary 59 81.0 years William 52 70.2 years Anna 46 81.5 years Charles 43 75.3 years Joseph 42 73.5 years Frank 40 71.1 years George 37 74.2 years Helen 37 80.1 years Robert 30 68.6 years
Most common last names in Shickshinny, PA among deceased individuals Last name Count Lived (average)
Killian 25 79.7 years Culver 18 74.5 years Sorber 18 78.7 years Wolfe 18 75.0 years Baer 17 77.3 years Gensel 16 65.4 years Miller 16 77.1 years Belles 15 74.1 years Capece 15 73.1 years Long 14 81.5 years
Shickshinny compared to Pennsylvania state average:
Median household income below state average. Median house value significantly below state average. Black race population percentage significantly below state average. Foreign-born population percentage significantly below state average. Length of stay since moving in significantly above state average. Percentage of population with a bachelor's degree or higher significantly below state average.
Top Patent Applicants
Total of 1 patent application in 2008-2024.


 Recent articles from our blog. Our writers, many of them Ph.D. graduates or candidates, create easy-to-read articles on a wide variety of topics.

 (30.8 miles