Santa Ynez Valley, California
Submit your own pictures of this place and show them to the world
- OSM Map
- General Map
- Google Map
- MSN Map

| Males: 10,741 | |
| Females: 11,157 |
| Median resident age: | 40.6 years |
| California median age: | 33.3 years |
Zip code: 93463
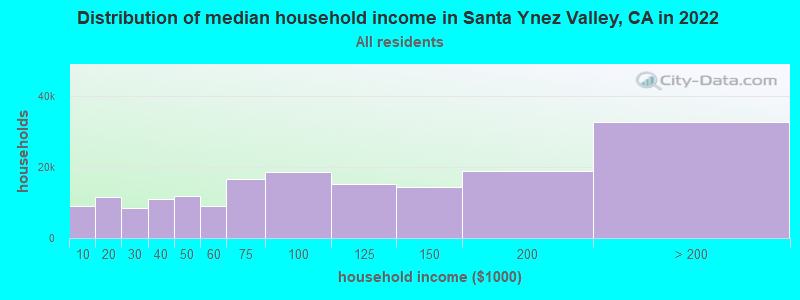
| Santa Ynez Valley: | $106,860 |
| CA: | $91,551 |
Estimated per capita income in 2022: $58,146 (it was $29,949 in 2000)
Santa Ynez Valley CCD income, earnings, and wages data
Estimated median house or condo value in 2022: over $1,000,000 (it was $360,000 in 2000)
| Santa Ynez Valley: | over $1,000,000 |
| CA: | $715,900 |
Mean prices in 2022: all housing units: over $1,000,000; detached houses: over $1,000,000; townhouses or other attached units: $846,704; in 2-unit structures: $831,856; in 3-to-4-unit structures: $952,887; in 5-or-more-unit structures: $595,438; mobile homes: $232,814; occupied boats, rvs, vans, etc.: $45,964
Santa Ynez Valley, CA residents, houses, and apartments details
Detailed information about poverty and poor residents in Santa Ynez Valley, CA
Compare current foreclosures near Santa Ynez Valley, CA:
| Photo | Address | Area | Beds / Baths | Price | Details |
|---|---|---|---|---|---|

|
#1
Avena Rd
Lompoc, CA 93436
|
3,993 sq. feet
|
4 baths 4 beds |
show details | |

|
#2
Cerrito St
Santa Ynez, CA 93460
|
2,198 sq. feet
|
3 baths 3 beds |
show details | |

|
#3
Savanna Dr
Los Alamos, CA 93440
|
1,719 sq. feet
|
2 baths 3 beds |
show details | |

|
#4
Meadowvale Rd
Santa Ynez, CA 93460
|
1,336 sq. feet
|
1 baths 2 beds |
show details | |

|
#5
Elisa Ct
Buellton, CA 93427
|
1,310 sq. feet
|
2 baths 3 beds |
show details | |

|
#6
Kronborg Dr
Solvang, CA 93463
|
1,996 sq. feet
|
2 baths 3 beds |
show details | |

|
#7
Mustang Dr
Santa Ynez, CA 93460
|
2,570 sq. feet
|
2 baths 4 beds |
show details | |

|
#8
Creekside Dr
Solvang, CA 93463
|
2,479 sq. feet
|
2 baths 3 beds |
show details | |

|
#9
Kendale Rd
Buellton, CA 93427
|
1,310 sq. feet
|
2 baths 3 beds |
show details | |

|
#10
Kendale Rd
Buellton, CA 93427
|
1,310 sq. feet
|
2 baths 3 beds |
show details |
| Photo | Address | Area | Beds / Baths | Price | Details |
|---|---|---|---|---|---|

|
#11
Deer Trail Ln
Solvang, CA 93463
|
1,966 sq. feet
|
2 baths 3 beds |
show details | |

|
#12
3rd St
Solvang, CA 93463
|
- sq. feet
|
3 baths 3 beds |
show details | |

|
#13
Ridge Rd
Santa Ynez, CA 93460
|
- sq. feet
|
2 baths 2 beds |
show details | |

|
#14
Elisa Ct
Buellton, CA 93427
|
- sq. feet
|
2 baths 3 beds |
show details | |

|
#15
3rd St
Solvang, CA 93463
|
- sq. feet
|
3 baths 3 beds |
show details | |

|
#16
Paula Ray Ln
Buellton, CA 93427
|
- sq. feet
|
2 baths 4 beds |
show details | |

|
#17
Aarhus Dr # 1
Solvang, CA 93463
|
- sq. feet
|
- baths - beds |
show details | |

|
#18
W Highway 246, Spc 163
Buellton, CA 93427
|
- sq. feet
|
- baths - beds |
show details | |

|
#19
W Highway 246, Spc 82
Buellton, CA 93427
|
- sq. feet
|
- baths - beds |
show details | |

|
#20
Highland Rd
Santa Ynez, CA 93460
|
- sq. feet
|
- baths - beds |
show details |
| Photo | Address | Area | Beds / Baths | Price | Details |
|---|---|---|---|---|---|

|
#21
Oak View Rd
Santa Ynez, CA 93460
|
- sq. feet
|
- baths - beds |
show details | |

|
#22
Zaca St Spc 26
Buellton, CA 93427
|
- sq. feet
|
- baths - beds |
show details | |

|
#23
Cat Canyon Rd
Los Alamos, CA 93440
|
- sq. feet
|
- baths - beds |
show details | |

|
Check over 1 million property listings on Foreclosure.com!
|
browse all offers | |||

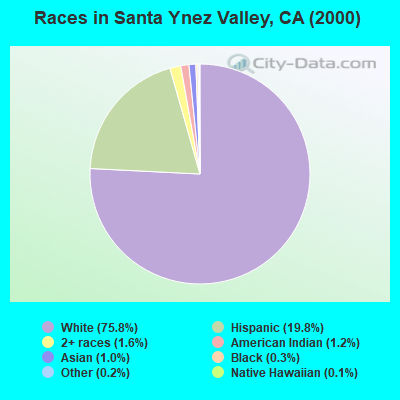
- 16,57175.8%White alone
- 4,31819.8%Hispanic
- 3561.6%Two or more races
- 2701.2%American Indian alone
- 2281.0%Asian alone
- 600.3%Black alone
- 330.2%Other race alone
- 230.1%Native Hawaiian and Other
Pacific Islander alone
 Recent articles from our blog. Our writers, many of them Ph.D. graduates or candidates, create easy-to-read articles on a wide variety of topics.
Current Local Time: PST time zone
Land area: 402.4 square miles.
Population density: 54 people per square mile (very low).

| Santa Ynez Valley CCD: | 0.7% ($2,460) |
| California: | 0.8% ($1,564) |
Nearest city with pop. 50,000+: Lompoc Valley, CA (17.9 miles  , pop. 58,301).
Nearest city with pop. 200,000+: Bakersfield, CA (78.9 miles , pop. 247,057).
Nearest city with pop. 1,000,000+: Los Angeles, CA (107.2 miles , pop. 3,694,820).
Nearest cities:
), ), )Latitude: 34.65 N, Longitude: 120.13 W
Area code commonly used in this area: 805

| Here: | 4.5% |
| California: | 5.1% |
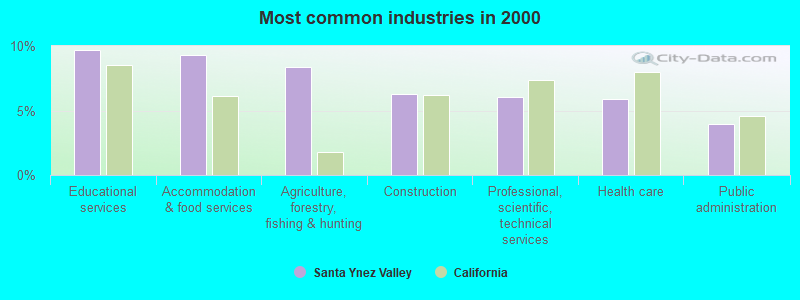
- Educational services (9.7%)
- Accommodation & food services (9.3%)
- Agriculture, forestry, fishing & hunting (8.4%)
- Construction (6.3%)
- Professional, scientific, technical services (6.1%)
- Health care (5.9%)
- Public administration (4.0%)
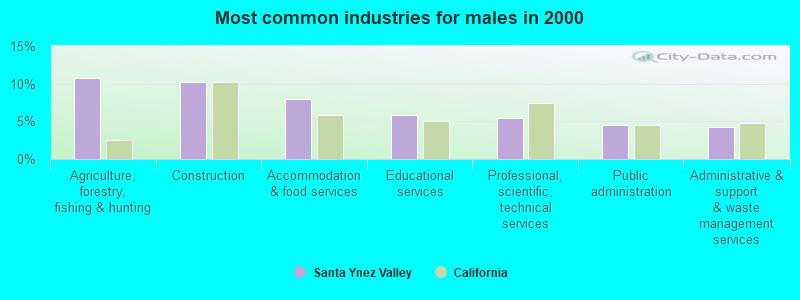
- Agriculture, forestry, fishing & hunting (10.8%)
- Construction (10.3%)
- Accommodation & food services (8.0%)
- Educational services (5.8%)
- Professional, scientific, technical services (5.5%)
- Public administration (4.5%)
- Administrative & support & waste management services (4.3%)
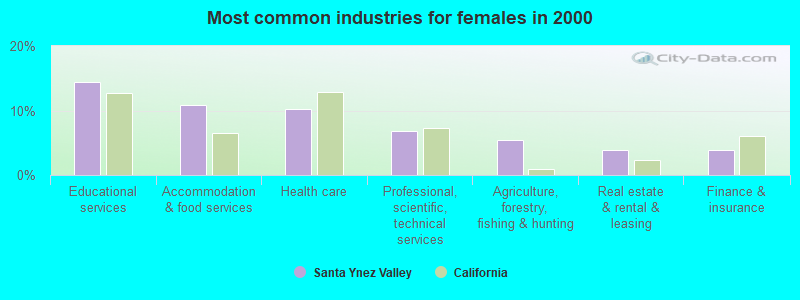
- Educational services (14.4%)
- Accommodation & food services (10.8%)
- Health care (10.2%)
- Professional, scientific, technical services (6.8%)
- Agriculture, forestry, fishing & hunting (5.4%)
- Real estate & rental & leasing (3.9%)
- Finance & insurance (3.9%)
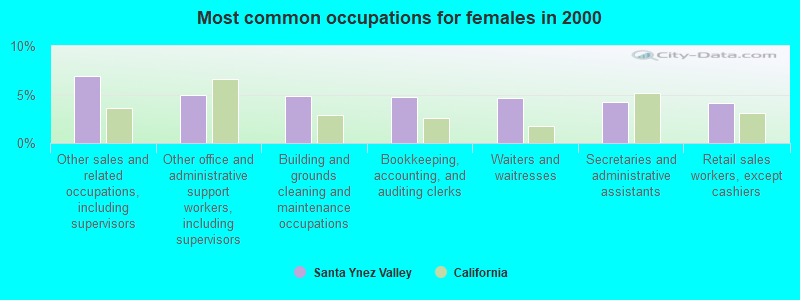
- Other sales and related occupations, including supervisors (6.5%)
- Building and grounds cleaning and maintenance occupations (5.9%)
- Other management occupations, except farmers and farm managers (4.6%)
- Agricultural workers, including supervisors (3.2%)
- Retail sales workers, except cashiers (3.2%)
- Top executives (3.2%)
- Sales representatives, services, wholesale and manufacturing (2.7%)
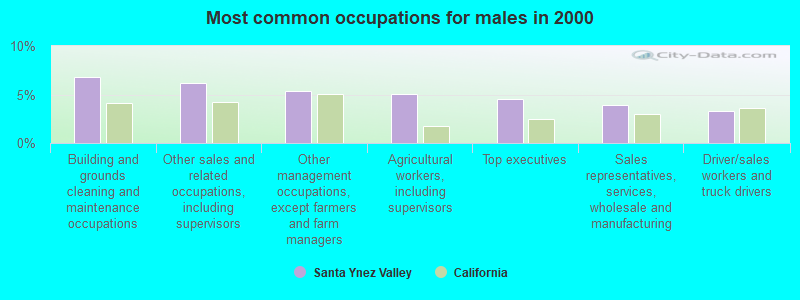
- Building and grounds cleaning and maintenance occupations (6.8%)
- Other sales and related occupations, including supervisors (6.2%)
- Other management occupations, except farmers and farm managers (5.4%)
- Agricultural workers, including supervisors (5.0%)
- Top executives (4.6%)
- Sales representatives, services, wholesale and manufacturing (3.9%)
- Driver/sales workers and truck drivers (3.3%)
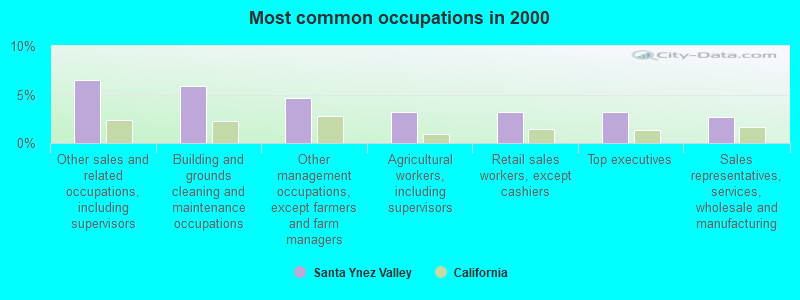
- Other sales and related occupations, including supervisors (6.9%)
- Other office and administrative support workers, including supervisors (5.0%)
- Building and grounds cleaning and maintenance occupations (4.9%)
- Bookkeeping, accounting, and auditing clerks (4.8%)
- Waiters and waitresses (4.7%)
- Secretaries and administrative assistants (4.2%)
- Retail sales workers, except cashiers (4.1%)
Average climate in Santa Ynez Valley, California
Based on data reported by over 4,000 weather stations


(lower is better)
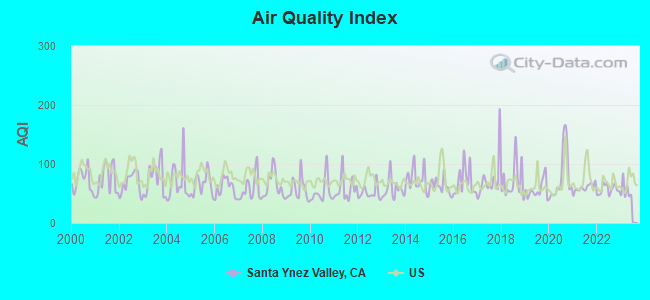
Air Quality Index (AQI) level in 2022 was 57.1. This is better than average.
| City: | 57.1 |
| U.S.: | 72.6 |
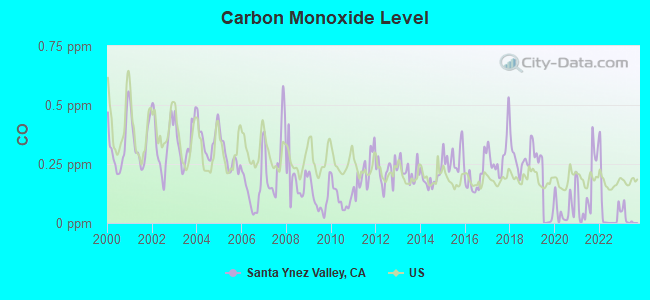
Carbon Monoxide (CO) [ppm] level in 2022 was 0.0525. This is significantly better than average. Closest monitor was 18.9 miles away from the city center.
| City: | 0.0525 |
| U.S.: | 0.2513 |
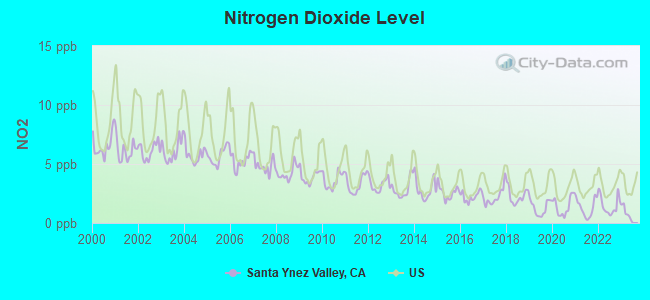
Nitrogen Dioxide (NO2) [ppb] level in 2022 was 1.49. This is significantly better than average. Closest monitor was 9.4 miles away from the city center.
| City: | 1.49 |
| U.S.: | 5.11 |
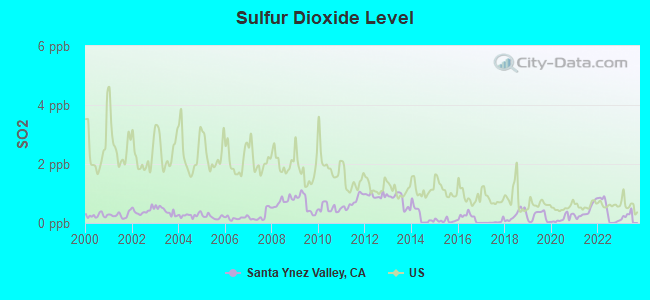
Sulfur Dioxide (SO2) [ppb] level in 2022 was 0.377. This is significantly better than average. Closest monitor was 8.8 miles away from the city center.
| City: | 0.377 |
| U.S.: | 1.515 |
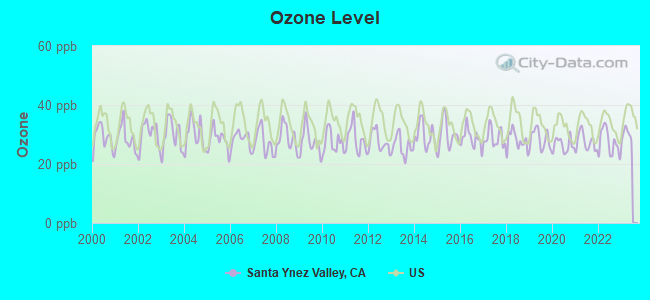
Ozone [ppb] level in 2022 was 27.3. This is better than average. Closest monitor was 4.2 miles away from the city center.
| City: | 27.3 |
| U.S.: | 33.3 |
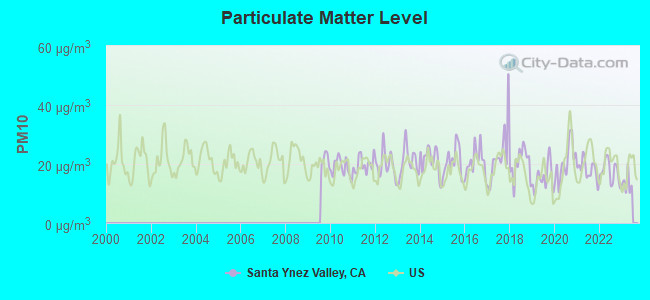
Particulate Matter (PM10) [µg/m3] level in 2022 was 17.4. This is about average. Closest monitor was 12.0 miles away from the city center.
| City: | 17.4 |
| U.S.: | 19.2 |
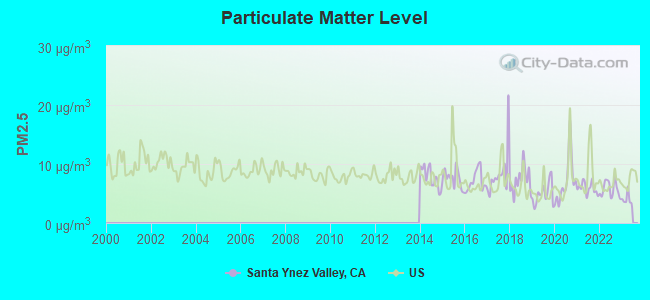
Particulate Matter (PM2.5) [µg/m3] level in 2022 was 5.73. This is significantly better than average. Closest monitor was 18.9 miles away from the city center.
| City: | 5.73 |
| U.S.: | 8.11 |
Earthquake activity:
Santa Ynez Valley-area historical earthquake activity is significantly above California state average. It is 6502% greater than the overall U.S. average.On 7/21/1952 at 11:52:14, a magnitude 7.7 (7.7 UK, Class: Major, Intensity: VIII - XII) earthquake occurred 68.3 miles away from Santa Ynez Valley center, causing $50,000,000 total damage
On 11/4/1927 at 13:51:53, a magnitude 7.5 (7.5 UK) earthquake occurred 54.6 miles away from Santa Ynez Valley center
On 6/28/1992 at 11:57:34, a magnitude 7.6 (6.2 MB, 7.6 MS, 7.3 MW, Depth: 0.7 mi) earthquake occurred 207.6 miles away from the city center, causing 3 deaths (1 shaking deaths, 2 other deaths) and 400 injuries, causing $100,000,000 total damage and $40,000,000 insured losses
On 4/18/1906 at 13:12:21, a magnitude 7.9 (7.9 UK) earthquake occurred 281.6 miles away from the city center, causing $524,000,000 total damage
On 10/16/1999 at 09:46:44, a magnitude 7.4 (6.3 MB, 7.4 MS, 7.2 MW, 7.3 ML) earthquake occurred 210.4 miles away from Santa Ynez Valley center
On 1/17/1994 at 12:30:55, a magnitude 6.8 (6.4 MB, 6.8 MS, 6.7 MW, Depth: 11.4 mi, Class: Strong, Intensity: VII - IX) earthquake occurred 94.9 miles away from the city center, causing 60 deaths (60 shaking deaths) and 7000 injuries
Magnitude types: body-wave magnitude (MB), local magnitude (ML), surface-wave magnitude (MS), moment magnitude (MW)
Natural disasters:
The number of natural disasters in Santa Barbara County (31) is a lot greater than the US average (15).Major Disasters (Presidential) Declared: 19
Emergencies Declared: 3
Causes of natural disasters: Floods: 17, Fires: 10, Storms: 8, Winter Storms: 8, Mudslides: 7, Landslides: 4, Drought: 1, Earthquake: 1, Freeze: 1, Hurricane: 1, Tornado: 1, Wind: 1, Other: 1 (Note: some incidents may be assigned to more than one category).
Amtrak stations near Santa Ynez Valley:
- 4 miles: SOLVANG (1630 MISSION DR.) - Bus Station . Services: fully wheelchair accessible, public payphones, free short-term parking, free long-term parking.
- 5 miles: BUELLTON (PEA SOUP ANDERSON REST., 376 AVE. OF FLA) - Bus Station
- 19 miles: LOMPOC (LAUREL & N. H STS.) - Bus Station . Services: fully wheelchair accessible, public payphones, snack bar, free short-term parking, call for taxi service.
Colleges/universities with over 2000 students nearest to Santa Ynez Valley:
- University of California-Santa Barbara (about 23 miles; Santa Barbara, CA; Full-time enrollment: 22,806)
- Allan Hancock College (about 27 miles; Santa Maria, CA; FT enrollment: 6,639)
- Santa Barbara City College (about 30 miles; Santa Barbara, CA; FT enrollment: 12,568)
- Taft College (about 52 miles; Taft, CA; FT enrollment: 2,121)
- California Polytechnic State University-San Luis Obispo (about 55 miles; San Luis Obispo, CA; FT enrollment: 17,345)
- Ventura College (about 58 miles; Ventura, CA; FT enrollment: 8,460)
- Cuesta College (about 59 miles; San Luis Obispo, CA; FT enrollment: 6,518)
Points of interest:
Notable locations in Santa Ynez Valley: Juan y Lolita Ranch (A), Los Prietos Campground (B), Los Prietos Ranger Station (C), Foxen Adobe (D), Figueroa Station (E), Figueroa Camp (F), Diamond-T Ranch (G), De la Guerra Camp (H), Camp Drake (I), Cachuma Saddle Guard Station (J), Rancho Los Olivos (K), Rancho Los Potreros (L), Bar G O Ranch (M), Rancho San Fernando Rey (N), Rancho San Juan (O), Rancho Tinaquaic (P), Zaca Creek Golf Course (Q), The Brander Vineyard (R), J Carey Cellars (S), Houtz Vineyard (T). Display/hide their locations on the map
Shopping Centers: Nielsens Shopping Center (1), Farm and Country Shopping Center (2). Display/hide their locations on the map
Churches in Santa Ynez Valley include: Mission Santa Ynez (A), Mission Santa Ines (B). Display/hide their locations on the map
Cemeteries: Foxen Canyon Cemetery (1), Oak Hill Memorial Cemetery (2), Solvang Cemetery (3). Display/hide their locations on the map
Lake: Zaca Lake (A). Display/hide its location on the map
Creeks: Cuaslui Creek (A), Lisque Creek (B), Bear Creek (C), Alisal Creek (D), Alamo Pintado Creek (E), Calabazal Creek (F), Figueroa Creek (G), Santa Agueda Creek (H), San Lucas Creek (I). Display/hide their locations on the map
Parks in Santa Ynez Valley include: Arthur Ferrini Park (1), Buellton Park (2), Santa Ynez County Park (3), Solvang Park (4), Fremont-Foxen Monument (5), Lake Cachuma County Park (6), Nojoqui Falls Park (7), Paradise County Park (8), Hans Christian Anderson Park (9). Display/hide their locations on the map
Birthplace of: Eion Bailey - Film actor.
| This place: | 2.6 people |
| California: | 2.9 people |
| This place: | 52.1% |
| Whole state: | 69.4% |
| This place: | 4.9% |
| Whole state: | 5.9% |
Likely homosexual households (counted as self-reported same-sex unmarried-partner households)
- Lesbian couples: 0.3% of all households
- Gay men: 0.2% of all households
| This place: | 7.9% |
| Whole state: | 14.2% |
| This place: | 3.0% |
| Whole state: | 6.3% |
People in group quarters in Santa Ynez Valley in 2000:
- 159 people in nursing homes
- 86 people in training schools for juvenile delinquents
- 47 people in other noninstitutional group quarters
- 14 people in other nonhousehold living situations
- 11 people in religious group quarters
- 4 people in unknown juvenile institutions
- 4 people in homes for the mentally retarded
- 4 people in other group homes
For population 15 years and over in Santa Ynez Valley:
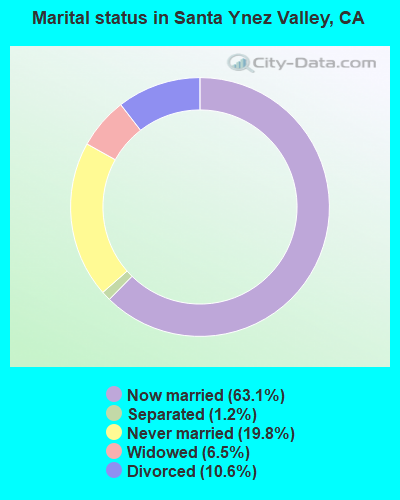
- Never married: 19.8%
- Now married: 63.1%
- Separated: 1.2%
- Widowed: 6.5%
- Divorced: 10.6%
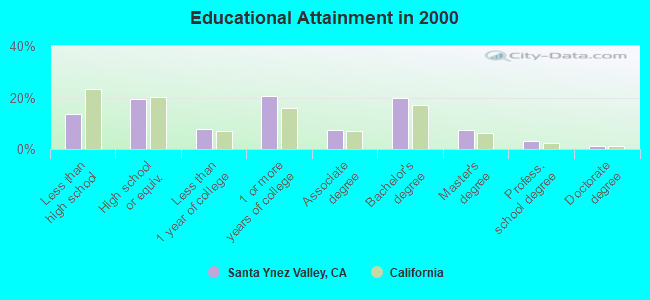
For population 25 years and over in Santa Ynez Valley:
- High school or higher: 86.6%
- Bachelor's degree or higher: 31.5%
- Graduate or professional degree: 11.8%
- Unemployed: 3.5%
- Mean travel time to work (commute): 21.8 minutes
| Here: | 12.6 |
| California average: | 16.1 |
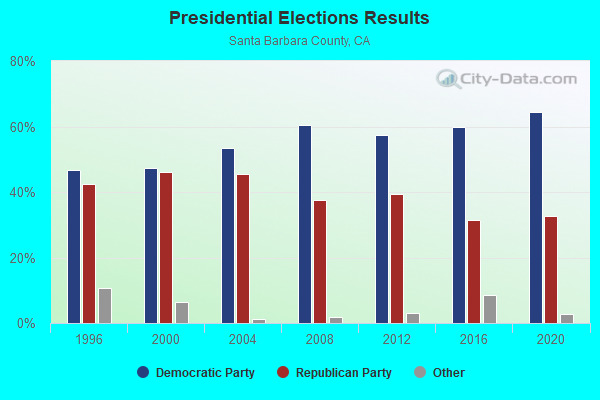
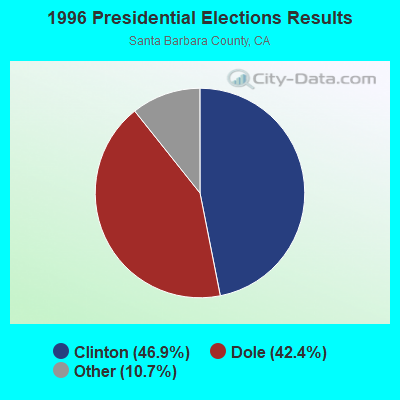
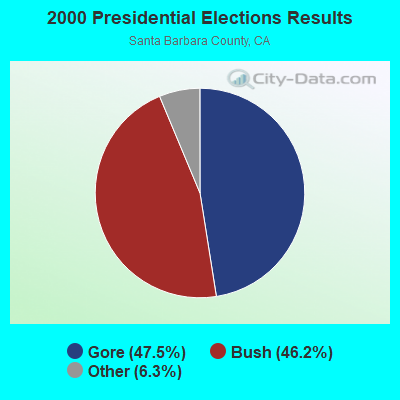
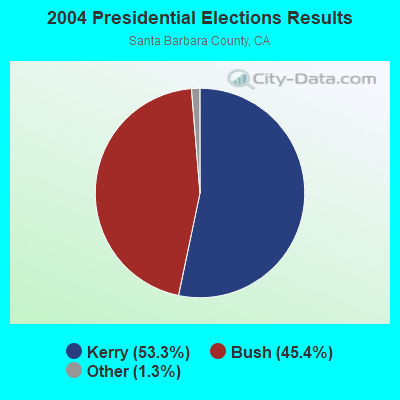
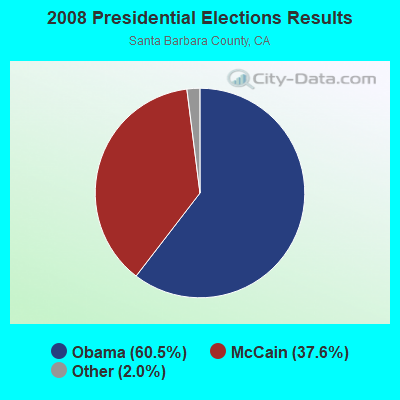
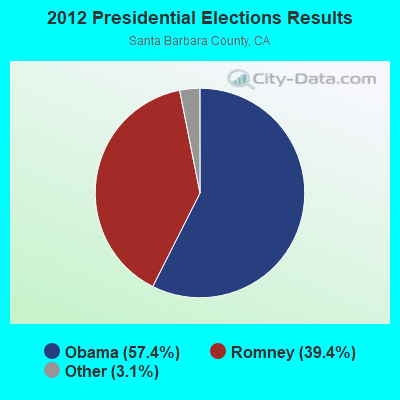
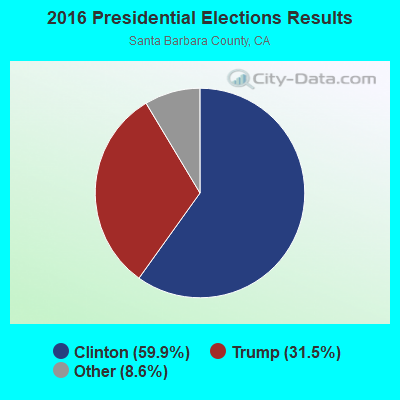
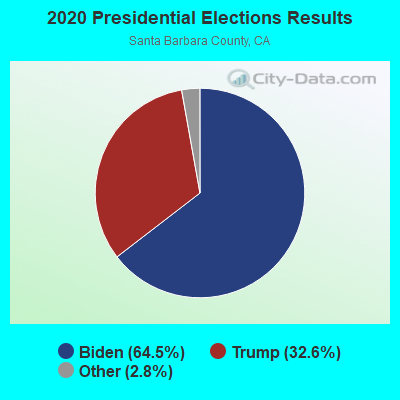
Graphs represent county-level data. Detailed 2008 Election Results
Religion statistics for Santa Ynez Valley, CA (based on Santa Barbara County data)
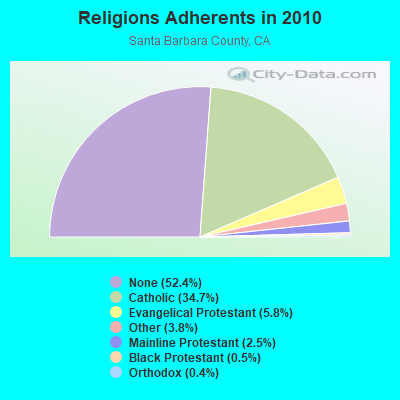
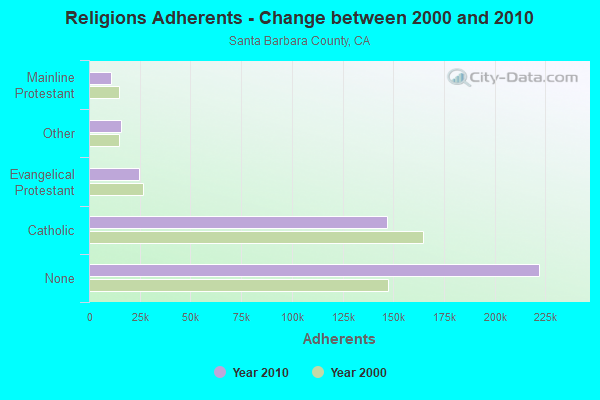
| Religion | Adherents | Congregations |
|---|---|---|
| Catholic | 146,940 | 17 |
| Evangelical Protestant | 24,775 | 161 |
| Other | 15,951 | 58 |
| Mainline Protestant | 10,610 | 43 |
| Black Protestant | 1,979 | 13 |
| Orthodox | 1,536 | 7 |
| None | 222,104 | - |
Food Environment Statistics:
| Santa Barbara County: | 2.61 / 10,000 pop. |
| California: | 2.14 / 10,000 pop. |
| Here: | 0.05 / 10,000 pop. |
| California: | 0.04 / 10,000 pop. |
| Santa Barbara County: | 0.75 / 10,000 pop. |
| California: | 0.62 / 10,000 pop. |
| Here: | 1.84 / 10,000 pop. |
| California: | 1.49 / 10,000 pop. |
| This county: | 9.65 / 10,000 pop. |
| California: | 7.42 / 10,000 pop. |
| This county: | 7.3% |
| California: | 7.3% |
| Santa Barbara County: | 22.2% |
| California: | 21.3% |
| Santa Barbara County: | 18.3% |
| California: | 17.9% |
4.93% of this county's 2021 resident taxpayers lived in other counties in 2020 ($102,533 average adjusted gross income)
| Here: | 4.93% |
| California average: | 5.19% |
0.04% of residents moved from foreign countries ($459 average AGI)
Santa Barbara County: 0.04% California average: 0.03%
Top counties from which taxpayers relocated into this county between 2020 and 2021:
| from Los Angeles County, CA | |
| from San Luis Obispo County, CA | |
| from Ventura County, CA |
6.09% of this county's 2020 resident taxpayers moved to other counties in 2021 ($82,188 average adjusted gross income)
| Here: | 6.09% |
| California average: | 6.14% |
0.03% of residents moved to foreign countries ($259 average AGI)
Santa Barbara County: 0.03% California average: 0.02%
Top counties to which taxpayers relocated from this county between 2020 and 2021:
| to Los Angeles County, CA | |
| to San Luis Obispo County, CA | |
| to Ventura County, CA |
Strongest AM radio stations in Santa Ynez Valley:
- KGDP (660 AM; 50 kW; ORCUTT, CA; Owner: RADIO REPRESENTATIVES, INC.)
- KERI (1180 AM; 50 kW; WASCO-GREENACRES, CA; Owner: KWSO, INC.)
- KSPN (710 AM; 50 kW; LOS ANGELES, CA; Owner: KABC-AM RADIO, INC.)
- KTMS (990 AM; 5 kW; SANTA BARBARA, CA; Owner: CITICASTERS LICENSES, L.P.)
- KLAC (570 AM; 50 kW; LOS ANGELES, CA; Owner: AMFM RADIO LICENSES, L.L.C.)
- KXTK (1280 AM; 10 kW; ARROYO GRANDE, CA; Owner: PAMPLIN BROADCASTING, INC.)
- KIRN (670 AM; 35 kW; SIMI VALLEY, CA; Owner: LOTUS OXNARD CORP.)
- KACD (850 AM; 25 kW; THOUSAND OAKS, CA; Owner: CITICASTERS LICENSES, L.P.)
- KFI (640 AM; 50 kW; LOS ANGELES, CA; Owner: CAPSTAR TX LIMITED PARTNERSHIP)
- KUHL (1440 AM; 5 kW; SANTA MARIA, CA; Owner: MAPLETON COMMUNICATIONS, LLC)
- KMJ (580 AM; 50 kW; FRESNO, CA; Owner: INFINITY RADIO OPERATIONS INC.)
- KFWB (980 AM; 50 kW; LOS ANGELES, CA; Owner: INFINITY BROADCASTING OPERATIONS, INC.)
- KEYT (1250 AM; 2 kW; SANTA BARBARA, CA; Owner: SMITH BROADCASTING OF SANTA BARBARA LIMITED PARTNERSHIP)
Strongest FM radio stations in Santa Ynez Valley:
- KRAZ (105.9 FM; SANTA YNEZ, CA; Owner: KNIGHT BROADCASTING, INC.)
- KSPE-FM (94.5 FM; ELLWOOD, CA; Owner: CITICASTERS LICENSES, L.P.)
- KMGQ (97.5 FM; SANTA BARBARA, CA; Owner: CUMULUS LICENSING CORP.)
- KRUZ (103.3 FM; SANTA BARBARA, CA; Owner: CUMULUS LICENSING CORP.)
- KCSB-FM (91.9 FM; SANTA BARBARA, CA; Owner: UNIVERSITY OF CALIFORNIA)
- KSYV (96.7 FM; SOLVANG, CA; Owner: KNIGHT BROADCASTING, INC.)
- KWSZ (105.1 FM; LOMPOC, CA; Owner: MAPLETON COMMUNICATIONS, LLC)
- KXFM (99.1 FM; SANTA MARIA, CA; Owner: CLEAR CHANNEL BROADCASTING LICENSES, INC.)
- K295AH (106.9 FM; GOLETA, CA; Owner: THE ASSOC., FOR COMMUNITY EDUC., INC)
- KIST-FM (107.7 FM; SANTA BARBARA, CA; Owner: CITICASTERS LICENSES, L.P.)
- K254AH (98.7 FM; ISLA VISTA, CA; Owner: PACIFICA FOUNDATION, INC.)
- KSMY (106.7 FM; LOMPOC, CA; Owner: CLEAR CHANNEL BROADCASTING LICENSES, INC.)
- KRQZ (91.5 FM; LOMPOC, CA; Owner: TRINITY CHURCH OF THE NAZARENE)
- KPAT (95.7 FM; ORCUTT, CA; Owner: AGM-BIRMINGHAM, LLC)
- KBOX (104.1 FM; LOMPOC, CA; Owner: AGM-BIRMINGHAM, L.L.C.)
- KGDP-FM (90.7 FM; SANTA MARIA, CA; Owner: PEOPLE OF ACTION)
- KRQK (100.3 FM; LOMPOC, CA; Owner: AGM-BIRMINGHAM, L.L.C.)
- K293AG (106.5 FM; TAFT, CA; Owner: CENTRO CRISTIANO DE FE, INC.)
- KSNI-FM (102.5 FM; SANTA MARIA, CA; Owner: CLEAR CHANNEL BROADCASTING LICENSES, INC.)
- KTYD (99.9 FM; SANTA BARBARA, CA; Owner: CITICASTERS LICENSES, L.P.)
TV broadcast stations around Santa Ynez Valley:
- K23EQ (Channel 23; VENTURA, CA; Owner: EQUITY BROADCASTING CORPORATION)
- KEYT-TV (Channel 3; SANTA BARBARA, CA; Owner: SMITH BROADCASTING OF SANTA BARBARA, LP)
- KPMR (Channel 38; SANTA BARBARA, CA; Owner: ENTRAVISION HOLDINGS, LLC)
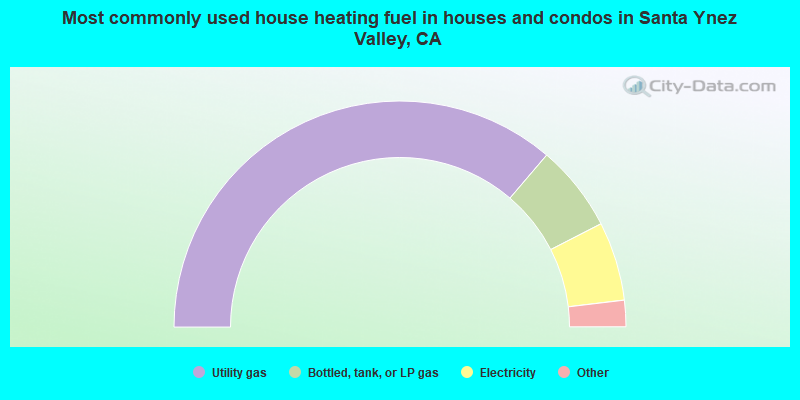
- 72.5%Utility gas
- 12.4%Bottled, tank, or LP gas
- 11.3%Electricity
- 2.5%Wood
- 0.9%Other fuel
- 0.3%No fuel used
- 0.1%Fuel oil, kerosene, etc.
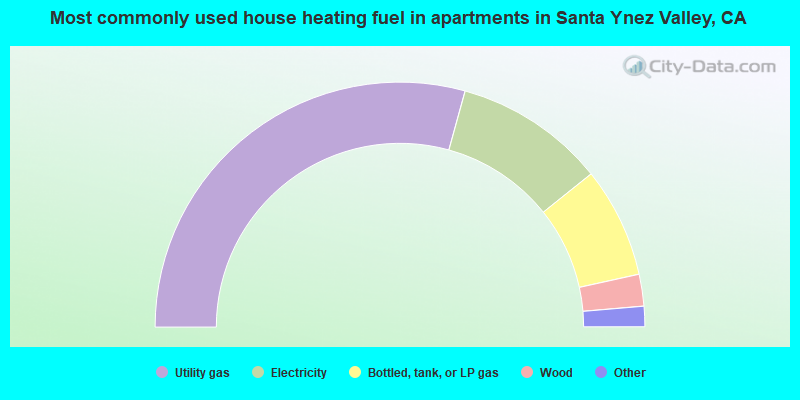
- 58.6%Utility gas
- 19.9%Electricity
- 14.6%Bottled, tank, or LP gas
- 4.2%Wood
- 1.4%No fuel used
- 1.2%Other fuel
- 0.2%Solar energy
Santa Ynez Valley compared to California state average:
- Unemployed percentage significantly below state average.
- Black race population percentage significantly below state average.
- Hispanic race population percentage below state average.
- Median age significantly above state average.
- Foreign-born population percentage significantly below state average.
- Renting percentage significantly below state average.
- Length of stay since moving in significantly above state average.
- Number of rooms per house significantly below state average.
- House age significantly below state average.
- Institutionalized population percentage significantly above state average.
Santa Ynez Valley on our top lists:
- #13 on the list of "Top 101 cities with largest percentage of males in industries: beverage and tobacco products (population 5,000+)"
- #22 on the list of "Top 101 cities with largest percentage of females in industries: beverage and tobacco products (population 5,000+)"
- #48 on the list of "Top 101 cities with largest percentage of males in industries: private households (population 5,000+)"
- #50 on the list of "Top 101 cities with largest percentage of females in occupations: other construction workers and helpers (population 5,000+)"
- #50 on the list of "Top 101 cities with largest percentage of males in occupations: other food preparation and serving workers including supervisors (population 5,000+)"
- #52 on the list of "Top 101 cities with largest percentage of females in occupations: farmers and farm managers (population 5,000+)"
- #54 on the list of "Top 101 cities with largest percentage of females in industries: used merchandise, gift, novelty, and souvenir, and other miscellaneous stores (population 5,000+)"
- #61 on the list of "Top 101 cities with largest percentage of females in occupations: waiters and waitresses (population 5,000+)"
- #62 on the list of "Top 101 cities with largest percentage of males in occupations: agricultural workers including supervisors (population 5,000+)"
- #64 on the list of "Top 101 cities with largest percentage of females in occupations: other sales and related workers including supervisors (population 5,000+)"
- #77 on the list of "Top 101 cities with largest percentage of females in industries: farm supplies merchant wholesalers (population 5,000+)"
- #88 on the list of "Top 101 cities with largest percentage of males in industries: petroleum and coal products (population 5,000+)"
- #89 on the list of "Top 101 cities with largest percentage of males in industries: other direct selling establishments (population 5,000+)"
- #8 (93463) on the list of "Top 101 zip codes with the largest percentage of Danish first ancestries (pop 5,000+)"
- #17 on the list of "Top 101 counties with the lowest Sulfur Oxides Annual air pollution readings in 2012 (µg/m3)"
- #32 on the list of "Top 101 counties with the highest Nitrogen Dioxide air pollution readings in 2012 (ppm)"
- #38 on the list of "Top 101 counties with the lowest number of infant deaths per 1000 residents 2007-2013 (pop. 50,000+)"
- #78 on the list of "Top 101 counties with the highest carbon monoxide air pollution readings in 2012 (ppm)"
- #81 on the list of "Top 101 counties with the largest decrease in the number of infant deaths per 1000 residents 2000-2006 to 2007-2013 (pop. 50,000+)"