San Gorgonio Pass, California
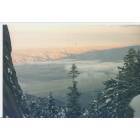
San Gorgonio Pass: In the San Jacinto Mtns.....
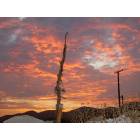
San Gorgonio Pass: Beautiful sunset nights, taken from my driveway
- add
your
Submit your own pictures of this place and show them to the world
- OSM Map
- General Map
- Google Map
- MSN Map

| Males: 33,948 | |
| Females: 36,643 |
| Median resident age: | 38.9 years |
| California median age: | 33.3 years |
Zip code: 92220
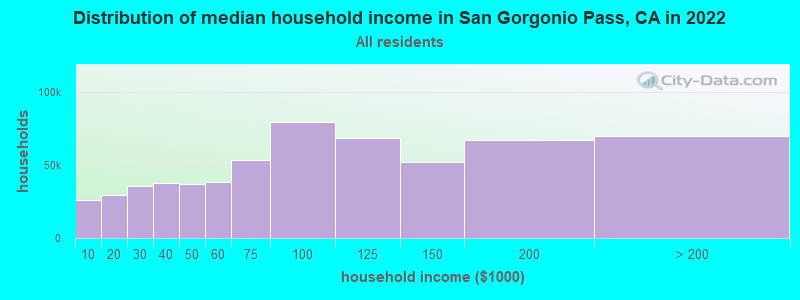
| San Gorgonio Pass: | $67,136 |
| CA: | $91,551 |
Estimated per capita income in 2022: $32,031 (it was $16,878 in 2000)
San Gorgonio Pass CCD income, earnings, and wages data
Estimated median house or condo value in 2022: $400,711 (it was $97,400 in 2000)
| San Gorgonio Pass: | $400,711 |
| CA: | $715,900 |
Mean prices in 2022: all housing units: $586,167; detached houses: $631,165; townhouses or other attached units: $625,082; in 2-unit structures: $464,831; in 3-to-4-unit structures: $482,529; in 5-or-more-unit structures: $526,423; mobile homes: $178,284; occupied boats, rvs, vans, etc.: $86,227
San Gorgonio Pass, CA residents, houses, and apartments details
Detailed information about poverty and poor residents in San Gorgonio Pass, CA


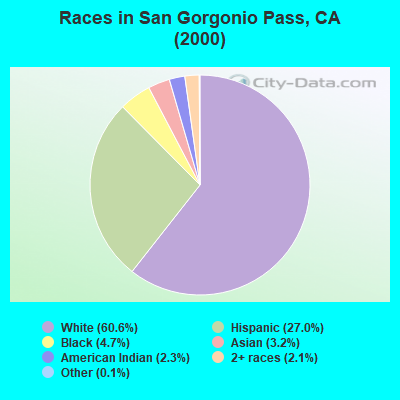
- 32,45060.6%White alone
- 14,44627.0%Hispanic
- 2,5174.7%Black alone
- 1,6953.2%Asian alone
- 1,2122.3%American Indian alone
- 1,1132.1%Two or more races
- 560.1%Other race alone
- 440.08%Native Hawaiian and Other
Pacific Islander alone
 Recent articles from our blog. Our writers, many of them Ph.D. graduates or candidates, create easy-to-read articles on a wide variety of topics.
Current Local Time: PST time zone
Land area: 256.9 square miles.
Population density: 275 people per square mile (very low).

| San Gorgonio Pass CCD: | 1.0% ($951) |
| California: | 0.8% ($1,564) |
Nearest city with pop. 200,000+: Riverside, CA  (27.9 miles , pop. 255,166).
Nearest city with pop. 1,000,000+: San Diego, CA (80.8 miles , pop. 1,223,400).
Nearest cities:
)Latitude: 33.93 N, Longitude: 116.91 W
Area code commonly used in this area: 909

| Here: | 5.2% |
| California: | 5.1% |
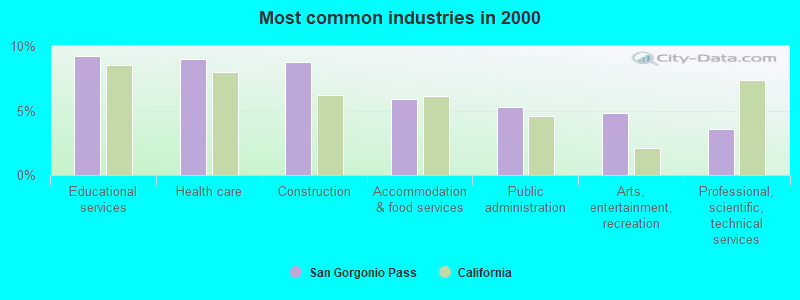
- Educational services (9.2%)
- Health care (9.0%)
- Construction (8.8%)
- Accommodation & food services (5.9%)
- Public administration (5.2%)
- Arts, entertainment, recreation (4.8%)
- Professional, scientific, technical services (3.5%)
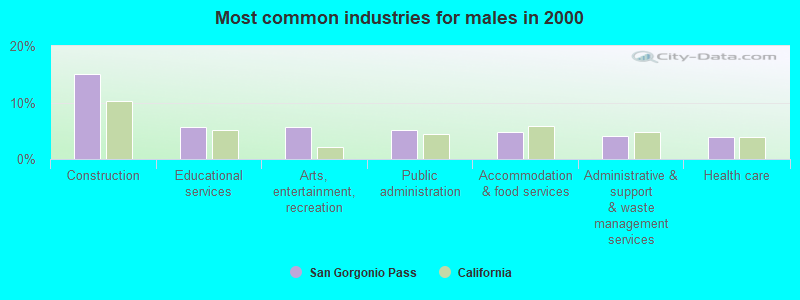
- Construction (15.1%)
- Educational services (5.8%)
- Arts, entertainment, recreation (5.7%)
- Public administration (5.1%)
- Accommodation & food services (4.8%)
- Administrative & support & waste management services (4.0%)
- Health care (3.8%)
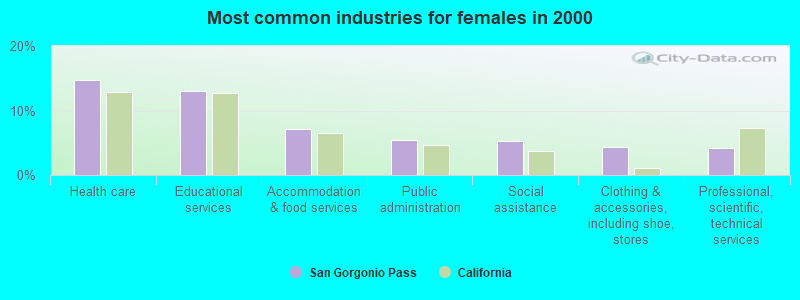
- Health care (14.8%)
- Educational services (13.1%)
- Accommodation & food services (7.1%)
- Public administration (5.4%)
- Social assistance (5.3%)
- Clothing & accessories, including shoe, stores (4.3%)
- Professional, scientific, technical services (4.2%)
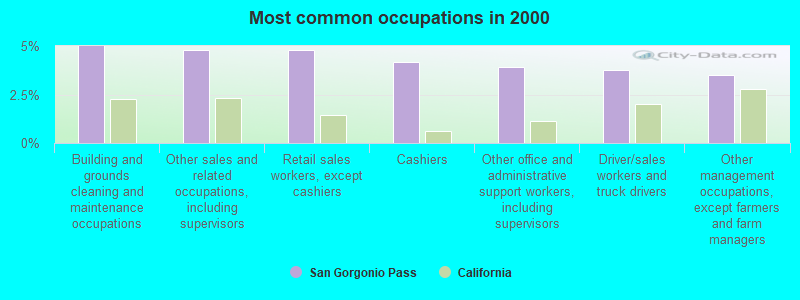
- Building and grounds cleaning and maintenance occupations (5.0%)
- Other sales and related occupations, including supervisors (4.8%)
- Retail sales workers, except cashiers (4.8%)
- Cashiers (4.2%)
- Other office and administrative support workers, including supervisors (3.9%)
- Driver/sales workers and truck drivers (3.7%)
- Other management occupations, except farmers and farm managers (3.5%)
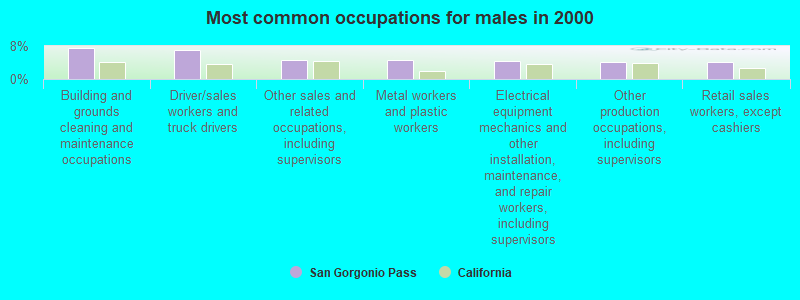
- Building and grounds cleaning and maintenance occupations (7.6%)
- Driver/sales workers and truck drivers (6.9%)
- Other sales and related occupations, including supervisors (4.6%)
- Metal workers and plastic workers (4.6%)
- Electrical equipment mechanics and other installation, maintenance, and repair workers, including supervisors (4.3%)
- Other production occupations, including supervisors (4.2%)
- Retail sales workers, except cashiers (4.1%)
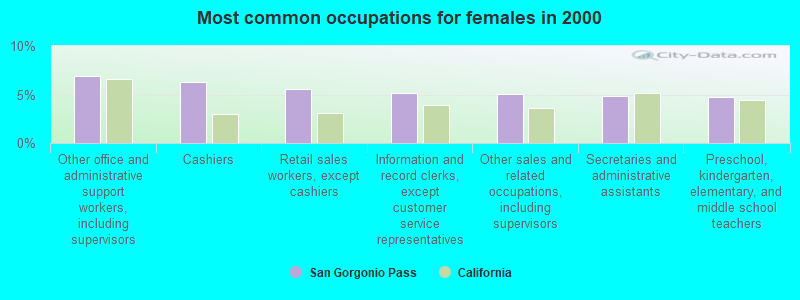
- Other office and administrative support workers, including supervisors (6.9%)
- Cashiers (6.3%)
- Retail sales workers, except cashiers (5.6%)
- Information and record clerks, except customer service representatives (5.1%)
- Other sales and related occupations, including supervisors (5.0%)
- Secretaries and administrative assistants (4.9%)
- Preschool, kindergarten, elementary, and middle school teachers (4.8%)
Average climate in San Gorgonio Pass, California
Based on data reported by over 4,000 weather stations


(lower is better)
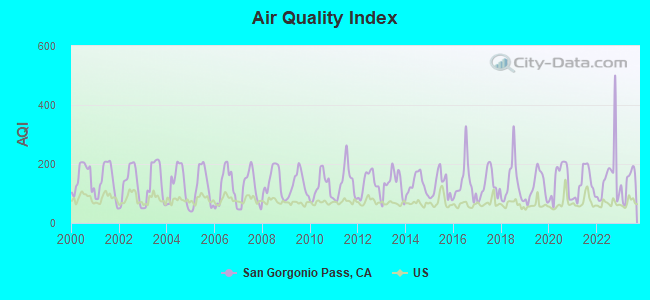
Air Quality Index (AQI) level in 2023 was 138. This is significantly worse than average.
| City: | 138 |
| U.S.: | 73 |
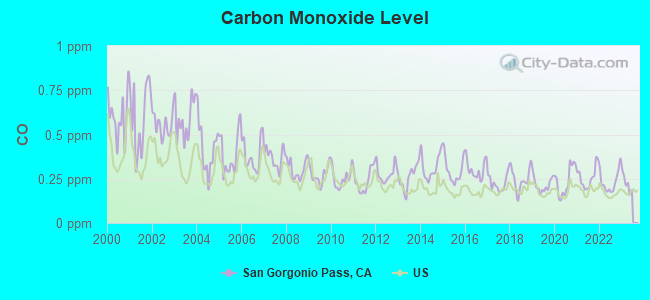
Carbon Monoxide (CO) [ppm] level in 2022 was 0.233. This is about average. Closest monitor was 2.1 miles away from the city center.
| City: | 0.233 |
| U.S.: | 0.251 |
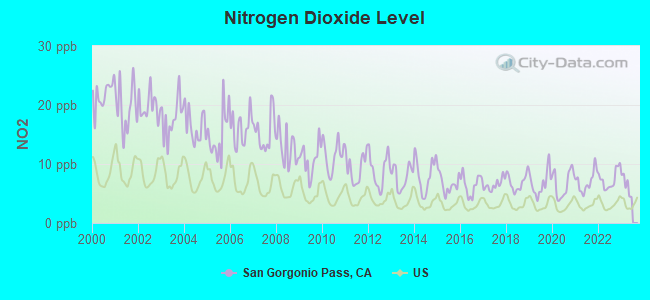
Nitrogen Dioxide (NO2) [ppb] level in 2022 was 7.39. This is significantly worse than average. Closest monitor was 2.0 miles away from the city center.
| City: | 7.39 |
| U.S.: | 5.11 |
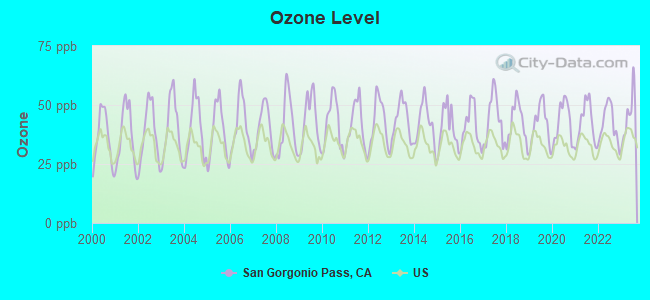
Ozone [ppb] level in 2023 was 45.5. This is worse than average. Closest monitor was 2.1 miles away from the city center.
| City: | 45.5 |
| U.S.: | 33.3 |
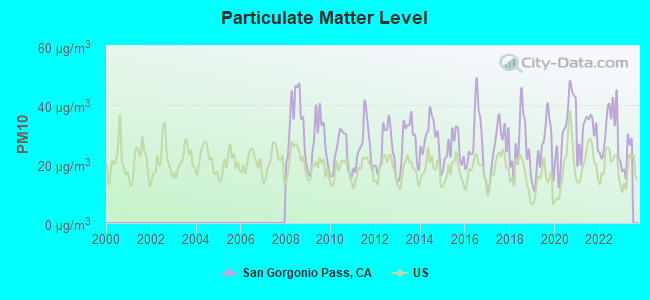
Particulate Matter (PM10) [µg/m3] level in 2022 was 31.4. This is significantly worse than average. Closest monitor was 2.1 miles away from the city center.
| City: | 31.4 |
| U.S.: | 19.2 |
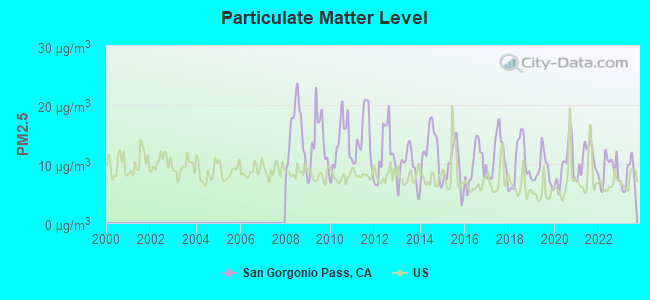
Particulate Matter (PM2.5) [µg/m3] level in 2023 was 7.93. This is about average. Closest monitor was 4.7 miles away from the city center.
| City: | 7.93 |
| U.S.: | 8.11 |
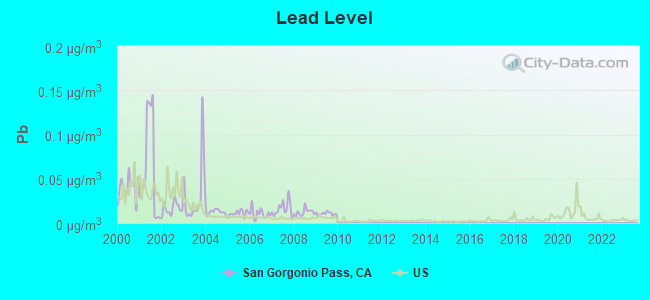
Lead (Pb) [µg/m3] level in 2009 was 0.0106. This is about average. Closest monitor was 2.1 miles away from the city center.
| City: | 0.0106 |
| U.S.: | 0.0093 |
Earthquake activity:
San Gorgonio Pass-area historical earthquake activity is significantly above California state average. It is 7214% greater than the overall U.S. average.On 6/28/1992 at 11:57:34, a magnitude 7.6 (6.2 MB, 7.6 MS, 7.3 MW, Depth: 0.7 mi, Class: Major, Intensity: VIII - XII) earthquake occurred 27.9 miles away from the city center, causing 3 deaths (1 shaking deaths, 2 other deaths) and 400 injuries, causing $100,000,000 total damage and $40,000,000 insured losses
On 10/16/1999 at 09:46:44, a magnitude 7.4 (6.3 MB, 7.4 MS, 7.2 MW, 7.3 ML) earthquake occurred 48.7 miles away from San Gorgonio Pass center
On 7/21/1952 at 11:52:14, a magnitude 7.7 (7.7 UK) earthquake occurred 140.2 miles away from the city center, causing $50,000,000 total damage
On 5/19/1940 at 04:36:40, a magnitude 7.2 (7.2 UK) earthquake occurred 85.5 miles away from San Gorgonio Pass center, causing $33,000,000 total damage
On 6/28/1992 at 15:05:30, a magnitude 6.9 (6.3 MB, 6.7 MS, 6.5 MW, 6.9 ME, Depth: 3.1 mi, Class: Strong, Intensity: VII - IX) earthquake occurred 25.3 miles away from San Gorgonio Pass center
On 4/21/1918 at 22:32:30, a magnitude 6.8 (6.8 UK) earthquake occurred 31.5 miles away from San Gorgonio Pass center
Magnitude types: body-wave magnitude (MB), energy magnitude (ME), local magnitude (ML), surface-wave magnitude (MS), moment magnitude (MW)
Natural disasters:
The number of natural disasters in Riverside County (46) is a lot greater than the US average (15).Major Disasters (Presidential) Declared: 27
Emergencies Declared: 1
Causes of natural disasters: Fires: 22, Floods: 20, Storms: 8, Winter Storms: 8, Landslides: 6, Mudslides: 5, Heavy Rains: 2, Earthquake: 1, Flash Flood: 1, Freeze: 1, Hurricane: 1, Tornado: 1, Tropical Storm: 1, Other: 1 (Note: some incidents may be assigned to more than one category).
Hospitals and medical centers near San Gorgonio Pass:
- BANNING HEALTHCARE (Nursing Home, about 1 miles away; BANNING, CA)
- INDEPENDENT OPTIONS INC/RED BLUFF HOUSE (Hospital, about 1 miles away; BANNING, CA)
- CHERRY VALLEY HEALTHCARE (Nursing Home, about 2 miles away; BANNING, CA)
- BANNING DIALYSIS (Dialysis Facility, about 2 miles away; BANNING, CA)
- SAN GORGONIO MEMORIAL HOSPITAL Acute Care Hospitals (about 3 miles away; BANNING, CA)
- RAI-EAST SIXTH STREET-BEAUMONT (Dialysis Facility, about 3 miles away; BEAUMONT, CA)
- BEAUMONT CARE CENTER (Nursing Home, about 4 miles away; BEAUMONT, CA)
Colleges/universities with over 2000 students nearest to San Gorgonio Pass:
- Mt San Jacinto Community College District (about 10 miles; San Jacinto, CA; Full-time enrollment: 8,426)
- Crafton Hills College (about 14 miles; Yucaipa, CA; FT enrollment: 3,222)
- University of Redlands (about 18 miles; Redlands, CA; FT enrollment: 4,854)
- Moreno Valley College (about 18 miles; Moreno Valley, CA; FT enrollment: 4,650)
- Loma Linda University (about 22 miles; Loma Linda, CA; FT enrollment: 2,839)
- The Art Institute of California-Argosy University Inland Empire (about 23 miles; San Bernardino, CA; FT enrollment: 2,238)
- University of California-Riverside (about 25 miles; Riverside, CA; FT enrollment: 20,647)
Points of interest:
Notable locations in San Gorgonio Pass: Gandy Ranch (A), Davis Ranch (B), Chappel Ranch (C), Oak Glen Conservation Camp (D), Pershing Siding (E), Banning Ranger Station (F), Riverside County Road Camp (G), Sun Lakes Country Club and Golf Course (H), Quail Ranch Resort and Country Club (I), Oak Valley Golf Club (J), Fisherman Campground (K), Cabazon Community Center (L), Mount Oak Boys Ranch (M), Millard Canyon Guard Station (N), Camp Tree Mont (O), Barker Peak Lookout (P), Bear Wallows Campground (Q), Pine Powerhouse (R), Garden Air Golf Course (S), Big Oaks Powerhouse (T). Display/hide their locations on the map
Shopping Centers: Sun Lakes Village Shopping Center (1), Beaumont Towne Centre Shopping Center (2), Beaumont Shopping Center (3), Beaumont Plaza Shopping Center (4), Desert Hills Factory Stores Shopping Center (5). Display/hide their locations on the map
Churches in San Gorgonio Pass include: Cabazon Community Church (A), Apostolic Assembly of the Faith in Jesus Church (B), Banning Foursquare Church (C), Banning United Methodist Church (D), Beaumont Foursquare Church (E), Beaumont Presbyterian Church (F), Beaumont Seventh Day Adventist Church (G), Calvary Baptist Church (H), Calvary Baptist Church of Beaumont (I). Display/hide their locations on the map
Cemeteries: Sunnyslope Cemetery (1), Forest Lawn Memorial Gardens (2), Mount View Cemetery (3). Display/hide their locations on the map
Reservoir: El Casco Lake (A). Display/hide its location on the map
Creeks: Noble Creek (A), Montgomery Creek (B), Little San Gorgonio Creek (C), Hathaway Creek (D), Yucaipa Creek (E), Wallace Creek (F), Twin Pines Creek (G), Smith Creek (H), Potrero Creek (I). Display/hide their locations on the map
Parks in San Gorgonio Pass include: Repplier Park (1), Bogart County Park (2), Sylvan Park (3), Stewart Park (4), Cabazon Park (5), De Anza Cycle Park (6), Gilman Ranch Historic Park (7), Noble Creek Park (8), Pass Valley Park (9). Display/hide their locations on the map
| This place: | 2.8 people |
| California: | 2.9 people |
| This place: | 71.3% |
| Whole state: | 68.7% |
| This place: | 7.0% |
| Whole state: | 7.2% |
Likely homosexual households (counted as self-reported same-sex unmarried-partner households)
- Lesbian couples: 0.5% of all households
- Gay men: 0.3% of all households
| This place: | 17.4% |
| Whole state: | 14.2% |
| This place: | 7.3% |
| Whole state: | 6.3% |
People in group quarters in San Gorgonio Pass in 2010:
- 879 people in local jails and other municipal confinement facilities
- 376 people in nursing facilities/skilled-nursing facilities
- 354 people in other noninstitutional facilities
- 143 people in emergency and transitional shelters (with sleeping facilities) for people experiencing homelessness
- 103 people in group homes intended for adults
- 86 people in residential treatment centers for juveniles (non-correctional)
- 56 people in workers' group living quarters and job corps centers
- 32 people in group homes for juveniles (non-correctional)
- 29 people in correctional residential facilities
- 11 people in residential treatment centers for adults
People in group quarters in San Gorgonio Pass in 2000:
- 464 people in local jails and other confinement facilities (including police lockups)
- 288 people in nursing homes
- 202 people in other group homes
- 125 people in state prisons
- 110 people in other noninstitutional group quarters
- 82 people in residential treatment centers for emotionally disturbed children
- 68 people in other types of correctional institutions
- 60 people in religious group quarters
- 37 people in homes or halfway houses for drug/alcohol abuse
- 32 people in homes for the mentally retarded
- 13 people in job corps and vocational training facilities
- 6 people in homes for abused, dependent, and neglected children
For population 15 years and over in San Gorgonio Pass:
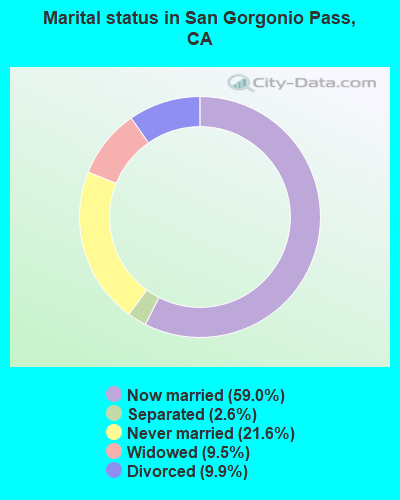
- Never married: 21.6%
- Now married: 59.0%
- Separated: 2.6%
- Widowed: 9.5%
- Divorced: 9.9%
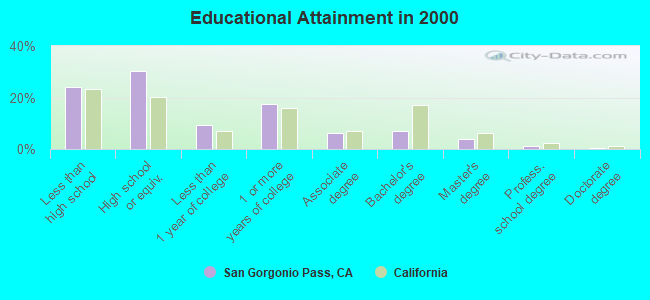
For population 25 years and over in San Gorgonio Pass:
- High school or higher: 75.8%
- Bachelor's degree or higher: 12.3%
- Graduate or professional degree: 5.4%
- Unemployed: 8.9%
- Mean travel time to work (commute): 26.5 minutes
| Here: | 12.2 |
| California average: | 16.1 |


Graphs represent county-level data. Detailed 2008 Election Results
Religion statistics for San Gorgonio Pass, CA (based on Riverside County data)


| Religion | Adherents | Congregations |
|---|---|---|
| Catholic | 602,765 | 51 |
| Evangelical Protestant | 240,306 | 741 |
| Other | 77,581 | 194 |
| Mainline Protestant | 29,535 | 103 |
| Black Protestant | 19,170 | 40 |
| Orthodox | 3,647 | 11 |
| None | 1,216,637 | - |
Food Environment Statistics:
| Riverside County: | 1.60 / 10,000 pop. |
| California: | 2.14 / 10,000 pop. |
| Riverside County: | 0.05 / 10,000 pop. |
| California: | 0.04 / 10,000 pop. |
| This county: | 0.44 / 10,000 pop. |
| State: | 0.62 / 10,000 pop. |
| Riverside County: | 1.51 / 10,000 pop. |
| California: | 1.49 / 10,000 pop. |
| Riverside County: | 5.45 / 10,000 pop. |
| California: | 7.42 / 10,000 pop. |
| Here: | 7.7% |
| California: | 7.3% |
| Riverside County: | 24.5% |
| California: | 21.3% |
| This county: | 15.2% |
| California: | 17.9% |
7.19% of this county's 2021 resident taxpayers lived in other counties in 2020 ($71,521 average adjusted gross income)
| Here: | 7.19% |
| California average: | 5.19% |
0.03% of residents moved from foreign countries ($210 average AGI)
Riverside County: 0.03% California average: 0.03%
Top counties from which taxpayers relocated into this county between 2020 and 2021:
| from Los Angeles County, CA | |
| from San Bernardino County, CA | |
| from Orange County, CA |
6.28% of this county's 2020 resident taxpayers moved to other counties in 2021 ($64,593 average adjusted gross income)
| Here: | 6.28% |
| California average: | 6.14% |
0.02% of residents moved to foreign countries ($200 average AGI)
Riverside County: 0.02% California average: 0.02%
Top counties to which taxpayers relocated from this county between 2020 and 2021:
| to San Bernardino County, CA | |
| to Los Angeles County, CA | |
| to Orange County, CA |
Strongest AM radio stations in San Gorgonio Pass:
- KMET (1490 AM; 1 kW; BANNING, CA; Owner: SUNSET BROADCASTING, INC.)
- KPLS (830 AM; 50 kW; ORANGE, CA; Owner: CRN LICENSES, LLC)
- KHPY (1670 AM; 10 kW; MORENO VALLEY, CA; Owner: DELBERT L. VAN VOORHIS)
- KLAC (570 AM; 50 kW; LOS ANGELES, CA; Owner: AMFM RADIO LICENSES, L.L.C.)
- KFI (640 AM; 50 kW; LOS ANGELES, CA; Owner: CAPSTAR TX LIMITED PARTNERSHIP)
- KNWQ (1140 AM; 10 kW; PALM SPRINGS, CA; Owner: MCC RADIO, LLC)
- KTNQ (1020 AM; 50 kW; LOS ANGELES, CA; Owner: KTNQ-AM LICENSE CORP.)
- KXTA (1150 AM; 50 kW; LOS ANGELES, CA; Owner: CITICASTERS LICENSES, L.P.)
- KDIS (1110 AM; 50 kW; PASADENA, CA; Owner: ABC,INC.)
- KFMB (760 AM; 50 kW; SAN DIEGO, CA; Owner: MIDWEST TELEVISION, INC.)
- KCAL (1410 AM; 5 kW; REDLANDS, CA; Owner: LAZER BROADCASTING CORPORATION)
- KFWB (980 AM; 50 kW; LOS ANGELES, CA; Owner: INFINITY BROADCASTING OPERATIONS, INC.)
- KPSI (920 AM; 5 kW; PALM SPRINGS, CA; Owner: R & R RADIO CORPORATION)
Strongest FM radio stations in San Gorgonio Pass:
- KLRD (90.1 FM; YUCAIPA, CA; Owner: EDUCATIONAL MEDIA FOUNDATION)
- K201AR (88.1 FM; BANNING, CA; Owner: KSGN, INC.)
- K232CX (94.3 FM; DESERT HOT SPRINGS, CA; Owner: MCC RADIO, LLC)
- KAEH (100.9 FM; BEAUMONT, CA; Owner: MOON BROADCASTING RIVERSIDE, LLC)
- KWRP (96.1 FM; SAN JACINTO, CA; Owner: MAGIC BROADCASTING, INC.)
- KPLM-FM2 (106.1 FM; SAN JACINTO, CA; Owner: RM BROADCASTING L.L.C.)
- KUOR-FM (89.1 FM; REDLANDS, CA; Owner: UNIVERSITY OF REDLANDS)
- KATY-FM (101.3 FM; IDYLLWILD, CA; Owner: ALL PRO BROADCASTING, INC.)
- KCXX (103.9 FM; LAKE ARROWHEAD, CA; Owner: ALL-PRO BROADCASTING, INC.)
- KRTM (88.9 FM; TEMECULA, CA; Owner: PENFOLD COMMUNICATIONS, INC.)
- KOLA (99.9 FM; SAN BERNARDINO, CA; Owner: INLAND EMPIRE BROADCASTING CORP.)
- KVCR (91.9 FM; SAN BERNARDINO, CA; Owner: SAN BERNARDINO COMMUNITY COLLEGE DISTRICT)
- KUCR (88.3 FM; RIVERSIDE, CA; Owner: THE REGENTS OF THE UNIV. OF CA)
- KXSB (101.7 FM; BIG BEAR LAKE, CA; Owner: LAZER BROADCASTING CORPORATION)
- KGGI (99.1 FM; RIVERSIDE, CA; Owner: AMFM RADIO LICENSES, L.L.C.)
- KLYY (97.5 FM; RIVERSIDE, CA; Owner: ENTRAVISION HOLDINGS, LLC)
- K201CD (88.1 FM; VICTORVILLE, CA; Owner: SAN BERNARDINO COMMNTY COLLEGE DIST.)
- KXRS (105.7 FM; HEMET, CA; Owner: LAZER BROADCASTING CORPORATION)
- K295AI (106.9 FM; MUSCOY, CA; Owner: ASSOCIATION FOR COMMUNITY EDUCATION, INC.)
- KWVE (107.9 FM; SAN CLEMENTE, CA; Owner: CALVARY CHAPEL OF COSTA MESA)
TV broadcast stations around San Gorgonio Pass:
- KTRO-LP (Channel 50; LANCASTER, CA; Owner: ROBERT D. ADELMAN)
- KHIZ (Channel 64; BARSTOW, CA; Owner: SUNBELT TELEVISION, INC.)
- KESQ-TV (Channel 42; PALM SPRINGS, CA; Owner: GULF-CALIFORNIA BROADCAST COMPANY)
- KVCR-TV (Channel 24; SAN BERNARDINO, CA; Owner: SAN BERNARDINO COMMUNITY COLLEGE DISTRICT)
- K27DS (Channel 27; YUCCA VALLEY, CA; Owner: GULF- CALIFORNIA BROADCAST COMPANY)
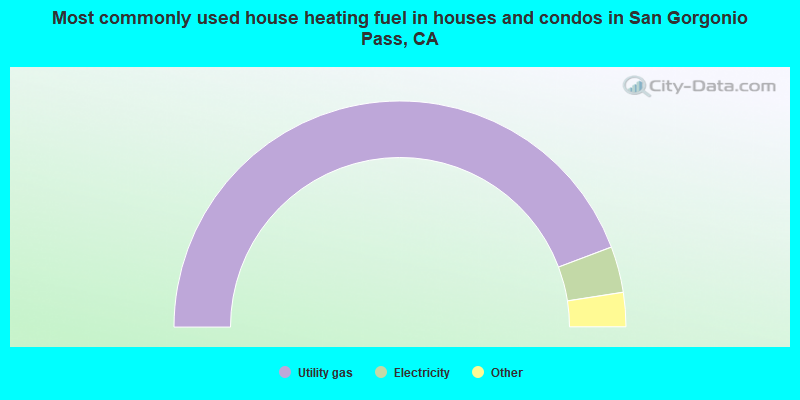
- 88.5%Utility gas
- 6.6%Electricity
- 2.7%Bottled, tank, or LP gas
- 1.7%Wood
- 0.3%Solar energy
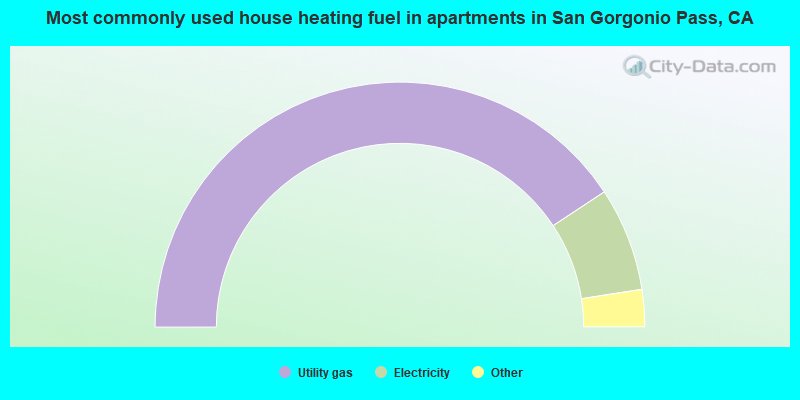
- 81.4%Utility gas
- 13.7%Electricity
- 3.2%Bottled, tank, or LP gas
- 0.6%No fuel used
- 0.6%Other fuel
- 0.3%Wood
- 0.1%Fuel oil, kerosene, etc.
San Gorgonio Pass compared to California state average:
- Median house value below state average.
- Unemployed percentage below state average.
- Median age above state average.
- Foreign-born population percentage significantly below state average.
- Renting percentage below state average.
- Length of stay since moving in significantly above state average.
- Number of rooms per house significantly below state average.
- House age significantly below state average.
- Percentage of population with a bachelor's degree or higher below state average.
San Gorgonio Pass on our top lists:
- #1 on the list of "Top 101 cities with largest percentage of females in occupations: occupational and physical therapist assistants and aides (population 50,000+)"
- #1 on the list of "Top 101 cities with largest percentage of males in industries: clothing and accessories, including shoe, stores (population 50,000+)"
- #1 on the list of "Top 101 cities with largest percentage of females in industries: lumber and other construction materials merchant wholesalers (population 50,000+)"
- #1 on the list of "Top 101 cities with largest percentage of males in industries: farm supplies merchant wholesalers (population 50,000+)"
- #1 on the list of "Top 101 cities with largest percentage of females in industries: clothing and accessories, including shoe, stores (population 50,000+)"
- #1 on the list of "Top 101 cities with largest percentage of females in occupations: material recording, scheduling, dispatching, and distributing workers (population 50,000+)"
- #2 on the list of "Top 101 cities with largest percentage of males in industries: private households (population 50,000+)"
- #2 on the list of "Top 101 cities with largest percentage of females in industries: nonmetallic mineral products (population 50,000+)"
- #2 on the list of "Top 101 cities with largest percentage of females in occupations: retail sales workers except cashiers (population 50,000+)"
- #2 on the list of "Top 101 cities with largest percentage of females in occupations: cooks and food preparation workers (population 50,000+)"
- #2 on the list of "Top 101 cities with largest percentage of females in industries: used merchandise, gift, novelty, and souvenir, and other miscellaneous stores (population 50,000+)"
- #2 on the list of "Top 101 cities with largest percentage of males in industries: lumber and other construction materials merchant wholesalers (population 50,000+)"
- #2 on the list of "Top 101 cities with largest percentage of males in occupations: cashiers (population 50,000+)"
- #2 on the list of "Top 101 cities with largest percentage of females in occupations: cashiers (population 50,000+)"
- #3 on the list of "Top 101 cities with largest percentage of males in industries: used merchandise, gift, novelty, and souvenir, and other miscellaneous stores (population 50,000+)"
- #3 on the list of "Top 101 cities with largest percentage of males in industries: plastics and rubber products (population 50,000+)"
- #4 on the list of "Top 101 cities with largest percentage of males in industries: wood products (population 50,000+)"
- #4 on the list of "Top 101 cities with largest percentage of females in industries: motor vehicle and parts dealers (population 50,000+)"
- #4 on the list of "Top 101 cities with largest percentage of females in industries: gasoline stations (population 50,000+)"
- #5 on the list of "Top 101 cities with largest percentage of females in industries: motor vehicles, parts and supplies merchant wholesalers (population 50,000+)"
- #3 on the list of "Top 101 counties with the highest lead air pollution readings in 2012 (µg/m3)"
- #4 on the list of "Top 101 counties with the highest ground withdrawal of fresh water for public supply"
- #11 on the list of "Top 101 counties with the most Catholic adherents"
- #11 on the list of "Top 101 counties with the highest total withdrawal of fresh water for public supply"
- #12 on the list of "Top 101 counties with the highest carbon monoxide air pollution readings in 2012 (ppm)"