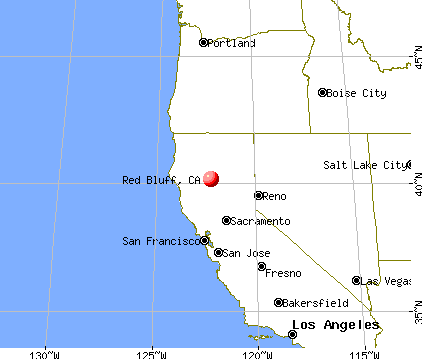
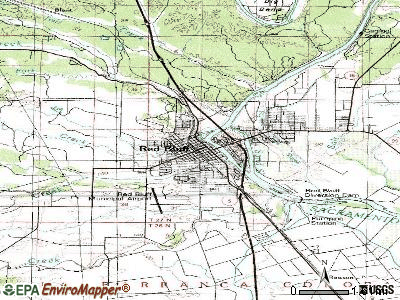
Red Bluff, California

Red Bluff: Sunrise in Red Bluff
Red Bluff: Red bridge Red Bluff CA
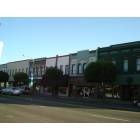
Red Bluff: Main Street
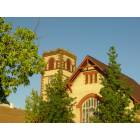
Red Bluff: Downtown Church
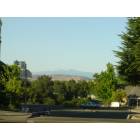
Red Bluff: View of Mt. Lassen from Downtown
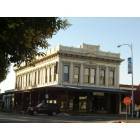
Red Bluff: I.O.O.F. Building- Downtown
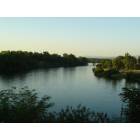
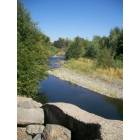
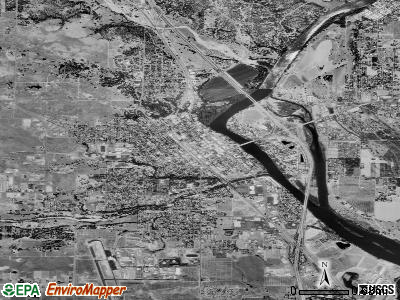
Red Bluff: View of the Sacramento River near Main Street

Red Bluff: Sunset over Red Bluff, Ca.
Red Bluff: Red bridge Red Bluff CA
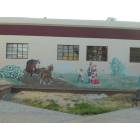
Red Bluff: Downtown Mural
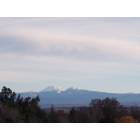
Red Bluff: Volcanic Mt. Lassen east of Red Bluff, Ca.
- see
23
more - add
your


Submit your own pictures of this city and show them to the world
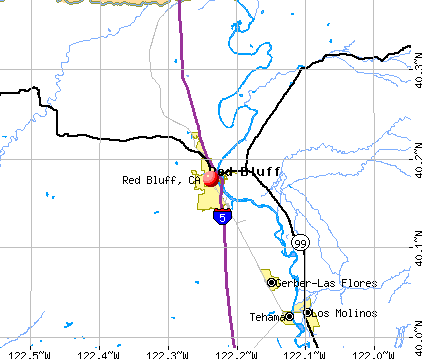
- OSM Map
- General Map
- Google Map
- MSN Map
Population change since 2000: +9.7%
 |
| Males: 7,219 | |
| Females: 7,197 |
| Median resident age: | 35.7 years |
| California median age: | 37.9 years |
Zip codes: 96080.
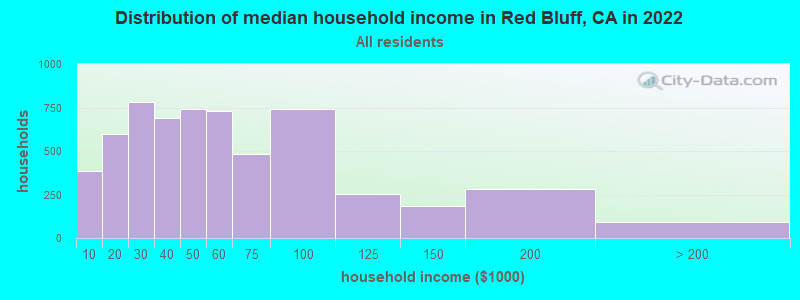
| Red Bluff: | $47,251 |
| CA: | $91,551 |
Estimated per capita income in 2022: $32,988 (it was $14,060 in 2000)
Red Bluff city income, earnings, and wages data
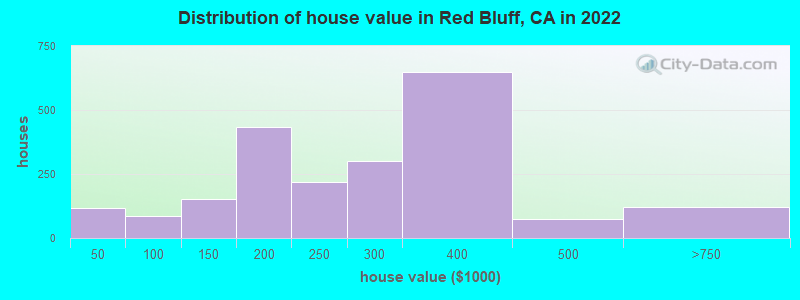
Estimated median house or condo value in 2022: $303,814 (it was $84,600 in 2000)
| Red Bluff: | $303,814 |
| CA: | $715,900 |
Mean prices in 2022: all housing units: $282,011; detached houses: $293,835; townhouses or other attached units: $181,769; mobile homes: $85,394
Median gross rent in 2022: $1,036.
(19.5% for White Non-Hispanic residents, 10.7% for Black residents, 28.1% for Hispanic or Latino residents, 33.5% for American Indian residents, 24.2% for other race residents, 14.8% for two or more races residents)
Detailed information about poverty and poor residents in Red Bluff, CA


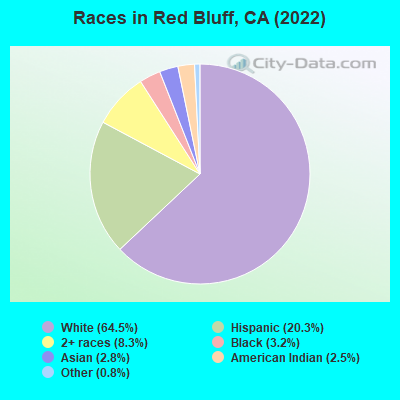
- 9,36964.5%White alone
- 2,94220.3%Hispanic
- 1,2038.3%Two or more races
- 4623.2%Black alone
- 4052.8%Asian alone
- 3682.5%American Indian alone
- 1150.8%Other race alone
According to our research of California and other state lists, there were 107 registered sex offenders living in Red Bluff, California as of May 09, 2024.
The ratio of all residents to sex offenders in Red Bluff is 133 to 1.
Type |
2009 |
2010 |
2011 |
2012 |
2013 |
2014 |
2015 |
2016 |
2017 |
2018 |
2019 |
2020 |
2021 |
2022 |
|---|---|---|---|---|---|---|---|---|---|---|---|---|---|---|
| Murders (per 100,000) | 0 (0.0) | 0 (0.0) | 1 (7.0) | 0 (0.0) | 3 (21.2) | 1 (7.1) | 0 (0.0) | 0 (0.0) | 0 (0.0) | 2 (14.0) | 1 (7.0) | 1 (6.9) | 1 (7.1) | 1 (6.9) |
| Rapes (per 100,000) | 6 (42.5) | 14 (99.5) | 3 (21.1) | 8 (56.2) | 9 (63.5) | 14 (99.3) | 13 (92.6) | 20 (141.5) | 29 (204.7) | 24 (167.7) | 26 (181.7) | 33 (226.2) | 16 (113.3) | 19 (130.8) |
| Robberies (per 100,000) | 15 (106.3) | 14 (99.5) | 17 (119.4) | 21 (147.5) | 19 (134.1) | 25 (177.3) | 25 (178.0) | 35 (247.6) | 31 (218.8) | 20 (139.7) | 14 (97.8) | 26 (178.2) | 16 (113.3) | 29 (199.6) |
| Assaults (per 100,000) | 103 (729.9) | 114 (809.9) | 83 (582.8) | 83 (583.0) | 115 (811.6) | 89 (631.1) | 80 (569.6) | 104 (735.6) | 100 (705.8) | 119 (831.3) | 92 (643.0) | 84 (575.7) | 82 (580.5) | 84 (578.2) |
| Burglaries (per 100,000) | 168 (1,191) | 292 (2,074) | 218 (1,531) | 249 (1,749) | 291 (2,054) | 244 (1,730) | 221 (1,574) | 260 (1,839) | 156 (1,101) | 151 (1,055) | 205 (1,433) | 113 (774.5) | 97 (686.7) | 81 (557.5) |
| Thefts (per 100,000) | 480 (3,402) | 578 (4,106) | 481 (3,378) | 531 (3,730) | 570 (4,023) | 573 (4,063) | 675 (4,806) | 719 (5,086) | 698 (4,926) | 451 (3,151) | 467 (3,264) | 444 (3,043) | 302 (2,138) | 515 (3,545) |
| Auto thefts (per 100,000) | 32 (226.8) | 30 (213.1) | 25 (175.5) | 31 (217.8) | 77 (543.4) | 94 (666.5) | 99 (704.9) | 118 (834.6) | 106 (748.1) | 117 (817.3) | 115 (803.7) | 80 (548.3) | 75 (530.9) | 126 (867.2) |
| Arson (per 100,000) | 8 (56.7) | 5 (35.5) | 1 (7.0) | 4 (28.1) | 3 (21.2) | 4 (28.4) | 3 (21.4) | 8 (56.6) | 10 (70.6) | 14 (97.8) | 21 (146.8) | 30 (205.6) | 29 (205.3) | 43 (296.0) |
| City-Data.com crime index | 449.4 | 597.9 | 439.6 | 494.9 | 643.8 | 609.9 | 600.1 | 733.5 | 704.5 | 635.5 | 612.5 | 583.1 | 430.9 | 544.1 |
The City-Data.com crime index weighs serious crimes and violent crimes more heavily. Higher means more crime, U.S. average is 246.1. It adjusts for the number of visitors and daily workers commuting into cities.
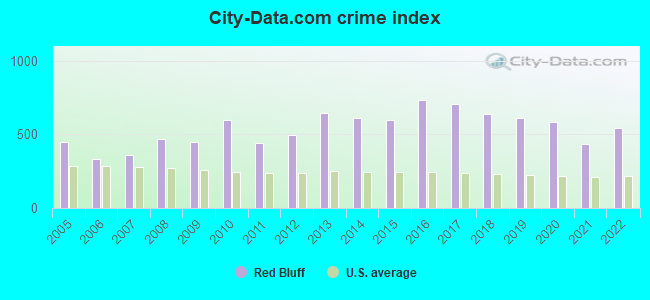
Crime rate in Red Bluff detailed stats: murders, rapes, robberies, assaults, burglaries, thefts, arson
Full-time law enforcement employees in 2021, including police officers: 39 (25 officers - 22 male; 3 female).
| Officers per 1,000 residents here: | 1.77 |
| California average: | 2.30 |
 Recent articles from our blog. Our writers, many of them Ph.D. graduates or candidates, create easy-to-read articles on a wide variety of topics.


 | Do we underestimate and downplay how Great Sacramento weather really is? (4550 replies) |
| Paradise Fire/Camp Creek Fire 11/08/2018 (783 replies) |
| Please help with info on Red Bluff!! (7 replies) |
| CA Statistical Areas by Percent of Non-White Hispanics, 2020 Census (2 replies) |
| Redding / Shasta - Talk me into it... or out of it... (33 replies) |
| California’s Most Dangerous Cities (13 replies) |
Latest news from Red Bluff, CA collected exclusively by city-data.com from local newspapers, TV, and radio stations
Ancestries: American (15.1%), English (10.1%), European (9.3%), Irish (9.1%), German (7.1%), Italian (3.2%).
Current Local Time: PST time zone
Elevation: 309 feet
Land area: 7.43 square miles.
Population density: 1,939 people per square mile (low).
926 residents are foreign born (3.7% Latin America, 1.2% Asia, 0.8% Europe).
| This city: | 6.4% |
| California: | 26.5% |
Median real estate property taxes paid for housing units with mortgages in 2022: $1,603 (0.5%)
Median real estate property taxes paid for housing units with no mortgage in 2022: $1,300 (0.5%)
Nearest city with pop. 50,000+: Redding, CA  (28.5 miles , pop. 80,865).
Nearest city with pop. 200,000+: Sacramento, CA (119.4 miles , pop. 407,018).
Nearest city with pop. 1,000,000+: Los Angeles, CA (471.9 miles , pop. 3,694,820).
Nearest cities:
), ), ), ), ), )Latitude: 40.18 N, Longitude: 122.24 W
Daytime population change due to commuting: +4,631 (+31.9%)
Workers who live and work in this city: 2,612 (56.1%)
Area code: 530
Red Bluff, California accommodation & food services, waste management - Economy and Business Data
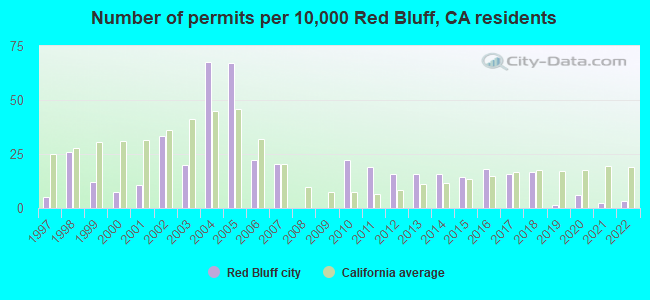
Single-family new house construction building permits:
- 2022: 4 buildings, average cost: $281,000
- 2021: 3 buildings, average cost: $208,800
- 2020: 8 buildings, average cost: $270,200
- 2019: 2 buildings, average cost: $289,600
- 2018: 22 buildings, average cost: $176,900
- 2017: 21 buildings, average cost: $176,900
- 2016: 24 buildings, average cost: $163,500
- 2015: 19 buildings, average cost: $163,500
- 2014: 21 buildings, average cost: $178,800
- 2013: 21 buildings, average cost: $178,800
- 2012: 21 buildings, average cost: $178,800
- 2011: 25 buildings, average cost: $171,000
- 2010: 29 buildings, average cost: $171,000
- 2007: 27 buildings, average cost: $161,300
- 2006: 29 buildings, average cost: $119,500
- 2005: 88 buildings, average cost: $110,800
- 2004: 89 buildings, average cost: $177,800
- 2003: 26 buildings, average cost: $115,900
- 2002: 44 buildings, average cost: $117,000
- 2001: 14 buildings, average cost: $49,400
- 2000: 10 buildings, average cost: $99,000
- 1999: 16 buildings, average cost: $88,000
- 1998: 34 buildings, average cost: $86,000
- 1997: 7 buildings, average cost: $91,200

| Here: | 6.4% |
| California: | 5.1% |
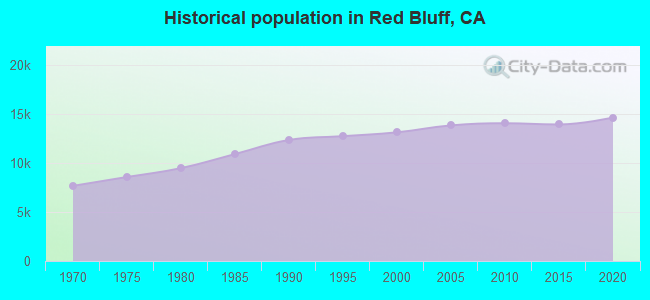
Population change in the 1990s: +477 (+3.8%).
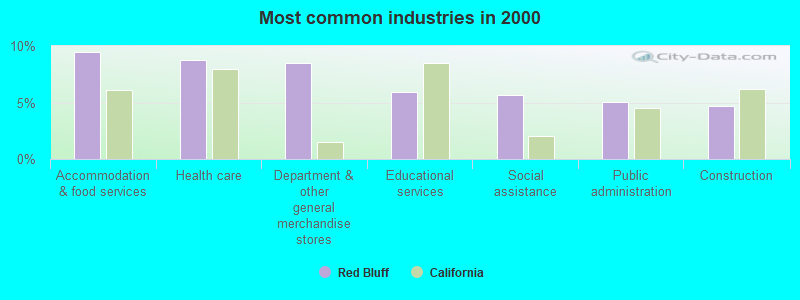
- Accommodation & food services (9.5%)
- Health care (8.7%)
- Department & other general merchandise stores (8.5%)
- Educational services (6.0%)
- Social assistance (5.7%)
- Public administration (5.1%)
- Construction (4.7%)
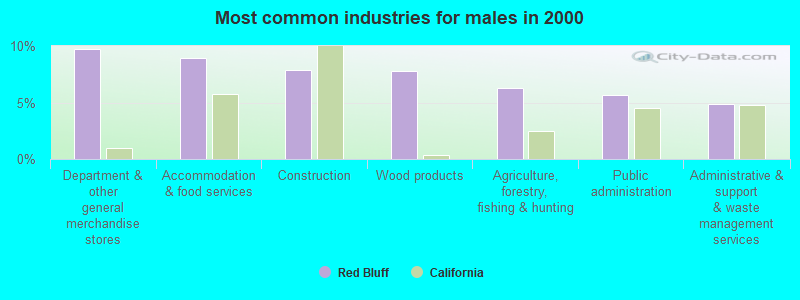
- Department & other general merchandise stores (9.7%)
- Accommodation & food services (8.9%)
- Construction (7.9%)
- Wood products (7.7%)
- Agriculture, forestry, fishing & hunting (6.3%)
- Public administration (5.6%)
- Administrative & support & waste management services (4.9%)
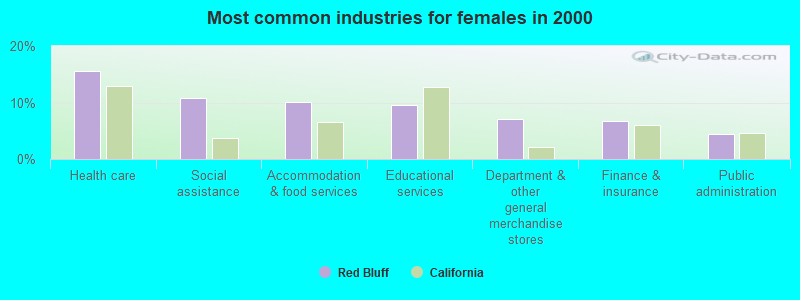
- Health care (15.6%)
- Social assistance (10.7%)
- Accommodation & food services (10.1%)
- Educational services (9.5%)
- Department & other general merchandise stores (7.1%)
- Finance & insurance (6.7%)
- Public administration (4.5%)
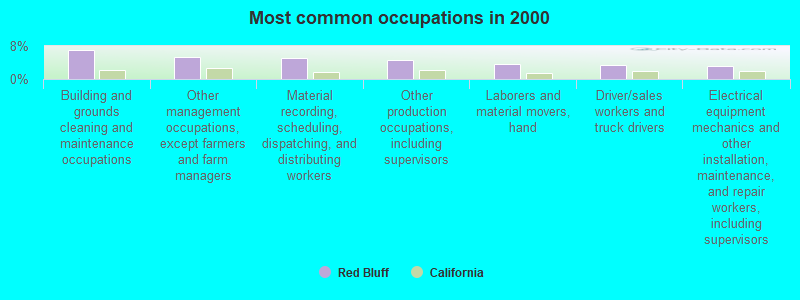
- Building and grounds cleaning and maintenance occupations (7.1%)
- Other management occupations, except farmers and farm managers (5.2%)
- Material recording, scheduling, dispatching, and distributing workers (5.0%)
- Other production occupations, including supervisors (4.6%)
- Laborers and material movers, hand (3.5%)
- Driver/sales workers and truck drivers (3.3%)
- Electrical equipment mechanics and other installation, maintenance, and repair workers, including supervisors (3.1%)
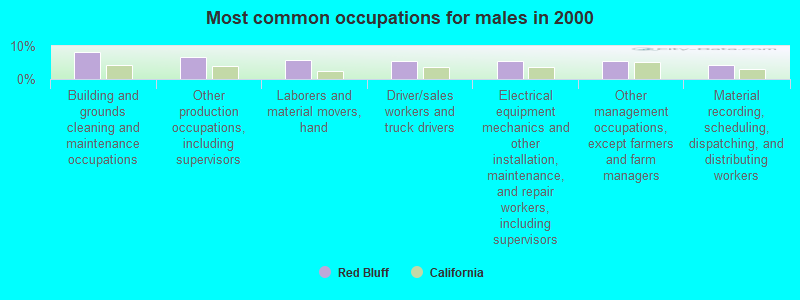
- Building and grounds cleaning and maintenance occupations (8.3%)
- Other production occupations, including supervisors (6.7%)
- Laborers and material movers, hand (5.6%)
- Driver/sales workers and truck drivers (5.6%)
- Electrical equipment mechanics and other installation, maintenance, and repair workers, including supervisors (5.4%)
- Other management occupations, except farmers and farm managers (5.3%)
- Material recording, scheduling, dispatching, and distributing workers (4.2%)
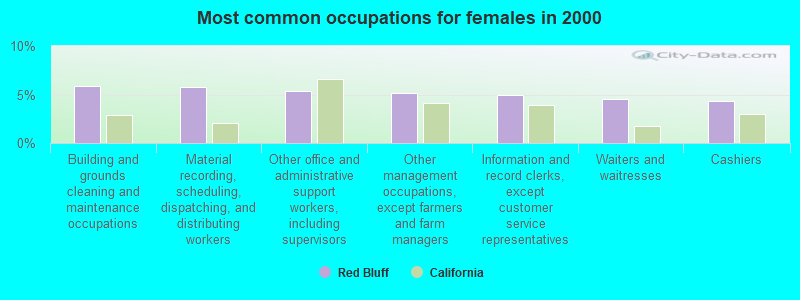
- Building and grounds cleaning and maintenance occupations (5.9%)
- Material recording, scheduling, dispatching, and distributing workers (5.8%)
- Other office and administrative support workers, including supervisors (5.3%)
- Other management occupations, except farmers and farm managers (5.1%)
- Information and record clerks, except customer service representatives (5.0%)
- Waiters and waitresses (4.5%)
- Cashiers (4.3%)
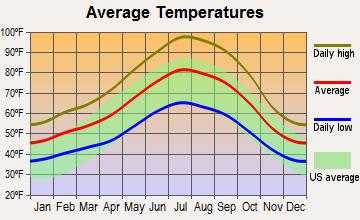
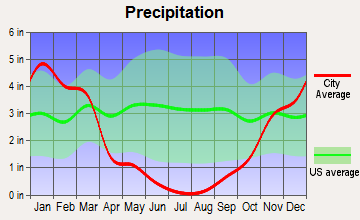
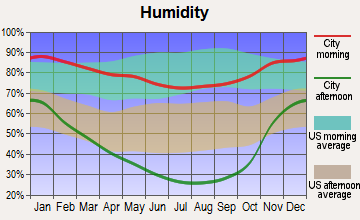
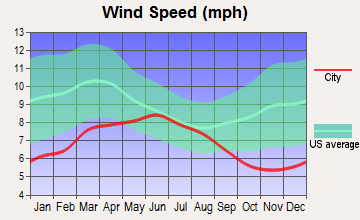
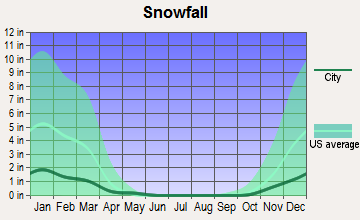
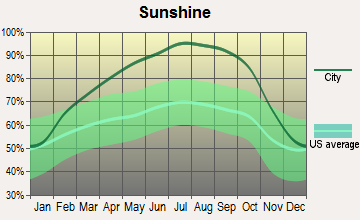
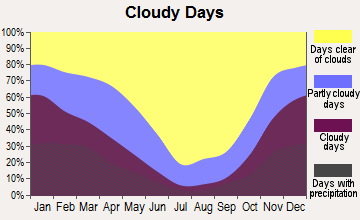
Average climate in Red Bluff, California
Based on data reported by over 4,000 weather stations
|
|

(lower is better)
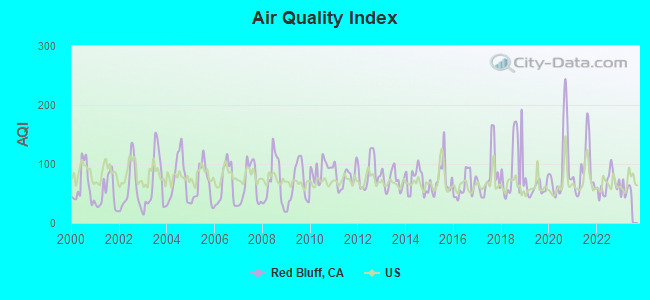
Air Quality Index (AQI) level in 2022 was 66.5. This is about average.
| City: | 66.5 |
| U.S.: | 72.6 |
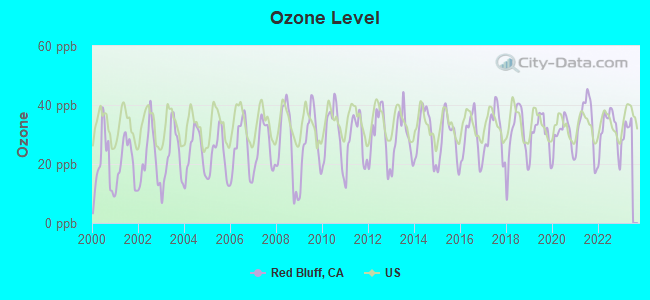
Ozone [ppb] level in 2022 was 31.4. This is about average. Closest monitor was 0.1 miles away from the city center.
| City: | 31.4 |
| U.S.: | 33.3 |
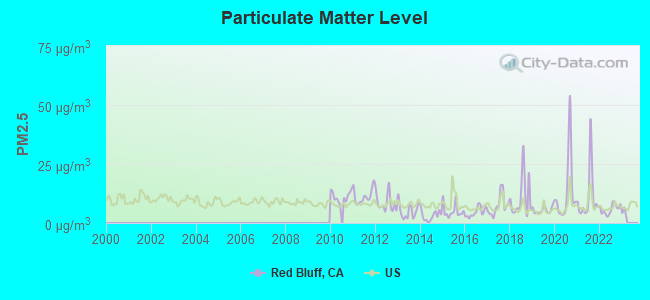
Particulate Matter (PM2.5) [µg/m3] level in 2022 was 5.87. This is better than average. Closest monitor was 0.8 miles away from the city center.
| City: | 5.87 |
| U.S.: | 8.11 |
Earthquake activity:
Red Bluff-area historical earthquake activity is significantly above California state average. It is 5644% greater than the overall U.S. average.On 4/18/1906 at 13:12:21, a magnitude 7.9 (7.9 UK, Class: Major, Intensity: VIII - XII) earthquake occurred 156.0 miles away from the city center, causing $524,000,000 total damage
On 1/31/1922 at 13:17:28, a magnitude 7.6 (7.6 UK) earthquake occurred 178.2 miles away from Red Bluff center
On 4/25/1992 at 18:06:04, a magnitude 7.2 (6.3 MB, 7.1 MS, 7.2 MW, 7.1 MW, Depth: 9.4 mi) earthquake occurred 97.3 miles away from the city center, causing $75,000,000 total damage
On 11/8/1980 at 10:27:34, a magnitude 7.2 (6.2 MB, 7.2 MS, 7.2 MW, 7.0 ML) earthquake occurred 126.0 miles away from the city center
On 10/3/1915 at 06:52:48, a magnitude 7.6 (7.6 UK) earthquake occurred 250.8 miles away from Red Bluff center
On 1/22/1923 at 09:04:18, a magnitude 7.2 (7.2 UK) earthquake occurred 164.1 miles away from Red Bluff center
Magnitude types: body-wave magnitude (MB), local magnitude (ML), surface-wave magnitude (MS), moment magnitude (MW)
Natural disasters:
The number of natural disasters in Tehama County (19) is greater than the US average (15).Major Disasters (Presidential) Declared: 12
Emergencies Declared: 3
Causes of natural disasters: Floods: 13, Storms: 7, Winter Storms: 6, Landslides: 4, Fires: 2, Mudslides: 2, Drought: 1, Freeze: 1, Heavy Rain: 1, Hurricane: 1, Tornado: 1, Other: 1 (Note: some incidents may be assigned to more than one category).
Hospitals and medical centers in Red Bluff:
Airports located in Red Bluff:
- Red Bluff Municipal Airport (RBL) (Runways: 1, Air Taxi Ops: 1,000, Itinerant Ops: 15,000, Local Ops: 10,000, Military Ops: 150)
- Rancho Tehama Airport (49CN) (Runways: 1)
Colleges/universities with over 2000 students nearest to Red Bluff:
- Shasta College (about 32 miles; Redding, CA; Full-time enrollment: 5,645)
- California State University-Chico (about 38 miles; Chico, CA; FT enrollment: 14,838)
- Butte College (about 49 miles; Oroville, CA; FT enrollment: 8,649)
- Yuba College (about 82 miles; Marysville, CA; FT enrollment: 4,737)
- Mendocino College (about 87 miles; Ukiah, CA; FT enrollment: 2,263)
- Humboldt State University (about 109 miles; Arcata, CA; FT enrollment: 7,353)
- College of the Redwoods (about 110 miles; Eureka, CA; FT enrollment: 4,410)
Public high schools in Red Bluff:
- RED BLUFF HIGH (Students: 1,231, Location: 1260 UNION ST., Grades: 9-12)
- SALISBURY HIGH (CONTINUATION) (Students: 29, Location: 1050 KIMBALL RD., Grades: 9-12)
- TEHAMA COUNTY SPECIAL EDUCATION (Students: 27, Location: 900 PALM ST., Grades: KG-12)
- TEHAMA COUNTY JUVENILE JUSTICE CENTER (Students: 8, Location: 1790 WALNUT ST., Grades: KG-12)
- REBOUND (Students: 1, Location: 1525 DOUGLASS ST, Grades: 9-12)
- TEHAMA COUNTY ROP (Location: 1135 LINCOLN ST., Grades: 10-12)
- TEHAMA ELEARNING ACADEMY (Location: 715 JACKSON ST., STE. B, Grades: KG-12, Charter school)
- TEHAMA COUNTY COMMUNITY (Location: 900 PALM ST., Grades: KG-12)
Private high school in Red Bluff:
Biggest public elementary/middle schools in Red Bluff:
- WILLIAM M. METTEER ELEMENTARY (Students: 431, Location: 695 KIMBALL RD., Grades: KG-5)
- BIDWELL ELEMENTARY (Students: 382, Location: 1256 WALNUT ST., Grades: KG-5)
- JACKSON HEIGHTS ELEMENTARY (Students: 314, Location: 225 S. JACKSON ST., Grades: KG-5)
- BERRENDOS MIDDLE (Students: 222, Location: 401 CHESTNUT AVE., Grades: 6-8)
- REEDS CREEK ELEMENTARY (Students: 109, Location: 18335 JOHNSON RD., Grades: KG-8)
- RED BLUFF COMMUNITY DAY (Students: 13, Location: 1050A DUMOSA ST., Grades: 5-8)
- ANTELOPE COMMUNITY DAY (Students: 5, Location: 22630 ANTELOPE BLVD., Grades: KG-8)
- BEND ELEMENTARY (Location: 22270 BEND FERRY RD., Grades: KG-8)
- VISTA PREPARATORY ACADEMY (Location: 1770 S. JACKSON ST., Grades: 6-8)
- RED BLUFF COMMUNITY DAY K-5 (Location: 695 KIMBALL RD., Grades: KG-5)
Private elementary/middle schools in Red Bluff:
User-submitted facts and corrections:
- Red Bluff was one of the first citys chosen to be the capital of Californa. However Sacromento was chosen because of its central location.
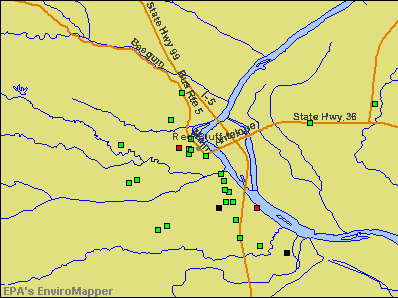
Points of interest:
Notable locations in Red Bluff: Oak Creek Golf Course (A), Veterans Memorial Building (B), Tehama County Courthouse (C), Red Bluff City Hall (D), Herbert Kraft Free Library (E), Tehama County Fire Department Station 1 Red Bluff Headquarters (F), Red Bluff Fire Department (G). Display/hide their locations on the map
Churches in Red Bluff include: Saint Peters Episcopal Church (A), Saint Pauls Lutheran Church (B), Sacred Heart Roman Catholic Church (C), Gospel Church (D), First Presbyterian Church (E), First Methodist Church (F), First Church of Christ Scientist (G), First Christian Church (H), First Baptist Church (I). Display/hide their locations on the map
Cemeteries: Oak Hill Cemetery (1), Saint Marys Cemetery (2). Display/hide their locations on the map
Creeks: Brewery Creek (A), Brickyard Creek (B). Display/hide their locations on the map
Parks in Red Bluff include: Ayer Park (1), Diamond Park (2), Fry Field (3), Red Bluff City Park (4), Forward Park (5). Display/hide their locations on the map
Hotels: Best Value Inn & Suites (Bv) (30 Gilmore Rd), Best Inn & Suites Red Bluff (90 Sale Lane).
Birthplace of: Chuck Cecil - College football player, Al Geiberger - Professional golfer, Michael Chiarello - Chef, Bill Redell - Football player and coach, Claude C. McColloch - Politician and judge, Ann Baskins - Business executive, Gale Gilbert - Football player, Jesse Freitas - Football player, Jim Davis (baseball) - Baseball player, Roy Joiner - Baseball player.
Drinking water stations with addresses in Red Bluff and their reported violations in the past:
USFS BAILEY COVE CAMPGROUND (Population served: 80, Groundwater):Past health violations:BREESE SUBDIVISION 2 (Population served: 75, Groundwater):Past monitoring violations:
- MCL, Monthly (TCR) - Between OCT-2012 and DEC-2012, Contaminant: Coliform. Follow-up actions: St Public Notif received (NOV-19-2012), St AO (w/o penalty) issued (NOV-20-2012), St Compliance achieved (MAR-10-2014)
- MCL, Monthly (TCR) - Between JUL-2012 and SEP-2012, Contaminant: Coliform. Follow-up actions: St AO (w/o penalty) issued (AUG-13-2012)
- MCL, Monthly (TCR) - In MAY-2011, Contaminant: Coliform. Follow-up actions: St AO (w/o penalty) issued (MAY-17-2011), St Compliance achieved (MAY-17-2011), St Public Notif received (MAY-23-2011)
- One routine major monitoring violation
Past health violations:WILCOX OAKS GOLF CLUB (Population served: 75, Groundwater):Past monitoring violations:
- MCL, Monthly (TCR) - In JAN-2008, Contaminant: Coliform. Follow-up actions: St Public Notif requested (JAN-15-2008), St Violation/Reminder Notice (JAN-15-2008), St Compliance achieved (FEB-06-2008)
- Monitoring and Reporting (DBP) - Between JAN-2009 and DEC-2009, Contaminant: TTHM
Past health violations:TEHAMA CO.-RIDGEWAY PARK (Population served: 45, Groundwater):
- MCL, Acute (TCR) - In SEP-2005, Contaminant: Coliform. Follow-up actions: St Public Notif requested (SEP-22-2005), St Violation/Reminder Notice (SEP-22-2005), St Compliance achieved (OCT-03-2005)
Past monitoring violations:TEHAMA CO.-MILL CREEK PARK (Population served: 40, Groundwater):
- One routine major monitoring violation
Past monitoring violations:TEHAMA CO.-CONE GROVE PARK (Population served: 25, Groundwater):
- One routine major monitoring violation
- One minor monitoring violation
Past monitoring violations:TEHAMA CO.-RIVER PARK (Population served: 25, Groundwater):
- One routine major monitoring violation
Past health violations:ANTOINETTE MUTUAL WATER CO (Population served: 25, Groundwater):Past monitoring violations:
- MCL, Monthly (TCR) - In FEB-2006, Contaminant: Coliform. Follow-up actions: St Public Notif requested (FEB-14-2006), St Violation/Reminder Notice (FEB-14-2006), St Compliance achieved (MAY-22-2006)
- One routine major monitoring violation
Past monitoring violations:
- 2 routine major monitoring violations
- One minor monitoring violation
- 2 regular monitoring violations
Drinking water stations with addresses in Red Bluff that have no violations reported:
- USFS - MARINERS PT/SKI ISLAND (Population served: 60, Primary Water Source Type: Groundwater)
- MOOSE LODGE (Population served: 40, Primary Water Source Type: Groundwater)
- OAK CREEK GOLF CLUB (Population served: 40, Primary Water Source Type: Groundwater)
- NORCAL NURSERY INC (Address: 11810 HIGHWAY 99 EAST , Population served: 35, Primary Water Source Type: Groundwater)
- SPORTSMAN MOTEL (Population served: 25, Primary Water Source Type: Groundwater)
- COMMUNITY BAPTIST CHURCH (Population served: 25, Primary Water Source Type: Groundwater)
| This city: | 2.5 people |
| California: | 2.9 people |
| This city: | 63.2% |
| Whole state: | 68.7% |
| This city: | 10.5% |
| Whole state: | 7.2% |
Likely homosexual households (counted as self-reported same-sex unmarried-partner households)
- Lesbian couples: 0.4% of all households
- Gay men: 0.1% of all households
People in group quarters in Red Bluff in 2010:
- 178 people in local jails and other municipal confinement facilities
- 96 people in nursing facilities/skilled-nursing facilities
- 80 people in group homes intended for adults
- 63 people in other noninstitutional facilities
- 15 people in correctional facilities intended for juveniles
- 7 people in residential treatment centers for adults
People in group quarters in Red Bluff in 2000:
- 254 people in nursing homes
- 197 people in local jails and other confinement facilities (including police lockups)
- 28 people in short-term care, detention or diagnostic centers for delinquent children
- 26 people in homes for the mentally ill
- 14 people in other noninstitutional group quarters
- 13 people in other group homes
- 3 people in homes for the mentally retarded
Banks with branches in Red Bluff (2011 data):
- U.S. Bank National Association: Red Bluff Branch at 801 Main Street, branch established on 1934/12/08. Info updated 2012/01/30: Bank assets: $330,470.8 mil, Deposits: $236,091.5 mil, headquarters in Cincinnati, OH, positive income, 3121 total offices, Holding Company: U.S. Bancorp
- Wells Fargo Bank, National Association: Red Bluff Branch at 555 Walnut Street, branch established on 1962/09/21. Info updated 2011/04/05: Bank assets: $1,161,490.0 mil, Deposits: $905,653.0 mil, headquarters in Sioux Falls, SD, positive income, 6395 total offices, Holding Company: Wells Fargo & Company
- PremierWest Bank: Red Bluff Branch at 950 Main Street, branch established on 1975/09/02. Info updated 2011/05/20: Bank assets: $1,264.9 mil, Deposits: $1,128.9 mil, headquarters in Medford, OR, negative income in the last year, Commercial Lending Specialization, 46 total offices, Holding Company: Premierwest Bancorp
- Rabobank, National Association: Red Bluff Branch at 500 Luther Road, branch established on 2004/05/10. Info updated 2011/01/27: Bank assets: $11,745.0 mil, Deposits: $8,446.0 mil, headquarters in Roseville, CA, positive income, Agricultural Specialization, 124 total offices, Holding Company: Cooperatieve Centrale Raiffeisen-Boerenleenbank B.A., "rabobank Nederland
- Cornerstone Community Bank: at 237 South Main Street, branch established on 2006/10/23. Info updated 2012/04/04: Bank assets: $91.3 mil, Deposits: $80.6 mil, local headquarters, positive income, Commercial Lending Specialization, 1 total offices
- Tri Counties Bank: Red Bluff Branch at 727 South Main Street, branch established on 1994/03/07. Info updated 2011/09/26: Bank assets: $2,554.4 mil, Deposits: $2,191.2 mil, headquarters in Chico, CA, positive income, Commercial Lending Specialization, 71 total offices, Holding Company: Trico Bancshares
- Umpqua Bank: Red Bluff Branch at 333 Main Street, branch established on 1984/08/30. Info updated 2011/09/02: Bank assets: $11,556.7 mil, Deposits: $9,325.3 mil, headquarters in Roseburg, OR, positive income, Commercial Lending Specialization, 193 total offices, Holding Company: Umpqua Holdings Corporation
- Bank of America, National Association: Red Bluff Branch at 955 Main Street, branch established on 1934/12/24. Info updated 2009/11/18: Bank assets: $1,451,969.3 mil, Deposits: $1,077,176.8 mil, headquarters in Charlotte, NC, positive income, 5782 total offices, Holding Company: Bank Of America Corporation
For population 15 years and over in Red Bluff:
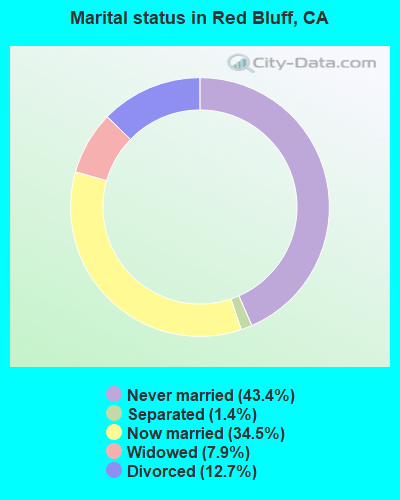
- Never married: 43.4%
- Now married: 34.5%
- Separated: 1.4%
- Widowed: 7.9%
- Divorced: 12.7%
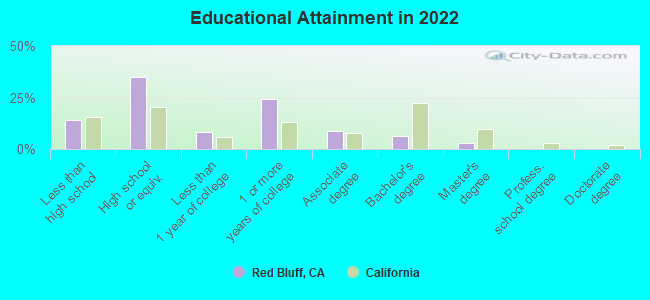
For population 25 years and over in Red Bluff:
- High school or higher: 88.6%
- Bachelor's degree or higher: 10.8%
- Graduate or professional degree: 3.2%
- Unemployed: 11.2%
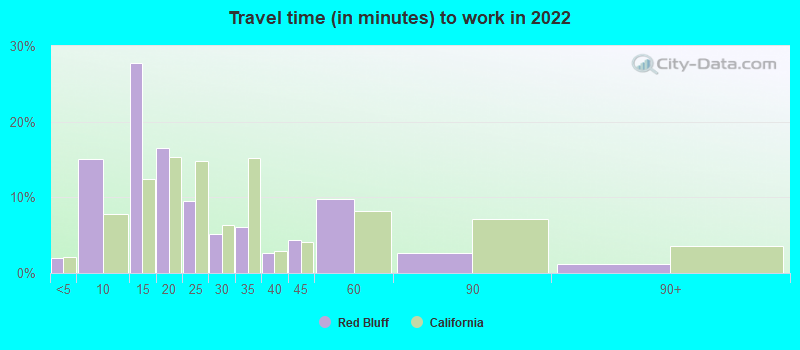
- Mean travel time to work (commute): 16.5 minutes
| Here: | 9.3 |
| California average: | 15.5 |
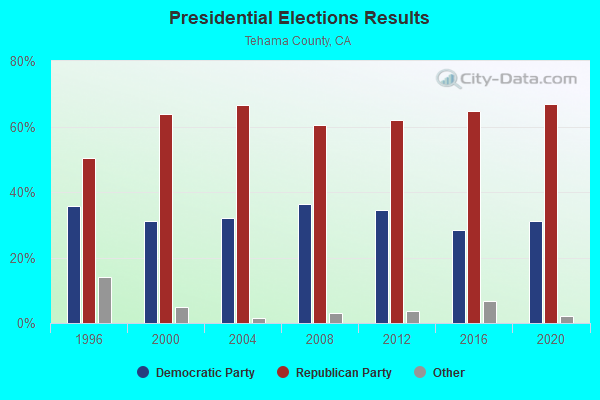
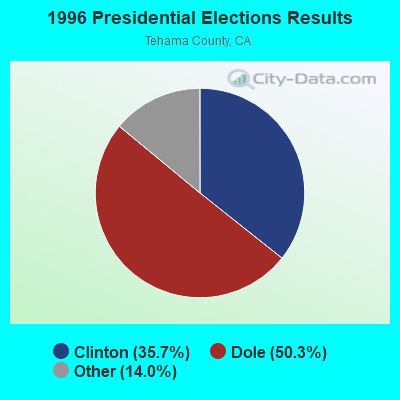

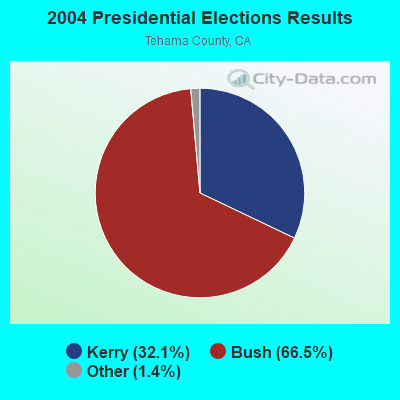
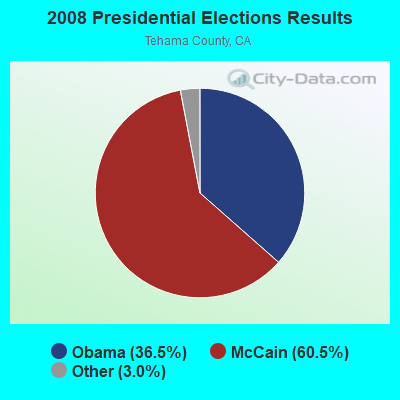
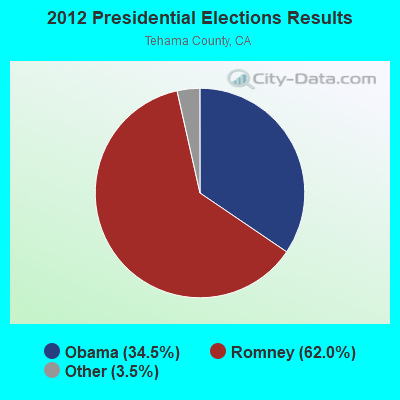
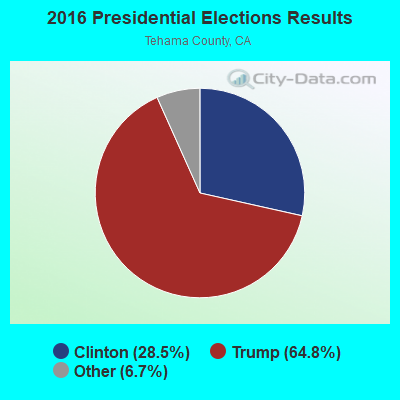

Graphs represent county-level data. Detailed 2008 Election Results
Religion statistics for Red Bluff, CA (based on Tehama County data)
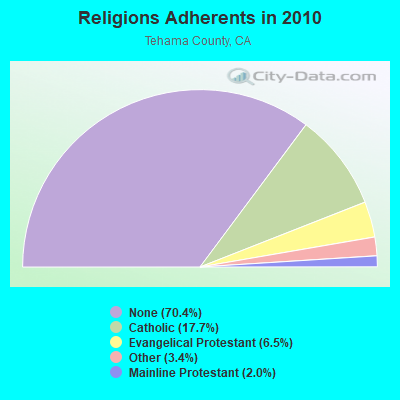
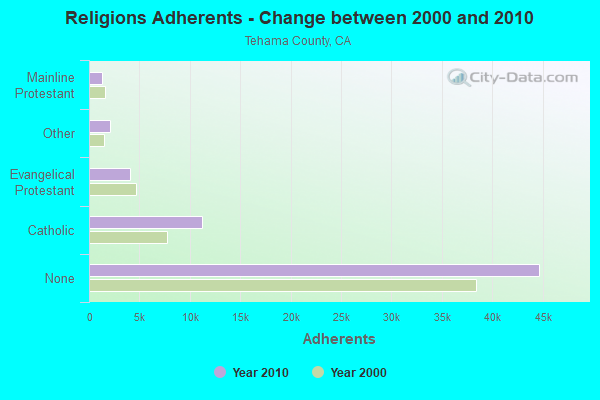
| Religion | Adherents | Congregations |
|---|---|---|
| Catholic | 11,243 | 3 |
| Evangelical Protestant | 4,100 | 39 |
| Other | 2,130 | 6 |
| Mainline Protestant | 1,280 | 11 |
| Orthodox | 20 | 1 |
| None | 44,690 | - |
Food Environment Statistics:
| Tehama County: | 1.80 / 10,000 pop. |
| California: | 2.14 / 10,000 pop. |
| Here: | 0.98 / 10,000 pop. |
| State: | 0.62 / 10,000 pop. |
| Tehama County: | 3.12 / 10,000 pop. |
| California: | 1.49 / 10,000 pop. |
| Tehama County: | 4.76 / 10,000 pop. |
| State: | 7.42 / 10,000 pop. |
| Tehama County: | 8.4% |
| California: | 7.3% |
| This county: | 25.5% |
| State: | 21.3% |
| Tehama County: | 13.3% |
| California: | 17.9% |
Health and Nutrition:
| Red Bluff: | 48.9% |
| California: | 49.4% |
| This city: | 46.6% |
| California: | 48.0% |
| This city: | 28.7 |
| State: | 28.1 |
| Red Bluff: | 20.8% |
| California: | 20.2% |
| Red Bluff: | 10.7% |
| California: | 11.2% |
| This city: | 6.8 |
| State: | 6.8 |
| Red Bluff: | 34.1% |
| California: | 31.5% |
| Red Bluff: | 56.0% |
| State: | 56.4% |
| Red Bluff: | 78.7% |
| California: | 80.9% |
More about Health and Nutrition of Red Bluff, CA Residents
| Local government employment and payroll (March 2022) | |||||
| Function | Full-time employees | Monthly full-time payroll | Average yearly full-time wage | Part-time employees | Monthly part-time payroll |
|---|---|---|---|---|---|
| Police Protection - Officers | 29 | $193,070 | $79,891 | 5 | $6,342 |
| Firefighters | 15 | $110,121 | $88,097 | 7 | $12,010 |
| Streets and Highways | 12 | $66,511 | $66,511 | 0 | $0 |
| Police - Other | 11 | $57,259 | $62,464 | 2 | $1,767 |
| Sewerage | 7 | $28,622 | $49,066 | 0 | $0 |
| Parks and Recreation | 7 | $29,725 | $50,957 | 1 | $1,129 |
| Financial Administration | 6 | $32,231 | $64,462 | 0 | $0 |
| Other Government Administration | 5 | $44,434 | $106,642 | 7 | $1,340 |
| Water Supply | 4 | $18,906 | $56,718 | 0 | $0 |
| Other and Unallocable | 3 | $14,488 | $57,952 | 0 | $0 |
| Fire - Other | 1 | $3,873 | $46,476 | 0 | $0 |
| Totals for Government | 100 | $599,239 | $71,909 | 22 | $22,588 |
Red Bluff government finances - Expenditure in 2021 (per resident):
- Construction - General - Other: $2,502,000 ($173.56)
Police Protection: $1,385,000 ($96.07)
Regular Highways: $197,000 ($13.67)
Parks and Recreation: $8,000 ($0.55)
Housing and Community Development: $4,000 ($0.28)
- Current Operations - Police Protection: $5,965,000 ($413.78)
Local Fire Protection: $2,918,000 ($202.41)
Sewerage: $2,556,000 ($177.30)
Central Staff Services: $2,195,000 ($152.26)
Water Utilities: $1,444,000 ($100.17)
Parks and Recreation: $800,000 ($55.49)
Regular Highways: $766,000 ($53.14)
General - Other: $399,000 ($27.68)
Air Transportation: $63,000 ($4.37)
Housing and Community Development: $8,000 ($0.55)
- General - Interest on Debt: $37,000 ($2.57)
Red Bluff government finances - Revenue in 2021 (per resident):
- Charges - Sewerage: $2,912,000 ($202.00)
Other: $1,337,000 ($92.74)
Air Transportation: $165,000 ($11.45)
Housing and Community Development: $55,000 ($3.82)
Parks and Recreation: $33,000 ($2.29)
- Federal Intergovernmental - Other: $253,000 ($17.55)
Housing and Community Development: $237,000 ($16.44)
Air Transportation: $10,000 ($0.69)
- Local Intergovernmental - Other: $110,000 ($7.63)
- Miscellaneous - General Revenue - Other: $5,313,000 ($368.55)
Interest Earnings: $334,000 ($23.17)
Fines and Forfeits: $60,000 ($4.16)
Special Assessments: $31,000 ($2.15)
Rents: $1,000 ($0.07)
Donations From Private Sources: $1,000 ($0.07)
- Revenue - Water Utilities: $2,379,000 ($165.02)
- State Intergovernmental - Other: $1,236,000 ($85.74)
Highways: $581,000 ($40.30)
General Local Government Support: $24,000 ($1.66)
- Tax - General Sales and Gross Receipts: $6,592,000 ($457.27)
Property: $3,251,000 ($225.51)
Other Selective Sales: $1,174,000 ($81.44)
Public Utilities Sales: $434,000 ($30.11)
Occupation and Business License - Other: $420,000 ($29.13)
Other License: $59,000 ($4.09)
Documentary and Stock Transfer: $51,000 ($3.54)
Red Bluff government finances - Debt in 2021 (per resident):
- Long Term Debt - Outstanding Unspecified Public Purpose: $1,558,000 ($108.07)
Issue, Unspecified Public Purpose: $1,174,000 ($81.44)
Beginning Outstanding - Unspecified Public Purpose: $409,000 ($28.37)
Retired Unspecified Public Purpose: $25,000 ($1.73)
Red Bluff government finances - Cash and Securities in 2021 (per resident):
- Bond Funds - Cash and Securities: $6,621,000 ($459.28)
- Other Funds - Cash and Securities: $11,440,000 ($793.56)
| Businesses in Red Bluff, CA | ||||
| Name | Count | Name | Count | |
|---|---|---|---|---|
| AT&T | 1 | La-Z-Boy | 1 | |
| Applebee's | 1 | Lane Furniture | 1 | |
| Arby's | 1 | Little Caesars Pizza | 1 | |
| AutoZone | 1 | MasterBrand Cabinets | 2 | |
| Baskin-Robbins | 1 | McDonald's | 2 | |
| Best Western | 1 | Motel 6 | 1 | |
| Blockbuster | 1 | Payless | 1 | |
| Burger King | 1 | RadioShack | 1 | |
| CVS | 1 | Sears | 1 | |
| Circle K | 1 | Staples | 1 | |
| Comfort Inn | 1 | Starbucks | 2 | |
| Days Inn | 1 | Super 8 | 1 | |
| Dennys | 1 | T-Mobile | 1 | |
| Domino's Pizza | 1 | Taco Bell | 1 | |
| FedEx | 4 | Travelodge | 1 | |
| GNC | 1 | True Value | 1 | |
| GameStop | 1 | U-Haul | 4 | |
| H&R Block | 1 | UPS | 5 | |
| Hilton | 1 | Walgreens | 1 | |
| Home Depot | 1 | Walmart | 1 | |
| Jones New York | 2 | Wendy's | 1 | |
| KFC | 1 | |||
Strongest AM radio stations in Red Bluff:
- KBLF (1490 AM; 1 kW; RED BLUFF, CA; Owner: TOM HUTH)
- KNRO (1670 AM; 10 kW; REDDING, CA; Owner: REGENT LICENSEE OF REDDING, INC.)
- KVIP (540 AM; 2 kW; REDDING, CA; Owner: PACIFIC CASCADE COMMUNICATIONS CORP.)
- KKOH (780 AM; 50 kW; RENO, NV; Owner: CITADEL BROADCASTING COMPANY)
- KFBK (1530 AM; 50 kW; SACRAMENTO, CA; Owner: AMFM RADIO LICENSES, L.L.C.)
- KCBS (740 AM; 50 kW; SAN FRANCISCO, CA; Owner: INFINITY BROADCASTING OPERATIONS, INC.)
- KFIA (710 AM; 25 kW; CARMICHAEL, CA; Owner: VISTA BROADCASTING INC.)
- KPAY (1290 AM; 5 kW; CHICO, CA; Owner: CAPSTAR TX LIMITED PARTNERSHIP)
- KHTK (1140 AM; 50 kW; SACRAMENTO, CA; Owner: INFINITY RADIO SUBSIDIARY OPERATIONS INC.)
- KSTE (650 AM; 25 kW; RANCHO CORDOVA, CA; Owner: AMFM RADIO LICENSES, L.L.C.)
- KTRB (860 AM; 50 kW; MODESTO, CA; Owner: PAPPAS RADIO OF CALIFORNIA, A CALIFORNIA LIMITED PARTNERSHIP)
- KNBR (680 AM; 50 kW; SAN FRANCISCO, CA; Owner: KNBR LICO, INC.)
- KCBC (770 AM; 50 kW; RIVERBANK, CA; Owner: KIERTRON, INC.)
Strongest FM radio stations in Red Bluff:
- KRBH-LP (107.7 FM; RED BLUFF, CA; Owner: RED BLUFF JOINT UNION HIGH SCHOOL DISTRICT)
- KLVB-FM (102.7 FM; RED BLUFF, CA; Owner: EDUCATIONAL MEDIA FOUNDATION)
- KHRD (103.1 FM; WEAVERVILLE, CA; Owner: RESULTS RADIO LICENSEE, LLC)
- KNCQ (97.3 FM; REDDING, CA; Owner: RESULTS RADIO OF REDDING, LLC)
- KRDG (105.3 FM; SHINGLETOWN, CA; Owner: REGENT LICENSEE OF REDDING, INC.)
- K225AJ (92.9 FM; BURNEY/REDDING, CA; Owner: CALVARY CHAPEL OF TWIN FALLS, INC.)
- KTHU (100.7 FM; CORNING, CA; Owner: RESULTS RADIO LICENSEE, LLC)
- K207CM (89.3 FM; RED BLUFF, CA; Owner: CENTRO CRISTIANO DE FE, INC.)
- KNNN (99.3 FM; SHASTA LAKE CITY, CA; Owner: REGENT LICENSEE OF REDDING, INC.)
- KKXS (96.1 FM; SHINGLETOWN, CA; Owner: RESULTS RADIO LICENSEE, LLC)
- KVIP-FM (98.1 FM; REDDING, CA; Owner: PACIFIC CASCADE COMMUNICATIONS CORP.)
- KALF (95.7 FM; RED BLUFF, CA; Owner: REGENT LICENSEE OF CHICO, INC)
- KEWB (94.7 FM; ANDERSON, CA; Owner: RESULTS RADIO OF REDDING, LLC)
- KLVC (88.3 FM; MAGALIA, CA; Owner: EDUCATIONAL MEDIA FOUNDATION)
- K216CF (91.1 FM; CHICO, CA; Owner: YOUR CHRISTIAN COMPANION NETWORK, INC.)
- KSHA (104.3 FM; REDDING, CA; Owner: REGENT LICENSEE OF REDDING, INC)
- KZAP (96.7 FM; PARADISE, CA; Owner: REGENT LICENSEE OF CHICO, INC.)
- KHSL-FM (103.5 FM; PARADISE, CA; Owner: CAPSTAR TX LIMITED PARTNERSHIP)
- KCHO (91.7 FM; CHICO, CA; Owner: UNIV. FOUNDATION/CA. ST. UNIV. CHICO)
- KMXI (95.1 FM; CHICO, CA; Owner: CAPSTAR TX LIMITED PARTNERSHIP)
TV broadcast stations around Red Bluff:
- KNVN (Channel 24; CHICO, CA; Owner: CHICO LICENSE, L.L.C.)
- KMCA-LP (Channel 49; RED BLUFF, CA; Owner: MARK C. ALLEN)
- National Bridge Inventory (NBI) Statistics
- 70Number of bridges
- 1,388ft / 423mTotal length
- $8,480,000Total costs
- 851,927Total average daily traffic
- 134,424Total average daily truck traffic
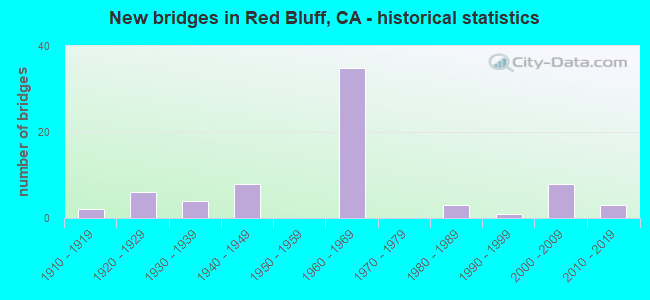
- New bridges - historical statistics
- 21910-1919
- 61920-1929
- 41930-1939
- 81940-1949
- 351960-1969
- 31980-1989
- 11990-1999
- 82000-2009
- 32010-2019
FCC Registered Antenna Towers: 103 (See the full list of FCC Registered Antenna Towers)
FCC Registered Commercial Land Mobile Towers: 8 (See the full list of FCC Registered Commercial Land Mobile Towers in Red Bluff, CA)
FCC Registered Private Land Mobile Towers: 2 (See the full list of FCC Registered Private Land Mobile Towers)
FCC Registered Broadcast Land Mobile Towers: 51 (See the full list of FCC Registered Broadcast Land Mobile Towers)
FCC Registered Microwave Towers: 56 (See the full list of FCC Registered Microwave Towers in this town)
FCC Registered Paging Towers: 8 (See the full list of FCC Registered Paging Towers)
FCC Registered Maritime Coast & Aviation Ground Towers: 1 (See the full list of FCC Registered Maritime Coast & Aviation Ground Towers)
FCC Registered Amateur Radio Licenses: 177 (See the full list of FCC Registered Amateur Radio Licenses in Red Bluff)
FAA Registered Aircraft Manufacturers and Dealers: 4 (See the full list of FAA Registered Manufacturers and Dealers in Red Bluff)
FAA Registered Aircraft: 98 (See the full list of FAA Registered Aircraft)
2006 - 2018 National Fire Incident Reporting System (NFIRS) incidents
- Fire incident types reported to NFIRS in Red Bluff, CA
- 85053.6%Outside Fires
- 45428.6%Structure Fires
- 21813.7%Mobile Property/Vehicle Fires
- 644.0%Other
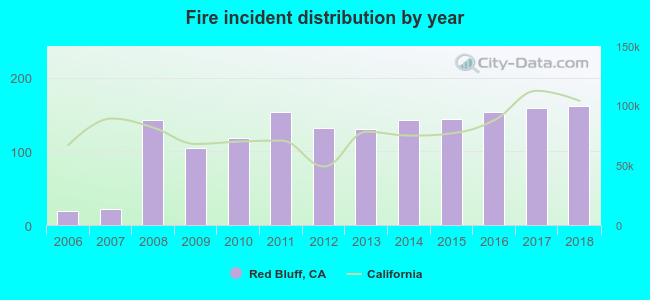 Based on the data from the years 2006 - 2018 the average number of fire incidents per year is 122. The highest number of fires - 162 took place in 2018, and the least - 19 in 2006. The data has a growing trend.
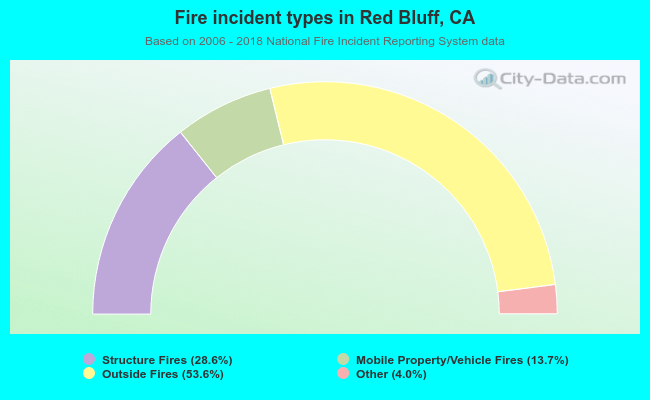 When looking into fire subcategories, the most reports belonged to: Outside Fires (53.6%), and Structure Fires (28.6%).
Fire-safe hotels and motels in Red Bluff, California:
- Best Western Antelope Inn, 203 Antelope Blvd, Red Bluff, California 96080 , Phone: (530) 527-8882, Fax: (530) 527-5078
- Comfort Inn, 90 Sale Ln, Red Bluff, California 96080 , Phone: (530) 529-7077, Fax: (530) 529-7077
- Motel 6, 20 Williams Ave, Red Bluff, California 96080 , Phone: (530) 527-9200, Fax: (530) 528-1219
- Americas Best Value Inn, 210 S Main St, Red Bluff, California 96080 , Phone: (530) 527-1150, Fax: (530) 527-5878
- Super 8, 30 Gilmore Rd, Red Bluff, California 96080 , Phone: (530) 529-2028, Fax: (530) 527-1702
- American Inn Express, 250 S Main St, Red Bluff, California 96080 , Phone: (530) 527-3545, Fax: (530) 527-3035
- Days Inn Red Bluff, 5 Sutter St, Red Bluff, California 96080 , Phone: (530) 527-6130, Fax: (530) 527-1251
- Hampton Inn & Suites, 520 Adobe Rd, Red Bluff, California 96080 , Phone: (530) 529-9916, Fax: (530) 529-9917
- 2 other hotels and motels
| Most common first names in Red Bluff, CA among deceased individuals | ||
| Name | Count | Lived (average) |
|---|---|---|
| William | 173 | 74.9 years |
| Mary | 172 | 79.0 years |
| John | 172 | 76.3 years |
| Robert | 151 | 73.5 years |
| James | 147 | 72.4 years |
| Charles | 108 | 75.8 years |
| Richard | 88 | 69.2 years |
| George | 84 | 78.8 years |
| Helen | 81 | 81.0 years |
| Dorothy | 70 | 78.3 years |
| Most common last names in Red Bluff, CA among deceased individuals | ||
| Last name | Count | Lived (average) |
|---|---|---|
| Smith | 99 | 75.9 years |
| Johnson | 68 | 76.7 years |
| Brown | 56 | 78.8 years |
| Jones | 48 | 78.6 years |
| Davis | 46 | 77.9 years |
| Wilson | 41 | 72.8 years |
| Williams | 41 | 79.4 years |
| Miller | 40 | 78.3 years |
| Anderson | 38 | 78.2 years |
| Martin | 33 | 78.3 years |
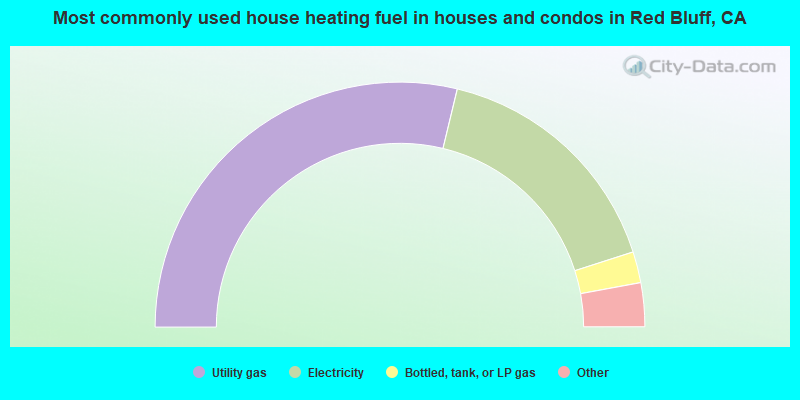
- 57.6%Utility gas
- 32.6%Electricity
- 4.1%Bottled, tank, or LP gas
- 2.6%Solar energy
- 2.2%Fuel oil, kerosene, etc.
- 0.6%Other fuel
- 0.3%Wood
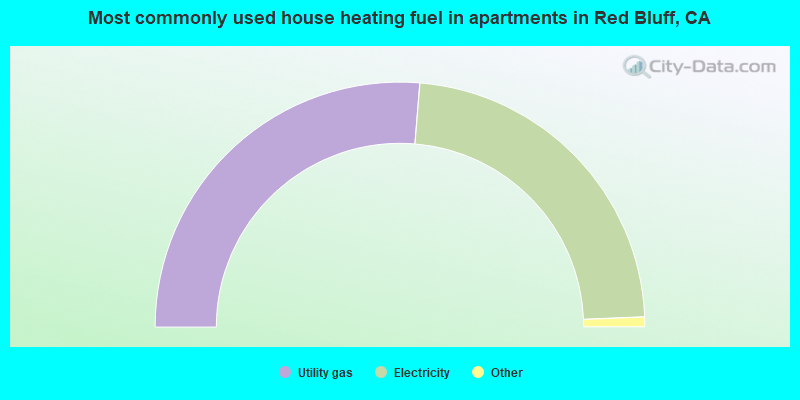
- 52.6%Utility gas
- 46.1%Electricity
- 1.1%Wood
- 0.2%Bottled, tank, or LP gas
Red Bluff compared to California state average:
- Median household income below state average.
- Median house value significantly below state average.
- Hispanic race population percentage below state average.
- Foreign-born population percentage significantly below state average.
- Length of stay since moving in significantly above state average.
- Percentage of population with a bachelor's degree or higher significantly below state average.
Red Bluff on our top lists:
- #94 on the list of "Top 101 cities with largest percentage of females in occupations: personal care and service occupations (population 5,000+)"
- #97 on the list of "Top 101 cities with the largest percentage of people in short-term care, detention or diagnostic centers for delinquent children (population 1,000+)"
- #29 on the list of "Top 101 counties with highest percentage of residents voting for 3rd party candidates in the 2012 Presidential Election (pop. 50,000+)"
- #60 on the list of "Top 101 counties with the largest decrease in the number of deaths per 1000 residents 2000-2006 to 2007-2013 (pop. 50,000+)"

|
|
Total of 11 patent applications in 2008-2024.