Peachtree City, Georgia Submit your own pictures of this city and show them to the world
OSM Map
General Map
Google Map
MSN Map
OSM Map
General Map
Google Map
MSN Map
OSM Map
General Map
Google Map
MSN Map
OSM Map
General Map
Google Map
MSN Map
Please wait while loading the map...
Population in 2022: 39,562 (97% urban, 3% rural). Population change since 2000: +25.3%Males: 18,967 Females: 20,595
March 2022 cost of living index in Peachtree City: 103.1 (near average, U.S. average is 100) Percentage of residents living in poverty in 2022: 5.8%for White Non-Hispanic residents , 17.1% for Black residents , 6.0% for Hispanic or Latino residents , 39.2% for American Indian residents , 7.3% for two or more races residents )
Profiles of local businesses
Business Search - 14 Million verified businesses
Data:
Median household income ($)
Median household income (% change since 2000)
Household income diversity
Ratio of average income to average house value (%)
Ratio of average income to average rent
Median household income ($) - White
Median household income ($) - Black or African American
Median household income ($) - Asian
Median household income ($) - Hispanic or Latino
Median household income ($) - American Indian and Alaska Native
Median household income ($) - Multirace
Median household income ($) - Other Race
Median household income for houses/condos with a mortgage ($)
Median household income for apartments without a mortgage ($)
Races - White alone (%)
Races - White alone (% change since 2000)
Races - Black alone (%)
Races - Black alone (% change since 2000)
Races - American Indian alone (%)
Races - American Indian alone (% change since 2000)
Races - Asian alone (%)
Races - Asian alone (% change since 2000)
Races - Hispanic (%)
Races - Hispanic (% change since 2000)
Races - Native Hawaiian and Other Pacific Islander alone (%)
Races - Native Hawaiian and Other Pacific Islander alone (% change since 2000)
Races - Two or more races (%)
Races - Two or more races (% change since 2000)
Races - Other race alone (%)
Races - Other race alone (% change since 2000)
Racial diversity
Unemployment (%)
Unemployment (% change since 2000)
Unemployment (%) - White
Unemployment (%) - Black or African American
Unemployment (%) - Asian
Unemployment (%) - Hispanic or Latino
Unemployment (%) - American Indian and Alaska Native
Unemployment (%) - Multirace
Unemployment (%) - Other Race
Population density (people per square mile)
Population - Males (%)
Population - Females (%)
Population - Males (%) - White
Population - Males (%) - Black or African American
Population - Males (%) - Asian
Population - Males (%) - Hispanic or Latino
Population - Males (%) - American Indian and Alaska Native
Population - Males (%) - Multirace
Population - Males (%) - Other Race
Population - Females (%) - White
Population - Females (%) - Black or African American
Population - Females (%) - Asian
Population - Females (%) - Hispanic or Latino
Population - Females (%) - American Indian and Alaska Native
Population - Females (%) - Multirace
Population - Females (%) - Other Race
Coronavirus confirmed cases (Jul 02, 2024)
Deaths caused by coronavirus (Jul 02, 2024)
Coronavirus confirmed cases (per 100k population) (Jul 02, 2024)
Deaths caused by coronavirus (per 100k population) (Jul 02, 2024)
Daily increase in number of cases (Jul 02, 2024)
Weekly increase in number of cases (Jul 02, 2024)
Cases doubled (in days) (Jul 02, 2024)
Hospitalized patients (Apr 18, 2022)
Negative test results (Apr 18, 2022)
Total test results (Apr 18, 2022)
COVID Vaccine doses distributed (per 100k population) (Sep 19, 2023)
COVID Vaccine doses administered (per 100k population) (Sep 19, 2023)
COVID Vaccine doses distributed (Sep 19, 2023)
COVID Vaccine doses administered (Sep 19, 2023)
Likely homosexual households (%)
Likely homosexual households (% change since 2000)
Likely homosexual households - Lesbian couples (%)
Likely homosexual households - Lesbian couples (% change since 2000)
Likely homosexual households - Gay men (%)
Likely homosexual households - Gay men (% change since 2000)
Cost of living index
Median gross rent ($)
Median contract rent ($)
Median monthly housing costs ($)
Median house or condo value ($)
Median house or condo value ($ change since 2000)
Mean house or condo value by units in structure - 1, detached ($)
Mean house or condo value by units in structure - 1, attached ($)
Mean house or condo value by units in structure - 2 ($)
Mean house or condo value by units in structure by units in structure - 3 or 4 ($)
Mean house or condo value by units in structure - 5 or more ($)
Mean house or condo value by units in structure - Boat, RV, van, etc. ($)
Mean house or condo value by units in structure - Mobile home ($)
Median house or condo value ($) - White
Median house or condo value ($) - Black or African American
Median house or condo value ($) - Asian
Median house or condo value ($) - Hispanic or Latino
Median house or condo value ($) - American Indian and Alaska Native
Median house or condo value ($) - Multirace
Median house or condo value ($) - Other Race
Median resident age
Resident age diversity
Median resident age - Males
Median resident age - Females
Median resident age - White
Median resident age - Black or African American
Median resident age - Asian
Median resident age - Hispanic or Latino
Median resident age - American Indian and Alaska Native
Median resident age - Multirace
Median resident age - Other Race
Median resident age - Males - White
Median resident age - Males - Black or African American
Median resident age - Males - Asian
Median resident age - Males - Hispanic or Latino
Median resident age - Males - American Indian and Alaska Native
Median resident age - Males - Multirace
Median resident age - Males - Other Race
Median resident age - Females - White
Median resident age - Females - Black or African American
Median resident age - Females - Asian
Median resident age - Females - Hispanic or Latino
Median resident age - Females - American Indian and Alaska Native
Median resident age - Females - Multirace
Median resident age - Females - Other Race
Commute - mean travel time to work (minutes)
Travel time to work - Less than 5 minutes (%)
Travel time to work - Less than 5 minutes (% change since 2000)
Travel time to work - 5 to 9 minutes (%)
Travel time to work - 5 to 9 minutes (% change since 2000)
Travel time to work - 10 to 19 minutes (%)
Travel time to work - 10 to 19 minutes (% change since 2000)
Travel time to work - 20 to 29 minutes (%)
Travel time to work - 20 to 29 minutes (% change since 2000)
Travel time to work - 30 to 39 minutes (%)
Travel time to work - 30 to 39 minutes (% change since 2000)
Travel time to work - 40 to 59 minutes (%)
Travel time to work - 40 to 59 minutes (% change since 2000)
Travel time to work - 60 to 89 minutes (%)
Travel time to work - 60 to 89 minutes (% change since 2000)
Travel time to work - 90 or more minutes (%)
Travel time to work - 90 or more minutes (% change since 2000)
Marital status - Never married (%)
Marital status - Now married (%)
Marital status - Separated (%)
Marital status - Widowed (%)
Marital status - Divorced (%)
Median family income ($)
Median family income (% change since 2000)
Median non-family income ($)
Median non-family income (% change since 2000)
Median per capita income ($)
Median per capita income (% change since 2000)
Median family income ($) - White
Median family income ($) - Black or African American
Median family income ($) - Asian
Median family income ($) - Hispanic or Latino
Median family income ($) - American Indian and Alaska Native
Median family income ($) - Multirace
Median family income ($) - Other Race
Median year house/condo built
Median year apartment built
Year house built - Built 2005 or later (%)
Year house built - Built 2000 to 2004 (%)
Year house built - Built 1990 to 1999 (%)
Year house built - Built 1980 to 1989 (%)
Year house built - Built 1970 to 1979 (%)
Year house built - Built 1960 to 1969 (%)
Year house built - Built 1950 to 1959 (%)
Year house built - Built 1940 to 1949 (%)
Year house built - Built 1939 or earlier (%)
Average household size
Household density (households per square mile)
Average household size - White
Average household size - Black or African American
Average household size - Asian
Average household size - Hispanic or Latino
Average household size - American Indian and Alaska Native
Average household size - Multirace
Average household size - Other Race
Occupied housing units (%)
Vacant housing units (%)
Owner occupied housing units (%)
Renter occupied housing units (%)
Vacancy status - For rent (%)
Vacancy status - For sale only (%)
Vacancy status - Rented or sold, not occupied (%)
Vacancy status - For seasonal, recreational, or occasional use (%)
Vacancy status - For migrant workers (%)
Vacancy status - Other vacant (%)
Residents with income below the poverty level (%)
Residents with income below 50% of the poverty level (%)
Children below poverty level (%)
Poor families by family type - Married-couple family (%)
Poor families by family type - Male, no wife present (%)
Poor families by family type - Female, no husband present (%)
Poverty status for native-born residents (%)
Poverty status for foreign-born residents (%)
Poverty among high school graduates not in families (%)
Poverty among people who did not graduate high school not in families (%)
Residents with income below the poverty level (%) - White
Residents with income below the poverty level (%) - Black or African American
Residents with income below the poverty level (%) - Asian
Residents with income below the poverty level (%) - Hispanic or Latino
Residents with income below the poverty level (%) - American Indian and Alaska Native
Residents with income below the poverty level (%) - Multirace
Residents with income below the poverty level (%) - Other Race
Air pollution - Air Quality Index (AQI)
Air pollution - CO
Air pollution - NO2
Air pollution - SO2
Air pollution - Ozone
Air pollution - PM10
Air pollution - PM25
Air pollution - Pb
Crime - Murders per 100,000 population
Crime - Rapes per 100,000 population
Crime - Robberies per 100,000 population
Crime - Assaults per 100,000 population
Crime - Burglaries per 100,000 population
Crime - Thefts per 100,000 population
Crime - Auto thefts per 100,000 population
Crime - Arson per 100,000 population
Crime - City-data.com crime index
Crime - Violent crime index
Crime - Property crime index
Crime - Murders per 100,000 population (5 year average)
Crime - Rapes per 100,000 population (5 year average)
Crime - Robberies per 100,000 population (5 year average)
Crime - Assaults per 100,000 population (5 year average)
Crime - Burglaries per 100,000 population (5 year average)
Crime - Thefts per 100,000 population (5 year average)
Crime - Auto thefts per 100,000 population (5 year average)
Crime - Arson per 100,000 population (5 year average)
Crime - City-data.com crime index (5 year average)
Crime - Violent crime index (5 year average)
Crime - Property crime index (5 year average)
1996 Presidential Elections Results (%) - Democratic Party (Clinton)
1996 Presidential Elections Results (%) - Republican Party (Dole)
1996 Presidential Elections Results (%) - Other
2000 Presidential Elections Results (%) - Democratic Party (Gore)
2000 Presidential Elections Results (%) - Republican Party (Bush)
2000 Presidential Elections Results (%) - Other
2004 Presidential Elections Results (%) - Democratic Party (Kerry)
2004 Presidential Elections Results (%) - Republican Party (Bush)
2004 Presidential Elections Results (%) - Other
2008 Presidential Elections Results (%) - Democratic Party (Obama)
2008 Presidential Elections Results (%) - Republican Party (McCain)
2008 Presidential Elections Results (%) - Other
2012 Presidential Elections Results (%) - Democratic Party (Obama)
2012 Presidential Elections Results (%) - Republican Party (Romney)
2012 Presidential Elections Results (%) - Other
2016 Presidential Elections Results (%) - Democratic Party (Clinton)
2016 Presidential Elections Results (%) - Republican Party (Trump)
2016 Presidential Elections Results (%) - Other
2020 Presidential Elections Results (%) - Democratic Party (Biden)
2020 Presidential Elections Results (%) - Republican Party (Trump)
2020 Presidential Elections Results (%) - Other
Ancestries Reported - Arab (%)
Ancestries Reported - Czech (%)
Ancestries Reported - Danish (%)
Ancestries Reported - Dutch (%)
Ancestries Reported - English (%)
Ancestries Reported - French (%)
Ancestries Reported - French Canadian (%)
Ancestries Reported - German (%)
Ancestries Reported - Greek (%)
Ancestries Reported - Hungarian (%)
Ancestries Reported - Irish (%)
Ancestries Reported - Italian (%)
Ancestries Reported - Lithuanian (%)
Ancestries Reported - Norwegian (%)
Ancestries Reported - Polish (%)
Ancestries Reported - Portuguese (%)
Ancestries Reported - Russian (%)
Ancestries Reported - Scotch-Irish (%)
Ancestries Reported - Scottish (%)
Ancestries Reported - Slovak (%)
Ancestries Reported - Subsaharan African (%)
Ancestries Reported - Swedish (%)
Ancestries Reported - Swiss (%)
Ancestries Reported - Ukrainian (%)
Ancestries Reported - United States (%)
Ancestries Reported - Welsh (%)
Ancestries Reported - West Indian (%)
Ancestries Reported - Other (%)
Educational Attainment - No schooling completed (%)
Educational Attainment - Less than high school (%)
Educational Attainment - High school or equivalent (%)
Educational Attainment - Less than 1 year of college (%)
Educational Attainment - 1 or more years of college (%)
Educational Attainment - Associate degree (%)
Educational Attainment - Bachelor's degree (%)
Educational Attainment - Master's degree (%)
Educational Attainment - Professional school degree (%)
Educational Attainment - Doctorate degree (%)
School Enrollment - Nursery, preschool (%)
School Enrollment - Kindergarten (%)
School Enrollment - Grade 1 to 4 (%)
School Enrollment - Grade 5 to 8 (%)
School Enrollment - Grade 9 to 12 (%)
School Enrollment - College undergrad (%)
School Enrollment - Graduate or professional (%)
School Enrollment - Not enrolled in school (%)
School enrollment - Public schools (%)
School enrollment - Private schools (%)
School enrollment - Not enrolled (%)
Median number of rooms in houses and condos
Median number of rooms in apartments
Housing units lacking complete plumbing facilities (%)
Housing units lacking complete kitchen facilities (%)
Density of houses
Urban houses (%)
Rural houses (%)
Households with people 60 years and over (%)
Households with people 65 years and over (%)
Households with people 75 years and over (%)
Households with one or more nonrelatives (%)
Households with no nonrelatives (%)
Population in households (%)
Family households (%)
Nonfamily households (%)
Population in families (%)
Family households with own children (%)
Median number of bedrooms in owner occupied houses
Mean number of bedrooms in owner occupied houses
Median number of bedrooms in renter occupied houses
Mean number of bedrooms in renter occupied houses
Median number of vehichles in owner occupied houses
Mean number of vehichles in owner occupied houses
Median number of vehichles in renter occupied houses
Mean number of vehichles in renter occupied houses
Mortgage status - with mortgage (%)
Mortgage status - with second mortgage (%)
Mortgage status - with home equity loan (%)
Mortgage status - with both second mortgage and home equity loan (%)
Mortgage status - without a mortgage (%)
Average family size
Average family size - White
Average family size - Black or African American
Average family size - Asian
Average family size - Hispanic or Latino
Average family size - American Indian and Alaska Native
Average family size - Multirace
Average family size - Other Race
Geographical mobility - Same house 1 year ago (%)
Geographical mobility - Moved within same county (%)
Geographical mobility - Moved from different county within same state (%)
Geographical mobility - Moved from different state (%)
Geographical mobility - Moved from abroad (%)
Place of birth - Born in state of residence (%)
Place of birth - Born in other state (%)
Place of birth - Native, outside of US (%)
Place of birth - Foreign born (%)
Housing units in structures - 1, detached (%)
Housing units in structures - 1, attached (%)
Housing units in structures - 2 (%)
Housing units in structures - 3 or 4 (%)
Housing units in structures - 5 to 9 (%)
Housing units in structures - 10 to 19 (%)
Housing units in structures - 20 to 49 (%)
Housing units in structures - 50 or more (%)
Housing units in structures - Mobile home (%)
Housing units in structures - Boat, RV, van, etc. (%)
House/condo owner moved in on average (years ago)
Renter moved in on average (years ago)
Year householder moved into unit - Moved in 1999 to March 2000 (%)
Year householder moved into unit - Moved in 1995 to 1998 (%)
Year householder moved into unit - Moved in 1990 to 1994 (%)
Year householder moved into unit - Moved in 1980 to 1989 (%)
Year householder moved into unit - Moved in 1970 to 1979 (%)
Year householder moved into unit - Moved in 1969 or earlier (%)
Means of transportation to work - Drove car alone (%)
Means of transportation to work - Carpooled (%)
Means of transportation to work - Public transportation (%)
Means of transportation to work - Bus or trolley bus (%)
Means of transportation to work - Streetcar or trolley car (%)
Means of transportation to work - Subway or elevated (%)
Means of transportation to work - Railroad (%)
Means of transportation to work - Ferryboat (%)
Means of transportation to work - Taxicab (%)
Means of transportation to work - Motorcycle (%)
Means of transportation to work - Bicycle (%)
Means of transportation to work - Walked (%)
Means of transportation to work - Other means (%)
Working at home (%)
Industry diversity
Most Common Industries - Agriculture, forestry, fishing and hunting, and mining (%)
Most Common Industries - Agriculture, forestry, fishing and hunting (%)
Most Common Industries - Mining, quarrying, and oil and gas extraction (%)
Most Common Industries - Construction (%)
Most Common Industries - Manufacturing (%)
Most Common Industries - Wholesale trade (%)
Most Common Industries - Retail trade (%)
Most Common Industries - Transportation and warehousing, and utilities (%)
Most Common Industries - Transportation and warehousing (%)
Most Common Industries - Utilities (%)
Most Common Industries - Information (%)
Most Common Industries - Finance and insurance, and real estate and rental and leasing (%)
Most Common Industries - Finance and insurance (%)
Most Common Industries - Real estate and rental and leasing (%)
Most Common Industries - Professional, scientific, and management, and administrative and waste management services (%)
Most Common Industries - Professional, scientific, and technical services (%)
Most Common Industries - Management of companies and enterprises (%)
Most Common Industries - Administrative and support and waste management services (%)
Most Common Industries - Educational services, and health care and social assistance (%)
Most Common Industries - Educational services (%)
Most Common Industries - Health care and social assistance (%)
Most Common Industries - Arts, entertainment, and recreation, and accommodation and food services (%)
Most Common Industries - Arts, entertainment, and recreation (%)
Most Common Industries - Accommodation and food services (%)
Most Common Industries - Other services, except public administration (%)
Most Common Industries - Public administration (%)
Occupation diversity
Most Common Occupations - Management, business, science, and arts occupations (%)
Most Common Occupations - Management, business, and financial occupations (%)
Most Common Occupations - Management occupations (%)
Most Common Occupations - Business and financial operations occupations (%)
Most Common Occupations - Computer, engineering, and science occupations (%)
Most Common Occupations - Computer and mathematical occupations (%)
Most Common Occupations - Architecture and engineering occupations (%)
Most Common Occupations - Life, physical, and social science occupations (%)
Most Common Occupations - Education, legal, community service, arts, and media occupations (%)
Most Common Occupations - Community and social service occupations (%)
Most Common Occupations - Legal occupations (%)
Most Common Occupations - Education, training, and library occupations (%)
Most Common Occupations - Arts, design, entertainment, sports, and media occupations (%)
Most Common Occupations - Healthcare practitioners and technical occupations (%)
Most Common Occupations - Health diagnosing and treating practitioners and other technical occupations (%)
Most Common Occupations - Health technologists and technicians (%)
Most Common Occupations - Service occupations (%)
Most Common Occupations - Healthcare support occupations (%)
Most Common Occupations - Protective service occupations (%)
Most Common Occupations - Fire fighting and prevention, and other protective service workers including supervisors (%)
Most Common Occupations - Law enforcement workers including supervisors (%)
Most Common Occupations - Food preparation and serving related occupations (%)
Most Common Occupations - Building and grounds cleaning and maintenance occupations (%)
Most Common Occupations - Personal care and service occupations (%)
Most Common Occupations - Sales and office occupations (%)
Most Common Occupations - Sales and related occupations (%)
Most Common Occupations - Office and administrative support occupations (%)
Most Common Occupations - Natural resources, construction, and maintenance occupations (%)
Most Common Occupations - Farming, fishing, and forestry occupations (%)
Most Common Occupations - Construction and extraction occupations (%)
Most Common Occupations - Installation, maintenance, and repair occupations (%)
Most Common Occupations - Production, transportation, and material moving occupations (%)
Most Common Occupations - Production occupations (%)
Most Common Occupations - Transportation occupations (%)
Most Common Occupations - Material moving occupations (%)
People in Group quarters - Institutionalized population (%)
People in Group quarters - Correctional institutions (%)
People in Group quarters - Federal prisons and detention centers (%)
People in Group quarters - Halfway houses (%)
People in Group quarters - Local jails and other confinement facilities (including police lockups) (%)
People in Group quarters - Military disciplinary barracks (%)
People in Group quarters - State prisons (%)
People in Group quarters - Other types of correctional institutions (%)
People in Group quarters - Nursing homes (%)
People in Group quarters - Hospitals/wards, hospices, and schools for the handicapped (%)
People in Group quarters - Hospitals/wards and hospices for chronically ill (%)
People in Group quarters - Hospices or homes for chronically ill (%)
People in Group quarters - Military hospitals or wards for chronically ill (%)
People in Group quarters - Other hospitals or wards for chronically ill (%)
People in Group quarters - Hospitals or wards for drug/alcohol abuse (%)
People in Group quarters - Mental (Psychiatric) hospitals or wards (%)
People in Group quarters - Schools, hospitals, or wards for the mentally retarded (%)
People in Group quarters - Schools, hospitals, or wards for the physically handicapped (%)
People in Group quarters - Institutions for the deaf (%)
People in Group quarters - Institutions for the blind (%)
People in Group quarters - Orthopedic wards and institutions for the physically handicapped (%)
People in Group quarters - Wards in general hospitals for patients who have no usual home elsewhere (%)
People in Group quarters - Wards in military hospitals for patients who have no usual home elsewhere (%)
People in Group quarters - Juvenile institutions (%)
People in Group quarters - Long-term care (%)
People in Group quarters - Homes for abused, dependent, and neglected children (%)
People in Group quarters - Residential treatment centers for emotionally disturbed children (%)
People in Group quarters - Training schools for juvenile delinquents (%)
People in Group quarters - Short-term care, detention or diagnostic centers for delinquent children (%)
People in Group quarters - Type of juvenile institution unknown (%)
People in Group quarters - Noninstitutionalized population (%)
People in Group quarters - College dormitories (includes college quarters off campus) (%)
People in Group quarters - Military quarters (%)
People in Group quarters - On base (%)
People in Group quarters - Barracks, unaccompanied personnel housing (UPH), (Enlisted/Officer), ;and similar group living quarters for military personnel (%)
People in Group quarters - Transient quarters for temporary residents (%)
People in Group quarters - Military ships (%)
People in Group quarters - Group homes (%)
People in Group quarters - Homes or halfway houses for drug/alcohol abuse (%)
People in Group quarters - Homes for the mentally ill (%)
People in Group quarters - Homes for the mentally retarded (%)
People in Group quarters - Homes for the physically handicapped (%)
People in Group quarters - Other group homes (%)
People in Group quarters - Religious group quarters (%)
People in Group quarters - Dormitories (%)
People in Group quarters - Agriculture workers' dormitories on farms (%)
People in Group quarters - Job Corps and vocational training facilities (%)
People in Group quarters - Other workers' dormitories (%)
People in Group quarters - Crews of maritime vessels (%)
People in Group quarters - Other nonhousehold living situations (%)
People in Group quarters - Other noninstitutional group quarters (%)
Residents speaking English at home (%)
Residents speaking English at home - Born in the United States (%)
Residents speaking English at home - Native, born elsewhere (%)
Residents speaking English at home - Foreign born (%)
Residents speaking Spanish at home (%)
Residents speaking Spanish at home - Born in the United States (%)
Residents speaking Spanish at home - Native, born elsewhere (%)
Residents speaking Spanish at home - Foreign born (%)
Residents speaking other language at home (%)
Residents speaking other language at home - Born in the United States (%)
Residents speaking other language at home - Native, born elsewhere (%)
Residents speaking other language at home - Foreign born (%)
Class of Workers - Employee of private company (%)
Class of Workers - Self-employed in own incorporated business (%)
Class of Workers - Private not-for-profit wage and salary workers (%)
Class of Workers - Local government workers (%)
Class of Workers - State government workers (%)
Class of Workers - Federal government workers (%)
Class of Workers - Self-employed workers in own not incorporated business and Unpaid family workers (%)
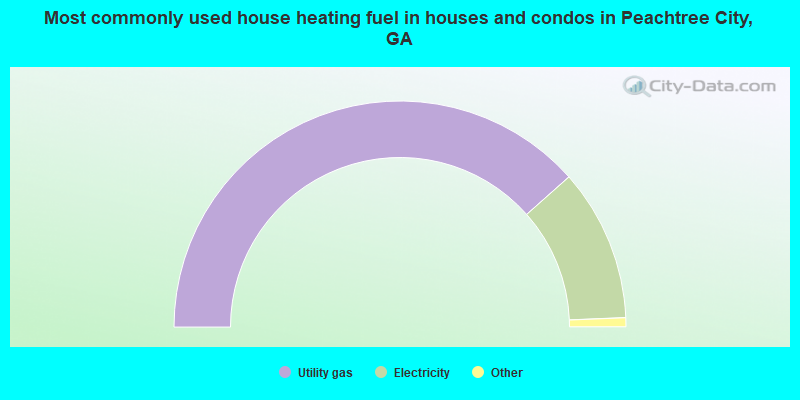
House heating fuel used in houses and condos - Utility gas (%)
House heating fuel used in houses and condos - Bottled, tank, or LP gas (%)
House heating fuel used in houses and condos - Electricity (%)
House heating fuel used in houses and condos - Fuel oil, kerosene, etc. (%)
House heating fuel used in houses and condos - Coal or coke (%)
House heating fuel used in houses and condos - Wood (%)
House heating fuel used in houses and condos - Solar energy (%)
House heating fuel used in houses and condos - Other fuel (%)
House heating fuel used in houses and condos - No fuel used (%)
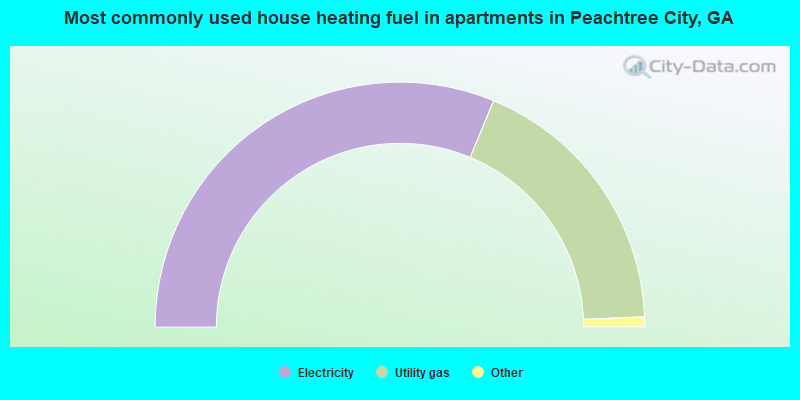
House heating fuel used in apartments - Utility gas (%)
House heating fuel used in apartments - Bottled, tank, or LP gas (%)
House heating fuel used in apartments - Electricity (%)
House heating fuel used in apartments - Fuel oil, kerosene, etc. (%)
House heating fuel used in apartments - Coal or coke (%)
House heating fuel used in apartments - Wood (%)
House heating fuel used in apartments - Solar energy (%)
House heating fuel used in apartments - Other fuel (%)
House heating fuel used in apartments - No fuel used (%)
Armed forces status - In Armed Forces (%)
Armed forces status - Civilian (%)
Armed forces status - Civilian - Veteran (%)
Armed forces status - Civilian - Nonveteran (%)
Fatal accidents locations in years 2005-2021
Fatal accidents locations in 2005
Fatal accidents locations in 2006
Fatal accidents locations in 2007
Fatal accidents locations in 2008
Fatal accidents locations in 2009
Fatal accidents locations in 2010
Fatal accidents locations in 2011
Fatal accidents locations in 2012
Fatal accidents locations in 2013
Fatal accidents locations in 2014
Fatal accidents locations in 2015
Fatal accidents locations in 2016
Fatal accidents locations in 2017
Fatal accidents locations in 2018
Fatal accidents locations in 2019
Fatal accidents locations in 2020
Fatal accidents locations in 2021
Alcohol use - People drinking some alcohol every month (%)
Alcohol use - People not drinking at all (%)
Alcohol use - Average days/month drinking alcohol
Alcohol use - Average drinks/week
Alcohol use - Average days/year people drink much
Audiometry - Average condition of hearing (%)
Audiometry - People that can hear a whisper from across a quiet room (%)
Audiometry - People that can hear normal voice from across a quiet room (%)
Audiometry - Ears ringing, roaring, buzzing (%)
Audiometry - Had a job exposure to loud noise (%)
Audiometry - Had off-work exposure to loud noise (%)
Blood Pressure & Cholesterol - Has high blood pressure (%)
Blood Pressure & Cholesterol - Checking blood pressure at home (%)
Blood Pressure & Cholesterol - Frequently checking blood cholesterol (%)
Blood Pressure & Cholesterol - Has high cholesterol level (%)
Consumer Behavior - Money monthly spent on food at supermarket/grocery store
Consumer Behavior - Money monthly spent on food at other stores
Consumer Behavior - Money monthly spent on eating out
Consumer Behavior - Money monthly spent on carryout/delivered foods
Consumer Behavior - Income spent on food at supermarket/grocery store (%)
Consumer Behavior - Income spent on food at other stores (%)
Consumer Behavior - Income spent on eating out (%)
Consumer Behavior - Income spent on carryout/delivered foods (%)
Current Health Status - General health condition (%)
Current Health Status - Blood donors (%)
Current Health Status - Has blood ever tested for HIV virus (%)
Current Health Status - Left-handed people (%)
Dermatology - People using sunscreen (%)
Diabetes - Diabetics (%)
Diabetes - Had a blood test for high blood sugar (%)
Diabetes - People taking insulin (%)
Diet Behavior & Nutrition - Diet health (%)
Diet Behavior & Nutrition - Milk product consumption (# of products/month)
Diet Behavior & Nutrition - Meals not home prepared (#/week)
Diet Behavior & Nutrition - Meals from fast food or pizza place (#/week)
Diet Behavior & Nutrition - Ready-to-eat foods (#/month)
Diet Behavior & Nutrition - Frozen meals/pizza (#/month)
Drug Use - People that ever used marijuana or hashish (%)
Drug Use - Ever used hard drugs (%)
Drug Use - Ever used any form of cocaine (%)
Drug Use - Ever used heroin (%)
Drug Use - Ever used methamphetamine (%)
Health Insurance - People covered by health insurance (%)
Kidney Conditions-Urology - Avg. # of times urinating at night
Medical Conditions - People with asthma (%)
Medical Conditions - People with anemia (%)
Medical Conditions - People with psoriasis (%)
Medical Conditions - People with overweight (%)
Medical Conditions - Elderly people having difficulties in thinking or remembering (%)
Medical Conditions - People who ever received blood transfusion (%)
Medical Conditions - People having trouble seeing even with glass/contacts (%)
Medical Conditions - People with arthritis (%)
Medical Conditions - People with gout (%)
Medical Conditions - People with congestive heart failure (%)
Medical Conditions - People with coronary heart disease (%)
Medical Conditions - People with angina pectoris (%)
Medical Conditions - People who ever had heart attack (%)
Medical Conditions - People who ever had stroke (%)
Medical Conditions - People with emphysema (%)
Medical Conditions - People with thyroid problem (%)
Medical Conditions - People with chronic bronchitis (%)
Medical Conditions - People with any liver condition (%)
Medical Conditions - People who ever had cancer or malignancy (%)
Mental Health - People who have little interest in doing things (%)
Mental Health - People feeling down, depressed, or hopeless (%)
Mental Health - People who have trouble sleeping or sleeping too much (%)
Mental Health - People feeling tired or having little energy (%)
Mental Health - People with poor appetite or overeating (%)
Mental Health - People feeling bad about themself (%)
Mental Health - People who have trouble concentrating on things (%)
Mental Health - People moving or speaking slowly or too fast (%)
Mental Health - People having thoughts they would be better off dead (%)
Oral Health - Average years since last visit a dentist
Oral Health - People embarrassed because of mouth (%)
Oral Health - People with gum disease (%)
Oral Health - General health of teeth and gums (%)
Oral Health - Average days a week using dental floss/device
Oral Health - Average days a week using mouthwash for dental problem
Oral Health - Average number of teeth
Pesticide Use - Households using pesticides to control insects (%)
Pesticide Use - Households using pesticides to kill weeds (%)
Physical Activity - People doing vigorous-intensity work activities (%)
Physical Activity - People doing moderate-intensity work activities (%)
Physical Activity - People walking or bicycling (%)
Physical Activity - People doing vigorous-intensity recreational activities (%)
Physical Activity - People doing moderate-intensity recreational activities (%)
Physical Activity - Average hours a day doing sedentary activities
Physical Activity - Average hours a day watching TV or videos
Physical Activity - Average hours a day using computer
Physical Functioning - People having limitations keeping them from working (%)
Physical Functioning - People limited in amount of work they can do (%)
Physical Functioning - People that need special equipment to walk (%)
Physical Functioning - People experiencing confusion/memory problems (%)
Physical Functioning - People requiring special healthcare equipment (%)
Prescription Medications - Average number of prescription medicines taking
Preventive Aspirin Use - Adults 40+ taking low-dose aspirin (%)
Reproductive Health - Vaginal deliveries (%)
Reproductive Health - Cesarean deliveries (%)
Reproductive Health - Deliveries resulted in a live birth (%)
Reproductive Health - Pregnancies resulted in a delivery (%)
Reproductive Health - Women breastfeeding newborns (%)
Reproductive Health - Women that had a hysterectomy (%)
Reproductive Health - Women that had both ovaries removed (%)
Reproductive Health - Women that have ever taken birth control pills (%)
Reproductive Health - Women taking birth control pills (%)
Reproductive Health - Women that have ever used Depo-Provera or injectables (%)
Reproductive Health - Women that have ever used female hormones (%)
Sexual Behavior - People 18+ that ever had sex (vaginal, anal, or oral) (%)
Sexual Behavior - Males 18+ that ever had vaginal sex with a woman (%)
Sexual Behavior - Males 18+ that ever performed oral sex on a woman (%)
Sexual Behavior - Males 18+ that ever had anal sex with a woman (%)
Sexual Behavior - Males 18+ that ever had any sex with a man (%)
Sexual Behavior - Females 18+ that ever had vaginal sex with a man (%)
Sexual Behavior - Females 18+ that ever performed oral sex on a man (%)
Sexual Behavior - Females 18+ that ever had anal sex with a man (%)
Sexual Behavior - Females 18+ that ever had any kind of sex with a woman (%)
Sexual Behavior - Average age people first had sex
Sexual Behavior - Average number of female sex partners in lifetime (males 18+)
Sexual Behavior - Average number of female vaginal sex partners in lifetime (males 18+)
Sexual Behavior - Average age people first performed oral sex on a woman (18+)
Sexual Behavior - Average number of woman performed oral sex on in lifetime (18+)
Sexual Behavior - Average number of male sex partners in lifetime (males 18+)
Sexual Behavior - Average number of male anal sex partners in lifetime (males 18+)
Sexual Behavior - Average age people first performed oral sex on a man (18+)
Sexual Behavior - Average number of male oral sex partners in lifetime (18+)
Sexual Behavior - People using protection when performing oral sex (%)
Sexual Behavior - Average number of times people have vaginal or anal sex a year
Sexual Behavior - People having sex without condom (%)
Sexual Behavior - Average number of male sex partners in lifetime (females 18+)
Sexual Behavior - Average number of male vaginal sex partners in lifetime (females 18+)
Sexual Behavior - Average number of female sex partners in lifetime (females 18+)
Sexual Behavior - Circumcised males 18+ (%)
Sleep Disorders - Average hours sleeping at night
Sleep Disorders - People that has trouble sleeping (%)
Smoking-Cigarette Use - People smoking cigarettes (%)
Taste & Smell - People 40+ having problems with smell (%)
Taste & Smell - People 40+ having problems with taste (%)
Taste & Smell - People 40+ that ever had wisdom teeth removed (%)
Taste & Smell - People 40+ that ever had tonsils teeth removed (%)
Taste & Smell - People 40+ that ever had a loss of consciousness because of a head injury (%)
Taste & Smell - People 40+ that ever had a broken nose or other serious injury to face or skull (%)
Taste & Smell - People 40+ that ever had two or more sinus infections (%)
Weight - Average height (inches)
Weight - Average weight (pounds)
Weight - Average BMI
Weight - People that are obese (%)
Weight - People that ever were obese (%)
Weight - People trying to lose weight (%)
According to our research of Georgia and other state lists, there were 6 registered sex offenders living in Peachtree City, Georgia as of July 02, 2024 . The ratio of all residents to sex offenders in Peachtree City is 5,953 to 1.The ratio of registered sex offenders to all residents in this city is much lower than the state average.
Officers per 1,000 residents here:
1.70Georgia average:
2.45
Latest news from Peachtree City, GA collected exclusively by city-data.com from local newspapers, TV, and radio stations
Ancestries: English (11.5%), American (8.2%), German (6.5%), Irish (5.9%), European (5.8%), Italian (2.8%).
Current Local Time:
Land area: 23.3 square miles.
Population density: 1,700 people per square mile (low).
6,039 residents are foreign born (7.1% Asia , 3.3% Latin America , 2.8% Europe ).
This city:
15.4%Georgia:
10.4%
Median real estate property taxes paid for housing units with mortgages in 2022: $4,561 (0.9%)Median real estate property taxes paid for housing units with no mortgage in 2022: $2,875 (0.6%)
Nearest city with pop. 50,000+: Atlanta, GA
Nearest city with pop. 1,000,000+: Chicago, IL
Nearest cities:
Turin, GA (2.5 miles),
Woolsey, GA (3.1 miles),
Latitude: 33.40 N, Longitude: 84.57 W
Daytime population change due to commuting: +8,454 (+21.5%)Workers who live and work in this city: 9,145 (51.4%)
Peachtree City tourist attractions:
Single-family new house construction building permits:
2022: 281 buildings , average cost: $387,9002021: 344 buildings , average cost: $340,3002020: 216 buildings , average cost: $298,1002019: 181 buildings , average cost: $281,9002018: 230 buildings , average cost: $276,8002017: 282 buildings , average cost: $232,7002016: 87 buildings , average cost: $338,5002015: 36 buildings , average cost: $373,5002014: 39 buildings , average cost: $308,3002013: 25 buildings , average cost: $261,6002012: 21 buildings , average cost: $212,0002011: 15 buildings , average cost: $212,6002010: 15 buildings , average cost: $242,2002009: 32 buildings , average cost: $212,8002008: 36 buildings , average cost: $207,3002007: 73 buildings , average cost: $233,7002006: 106 buildings , average cost: $255,6002005: 155 buildings , average cost: $239,0002004: 202 buildings , average cost: $184,8002003: 300 buildings , average cost: $202,6002002: 239 buildings , average cost: $205,7002001: 186 buildings , average cost: $222,3002000: 131 buildings , average cost: $231,2001999: 264 buildings , average cost: $200,6001998: 293 buildings , average cost: $179,1001997: 354 buildings , average cost: $158,000Unemployment in December 2023:
Population change in the 1990s: +12,329 (+64.0%).
Most common occupations in Peachtree City, GA (%)
Both Males Females
Aircraft and traffic control occupations (5.7%)
Other management occupations, except farmers and farm managers (5.4%)
Top executives (4.3%)
Preschool, kindergarten, elementary, and middle school teachers (4.3%)
Other sales and related occupations, including supervisors (3.8%)
Secretaries and administrative assistants (3.8%)
Computer specialists (3.5%)
Aircraft and traffic control occupations (10.0%)
Other management occupations, except farmers and farm managers (7.3%)
Top executives (7.0%)
Computer specialists (5.0%)
Sales representatives, services, wholesale and manufacturing (4.8%)
Engineers (4.0%)
Advertising, marketing, promotions, public relations, and sales managers (3.9%)
Secretaries and administrative assistants (8.1%)
Preschool, kindergarten, elementary, and middle school teachers (8.0%)
Other office and administrative support workers, including supervisors (5.3%)
Registered nurses (5.2%)
Other sales and related occupations, including supervisors (4.5%)
Information and record clerks, except customer service representatives (3.7%)
Bookkeeping, accounting, and auditing clerks (3.6%)
Tornado activity:
Peachtree City-area historical tornado activity is slightly above Georgia state average. It is 56% greater than the overall U.S. average.
On 3/5/1989, a category F3 (max. wind speeds 158-206 mph) tornado 6.5 miles away from the Peachtree City city center injured 23 people and caused between $5,000,000 and $50,000,000 in damages.
On 4/2/1970, a category F3 tornado 14.1 miles away from the city center caused between $5000 and $50,000 in damages.
Earthquake activity:
Peachtree City-area historical earthquake activity is significantly above Georgia state average. It is 49% greater than the overall U.S. average. On 4/29/2003 at 08:59:39, a magnitude 4.9 (4.4 MB, 4.6 MW, 4.9 LG, Class: Light, Intensity: IV - V) earthquake occurred 97.1 miles away from the city center On 8/2/1974 at 08:52:09, a magnitude 4.9 (4.3 MB, 4.9 LG) earthquake occurred 124.3 miles away from the city center On 4/29/2003 at 08:59:39, a magnitude 4.6 (4.6 MW, Depth: 12.3 mi) earthquake occurred 97.1 miles away from Peachtree City center On 1/18/1999 at 07:00:53, a magnitude 4.8 (4.8 MB, 4.0 LG, Depth: 0.6 mi) earthquake occurred 155.0 miles away from Peachtree City center On 11/30/1973 at 07:48:41, a magnitude 4.7 (4.7 MB, 4.6 ML) earthquake occurred 169.6 miles away from Peachtree City center On 10/24/1997 at 08:35:17, a magnitude 4.9 (4.8 MB, 4.2 MS, 4.9 LG, Depth: 6.2 mi) earthquake occurred 223.0 miles away from the city center Magnitude types: regional Lg-wave magnitude (LG), body-wave magnitude (MB), local magnitude (ML), surface-wave magnitude (MS), moment magnitude (MW) Natural disasters: The number of natural disasters in Fayette County (9) is smaller than the US average (15).Major Disasters (Presidential) Declared: 4Emergencies Declared: 4Winter Storms: 3, Floods: 2, Hurricanes: 2, Drought: 1, Heavy Rain: 1, Snowfall: 1, Storm: 1, Tornado: 1, Tropical Storm: 1, Other: 1 (Note: some incidents may be assigned to more than one category). Main business address for: WORLD AIR HOLDINGS, INC. AIR TRANSPORTATION, NONSCHEDULED ).
Hospitals and medical centers in Peachtree City: SOUTHLAND HEALTH AND REHABILITATION (151 WISDOM ROAD)
PEACHTREE CITY DIALYSIS (2830 W HWY 54)
Other hospitals and medical centers near Peachtree City: PIEDMONT FAYETTE HOSPITAL (about 6 miles away; FAYETTEVILLE, GA)
KINDRED TRANSITIONAL CARE AND REHAB - LAFAYETTE (Nursing Home, about 7 miles away; FAYETTEVILLE, GA)
DCI FAYETTEVILLE (Dialysis Facility, about 7 miles away; FAYETTEVILLE, GA)
HOSPICE ADVANTAGE, INC (Hospital, about 7 miles away; FAYETTEVILLE, GA)
HARBOR GRACE HOSPICE, INC (Hospital, about 8 miles away; FAYETTEVILLE, GA)
NRA PALMETTO (Dialysis Facility, about 11 miles away; PALMETTO, GA)
PIEDMONT NEWNAN HOSPITAL, INC (about 11 miles away; NEWNAN, GA)
Airports located in Peachtree City: Colleges/universities with over 2000 students nearest to Peachtree City:
Southern Crescent Technical College (about 19 miles; Griffin, GA ; Full-time enrollment: 4,168)
Clayton State University (about 20 miles; Morrow, GA ; FT enrollment: 5,844)
Atlanta Metropolitan State College (about 24 miles; Atlanta, GA ; FT enrollment: 2,437)
Atlanta Technical College (about 24 miles; Atlanta, GA ; FT enrollment: 4,217)
Spelman College (about 26 miles; Atlanta, GA ; FT enrollment: 2,383)
Morehouse College (about 26 miles; Atlanta, GA ; FT enrollment: 2,379)
Clark Atlanta University (about 26 miles; Atlanta, GA ; FT enrollment: 3,201)
Public high school in Peachtree City:
Public elementary/middle schools in Peachtree City: HUDDLESTON ELEMENTARY SCHOOL Students: 643, Location: 200 MCINTOSH TRL, Grades: PK-5)KEDRON ELEMENTARY SCHOOL Students: 589, Location: 200 KEDRON DR, Grades: PK-5)BRAELINN ELEMENTARY SCHOOL Students: 566, Location: 975 ROBINSON RD, Grades: PK-5)CRABAPPLE LANE ELEMENTARY SCHOOL Students: 559, Location: 450 CRABAPPLE LN, Grades: PK-5)OAK GROVE ELEMENTARY SCHOOL Students: 483, Location: 101 CROSSTOWN DR, Grades: PK-5)PEACHTREE CITY ELEMENTARY SCHOOL Students: 442, Location: 201 WISDOM RD, Grades: PK-5)BOOTH MIDDLE SCHOOL Location: 250 S PEACHTREE PKWY, Grades: 6-8)
Private elementary/middle school in Peachtree City: ST PAUL LUTHERAN SCHOOL Students: 204, Location: 700 ARDENLEE PKWY, Grades: PK-8)
See full list of schools located in Peachtree City User-submitted facts and corrections:
Lighthouse United Methodist Church is a new church starting in Peachtree City, Georgia starting August 13. They are currently hosting preview services and informational dinners for interested people. Please view their web site at www.lighthouseumc.net for more information.
Notable locations in Peachtree City: (A) , Flat Creek Country Club (B) , Falcon Field Business Park (C) , Eastbrook Office Park (D) , Peachtree City Fire Department Station 84 Satterthwaite (E) , Peachtree City Fire Department Station 83 Weber (F) , Peachtree Executive Conference Center (G) , Peachtree City Police Station (H) , Peachtree City Fire Department Station 82 Neely (I) , Peachtree City Fire Department Station 81 Leach (J) , McIntosh Amphitheatre (K) . Display/hide their locations on the map
Shopping Centers: (1) , Peachtree Crossing Shopping Center (2) , Aberdeen Village Shopping Center (3) , Braelinn Village Shopping Center (4) , Kendron Village Shopping Center (5) , Westpark Walk Shopping Center (6) . Display/hide their locations on the map
Main business address in Peachtree City: (A) . Display/hide its location on the map
Churches in Peachtree City include: (A) , Line Creek Church (B) , Bethlehem Church (C) . Display/hide their locations on the map
Cemetery: (1) . Display/hide its location on the map
Lakes and reservoirs: (A) , Lake Peachtree (B) , Lake Kedron (C) . Display/hide their locations on the map
Streams, rivers, and creeks: (A) , Shoal Creek (B) , Gin Branch (C) , Flat Creek (D) . Display/hide their locations on the map
Parks in Peachtree City include: (1) , Clover Reach Recreation Center (2) , Glenloch Recreation Center (3) , Pebblepocket Park (4) , Riley Recreation Field (5) , Stevens Entry Park (6) . Display/hide their locations on the map
Tourist attractions: (1) , Falcon Air Charter (Tours & Charters; 5 Falcon Drive) (2) , Culture Club of Georgia (Tours & Charters; 300 Willow Bend Road) (3) . Display/hide their approximate locations on the map
Hotels: (1) , Hampton Inn Atlanta/Peachtree City (300 Westpark Drive) (2) , Hampton Inn - Peachtree City (300 Westpark Drive) (3) , Best Western Peachtree City (976 Crosstown Road) (4) , Days Inn Peachtree City (2800 Highway 54 West) (5) . Display/hide their approximate locations on the map
Birthplace of: Reed Sorenson - Busch series NASCAR driver (born : Feb 5, 1986).
Fayette County has a predicted average indoor radon screening level between 2 and 4 pCi/L (pico curies per liter) - Moderate Potential Drinking water stations with addresses in Peachtree City and their reported violations in the past:
COUNTRY MEADOWS MOBILE HOME PARK (Serves IN, Population served: 63, Groundwater):
Past health violations:
MCL, Monthly (TCR) - In AUG-2013, Contaminant: Coliform. Follow-up actions: St Boil Water Order (AUG-26-2013), St Public Notif requested (AUG-26-2013), St Violation/Reminder Notice (AUG-26-2013), St Public Notif received (AUG-30-2013), St Compliance achieved (SEP-05-2013)
Past monitoring violations:
One routine major monitoring violation
Average household size: This city:
2.7 peopleGeorgia:
2.6 people
Percentage of family households: This city:
77.5%Whole state:
68.5%
Percentage of households with unmarried partners: This city:
2.7%Whole state:
5.9%
Likely homosexual households (counted as self-reported same-sex unmarried-partner households)
Lesbian couples: 0.3% of all households Gay men: 0.2% of all households
118 people in nursing facilities/skilled-nursing facilities in 2010people in nursing homes in 2000
Banks with most branches in Peachtree City (2011 data):
SunTrust Bank: Peachtree City Branch, East Peachtree City Branch, Wilshire Pavillion Branch. Info updated 2010/05/27: Bank assets: $171,291.7 mil, Deposits: $129,833.2 mil, headquarters in Atlanta, GA, positive income , Commercial Lending Specialization, 1716 total offices , Holding Company: Suntrust Banks, Inc.
Regions Bank: Peachtree City Main Office at 300 Peachtree Parkway South, branch established on 1989/11/03; Kedron Branch at 100 Kedron Drive, branch established on 1994/03/25. Info updated 2011/02/24: Bank assets: $123,368.2 mil, Deposits: $98,301.3 mil, headquarters in Birmingham, AL, positive income , Commercial Lending Specialization, 1778 total offices , Holding Company: Regions Financial Corporation
Wells Fargo Bank, National Association: Peachtree City Branch at 703 Crossings West, branch established on 1980/10/29; Kedron Village Branch at 993 North Peachtree Parkway, branch established on 2000/06/05. Info updated 2011/04/05: Bank assets: $1,161,490.0 mil, Deposits: $905,653.0 mil, headquarters in Sioux Falls, SD, positive income , 6395 total offices , Holding Company: Wells Fargo & Company
Bank of America, National Association: Braelinn Village Branch at 496 Crosstown Drive, branch established on 1989/07/24; Peachtree City Branch at 500 Northlake Drive, branch established on 1912/01/01. Info updated 2009/11/18: Bank assets: $1,451,969.3 mil, Deposits: $1,077,176.8 mil, headquarters in Charlotte, NC, positive income , 5782 total offices , Holding Company: Bank Of America Corporation
United Community Bank: Peachtree City Branch at 1500 Commerce Drive, branch established on 2003/05/15. Info updated 2009/06/23: Bank assets: $6,977.4 mil, Deposits: $6,170.1 mil, headquarters in Blairsville, GA, negative income in the last year , Commercial Lending Specialization, 106 total offices , Holding Company: United Community Banks, Inc.
CharterBank: Branch 03 / Pchtree City at 300 Finance Avenue, branch established on 2005/08/15. Info updated 2011/09/12: Bank assets: $1,115.4 mil, Deposits: $869.2 mil, headquarters in West Point, GA, positive income , Commercial Lending Specialization, 23 total offices
Synovus Bank: Peachtree National Bank Branch at 2603 Highway 54 West, branch established on 1986/09/11. Info updated 2011/01/25: Bank assets: $26,863.3 mil, Deposits: $22,415.0 mil, headquarters in Columbus, GA, positive income , Commercial Lending Specialization, 296 total offices , Holding Company: Synovus Financial Corp.
The Bank of Georgia: The Bank Of Georgia at 100 West Park Drive, branch established on 2000/02/18. Info updated 2006/11/03: Bank assets: $360.9 mil, Deposits: $332.2 mil, local headquarters , negative income in the last year , Commercial Lending Specialization, 8 total offices , Holding Company: Georgia Bancshares, Inc.
Branch Banking and Trust Company: Peachtree City Branch at 705 Crossings East, branch established on 2000/07/15. Info updated 2010/03/29: Bank assets: $168,867.6 mil, Deposits: $127,549.5 mil, headquarters in Winston Salem, NC, positive income , Commercial Lending Specialization, 1793 total offices , Holding Company: Bb&T Corporation
For population 15 years and over in Peachtree City:
Never married: 24.0%Now married: 60.1%Separated: 0.5%Widowed: 7.6%Divorced: 7.8% For population 25 years and over in Peachtree City:
High school or higher: 97.8%Bachelor's degree or higher: 59.6%Graduate or professional degree: 22.4%Unemployed: 2.3%Mean travel time to work (commute): 22.4 minutes
Education Gini index (Inequality in education) Here:
8.8Georgia average:
12.2
Religion statistics for Peachtree City, GA (based on Fayette County data)
Religion Adherents Congregations Evangelical Protestant 41,380 82 Mainline Protestant 15,629 19 Catholic 10,392 2 Other 1,997 8 Black Protestant 736 5 Orthodox 200 1 None 36,233 -
Source: Clifford Grammich, Kirk Hadaway, Richard Houseal, Dale E.Jones, Alexei Krindatch, Richie Stanley and Richard H.Taylor. 2012. 2010 U.S.Religion Census: Religious Congregations & Membership Study. Association of Statisticians of American Religious Bodies. Jones, Dale E., et al. 2002. Congregations and Membership in the United States 2000. Nashville, TN: Glenmary Research Center. Graphs represent county-level data
Food Environment Statistics: Number of grocery stores : 17Fayette County :
1.61 / 10,000 pop.State :
1.91 / 10,000 pop.
Number of supercenters and club stores : 2Here :
0.19 / 10,000 pop.Georgia :
0.15 / 10,000 pop.
Number of convenience stores (no gas) : 7This county :
0.66 / 10,000 pop.Georgia :
0.86 / 10,000 pop.
Number of convenience stores (with gas) : 45Here :
4.25 / 10,000 pop.Georgia :
5.12 / 10,000 pop.
Number of full-service restaurants : 98Here :
9.26 / 10,000 pop.Georgia :
7.41 / 10,000 pop.
Adult obesity rate : Fayette County :
24.6%Georgia :
27.8%
Low-income preschool obesity rate : Fayette County :
14.4%State :
14.6%
Health and Nutrition: Healthy diet rate : Peachtree City:
54.3%Georgia:
48.9%
Average overall health of teeth and gums : Peachtree City:
54.3%State:
46.5%
People feeling badly about themselves : People not drinking alcohol at all : Peachtree City:
8.6%State:
10.8%
Average hours sleeping at night : Peachtree City:
6.9State:
6.7
Overweight people : Peachtree City:
35.1%State:
33.5%
General health condition : Peachtree City:
61.0%Georgia:
56.2%
Average condition of hearing : Peachtree City:
81.3%Georgia:
80.8%
More about Health and Nutrition of Peachtree City, GA Residents
Peachtree City government finances - Expenditure in 2021 (per resident):
Construction - Regular Highways: $7,202,000 ($182.04)
Parks and Recreation: $1,815,000 ($45.88)General Public Buildings: $165,000 ($4.17)General - Other: $76,000 ($1.92)Financial Administration: $32,000 ($0.81)Police Protection: $6,000 ($0.15)Current Operations - Local Fire Protection: $7,644,000 ($193.22)
Police Protection: $7,295,000 ($184.39)Regular Highways: $4,395,000 ($111.09)Air Transportation: $4,264,000 ($107.78)Water Utilities: $4,178,000 ($105.61)General - Other: $3,463,000 ($87.53)General Public Buildings: $2,860,000 ($72.29)Central Staff Services: $2,786,000 ($70.42)Financial Administration: $1,843,000 ($46.59)Parks and Recreation: $1,550,000 ($39.18)Sewerage: $1,047,000 ($26.46)Libraries: $999,000 ($25.25)Protective Inspection and Regulation - Other: $707,000 ($17.87)Judicial and Legal Services: $444,000 ($11.22)Health - Other: $376,000 ($9.50)General - Interest on Debt: $1,309,000 ($33.09)
Other Capital Outlay - Local Fire Protection: $2,066,000 ($52.22)
Police Protection: $1,482,000 ($37.46)Financial Administration: $433,000 ($10.94)Regular Highways: $338,000 ($8.54)General Public Building: $86,000 ($2.17)Parks and Recreation: $48,000 ($1.21)Air Transportation: $41,000 ($1.04)Central Staff Services: $9,000 ($0.23)Libraries: $9,000 ($0.23)General - Other: $7,000 ($0.18)Total Salaries and Wages: $551,000 ($13.93)
Water Utilities - Interest on Debt: $418,000 ($10.57)
Peachtree City government finances - Revenue in 2021 (per resident):
Charges - Sewerage: $6,563,000 ($165.89)
Air Transportation: $5,028,000 ($127.09)Other: $3,174,000 ($80.23)Parks and Recreation: $264,000 ($6.67)Federal Intergovernmental - Public Welfare: $1,896,000 ($47.92)
Air Transportation: $124,000 ($3.13)Local Intergovernmental - Other: $9,409,000 ($237.83)
General Local Government Support: $8,453,000 ($213.66)Miscellaneous - General Revenue - Other: $1,884,000 ($47.62)
Fines and Forfeits: $711,000 ($17.97)Interest Earnings: $451,000 ($11.40)Sale of Property: $271,000 ($6.85)Donations From Private Sources: $134,000 ($3.39)Rents: $49,000 ($1.24)Revenue - Water Utilities: $6,051,000 ($152.95)
State Intergovernmental - Other: $437,000 ($11.05)
General Local Government Support: $99,000 ($2.50)Tax - Property: $16,758,000 ($423.59)
Public Utilities Sales: $2,941,000 ($74.34)Insurance Premiums Sales: $2,760,000 ($69.76)Other License: $1,228,000 ($31.04)Other Selective Sales: $1,047,000 ($26.46)Alcoholic Beverage Sales: $1,001,000 ($25.30)Occupation and Business License - Other: $472,000 ($11.93)Alcoholic Beverage License: $372,000 ($9.40)Other: $105,000 ($2.65)
Peachtree City government finances - Debt in 2021 (per resident):
Long Term Debt - Beginning Outstanding - Unspecified Public Purpose: $36,882,000 ($932.26)
Outstanding Unspecified Public Purpose: $32,494,000 ($821.34)Retired Unspecified Public Purpose: $4,485,000 ($113.37)Issue, Unspecified Public Purpose: $97,000 ($2.45)
Peachtree City government finances - Cash and Securities in 2021 (per resident):
Other Funds - Cash and Securities: $37,727,000 ($953.62)
Sinking Funds - Cash and Securities: $4,273,000 ($108.01)
Businesses in Peachtree City, GA
Name Count Name Count
AT&T 1 Lane Furniture 1 American Eagle Outfitters 1 LensCrafters 1 Ann Taylor 1 Little Caesars Pizza 1 Arby's 1 McDonald's 3 AutoZone 1 Nike 4 Banana Republic 1 Office Depot 1 Bath & Body Works 1 Outback 1 Bed Bath & Beyond 1 Outback Steakhouse 1 Best Western 1 Panda Express 1 Blockbuster 2 Penske 1 CVS 1 PetSmart 1 Chick-Fil-A 3 Pizza Hut 2 Chico's 1 Publix Super Markets 2 Coldwater Creek 1 Quiznos 1 Curves 1 RadioShack 1 DHL 2 Rite Aid 3 Dairy Queen 1 Rue21 1 Discount Tire 1 SAS Shoes 1 Domino's Pizza 1 Sleep Inn 1 Dunkin Donuts 1 Soma Intimates 1 Ethan Allen 1 Sprint Nextel 1 Famous Footwear 1 Staples 1 FedEx 10 Starbucks 4 GNC 2 Subway 4 GameStop 1 T-Mobile 1 Gap 1 Taco Bell 1 Gymboree 1 Talbots 1 H&R Block 1 Target 1 Hilton 1 The Room Place 1 Holiday Inn 1 U-Haul 3 Home Depot 1 UPS 17 IHOP 1 Verizon Wireless 1 JoS. A. Bank 1 Victoria's Secret 1 Justice 1 Waffle House 2 Kmart 1 Walmart 1 Kroger 2 World Gym 2
Strongest AM radio stations in Peachtree City:
WGST (640 AM; 50 kW; ATLANTA, GA; Owner: CITICASTERS LICENSES, L.P.)
WGUN (1010 AM; 50 kW; ATLANTA, GA; Owner: WGUN, INC.)
WAOK (1380 AM; 50 kW; ATLANTA, GA; Owner: INFINITY BROADCASTING OPERATIONS, INC.)
WSB (750 AM; 50 kW; ATLANTA, GA; Owner: CXR HOLDINGS, INC.)
WMLB (1160 AM; 50 kW; EAST POINT, GA; Owner: ATLANTA AREA BROADCASTING, INC.)
WCNN (680 AM; 50 kW; NORTH ATLANTA, GA; Owner: DICKEY BROADCASTING COMPANY)
WQXI (790 AM; 28 kW; ATLANTA, GA; Owner: JEFFERSON-PILOT COMMUNICATIONS COMPANY OF GEORGIA)
WAZX (1550 AM; 50 kW; SMYRNA, GA; Owner: GA-MEX BROADCASTING, INC.)
WFTD (1080 AM; daytime; 50 kW; MARIETTA, GA; Owner: PRIETO ENTERPRISES, INC.)
WKNG (1060 AM; daytime; 50 kW; TALLAPOOSA, GA; Owner: WKNG, INC.)
WGKA (1190 AM; 25 kW; ATLANTA, GA; Owner: SALEM MEDIA OF GEORGIA, INC.)
WAOS (1600 AM; 20 kW; AUSTELL, GA; Owner: LA FAVORITA, INC.)
WMAC (940 AM; 50 kW; MACON, GA; Owner: CUMULUS LICENSING CORP.)
Strongest FM radio stations in Peachtree City:
WHTA (107.9 FM; HAMPTON, GA; Owner: RADIO ONE LICENSES, LLC)
WPZE (97.5 FM; FAYETTEVILLE, GA; Owner: ROA LICENSES, LLC)
WBZY-FM (96.7 FM; PEACHTREE CITY, GA; Owner: CITICASTERS LICENSES, L.P.)
WALR-FM (104.1 FM; LA GRANGE, GA; Owner: CXR HOLDINGS, INC.)
WWWQ (100.5 FM; ANNISTON, AL; Owner: WNNX LICO, INC.)
WNNX (99.7 FM; ATLANTA, GA; Owner: WNNX LICO, INC.)
WRFG (89.3 FM; ATLANTA, GA; Owner: RADIO FREE GEORGIA BROADCASTING FOUNDATION INC)
WVFJ-FM (93.3 FM; MANCHESTER, GA; Owner: PROVIDENT BROADCASTING COMPANY)
WSB-FM (98.5 FM; ATLANTA, GA; Owner: CXR HOLDINGS, INC.)
WSTR (94.1 FM; SMYRNA, GA; Owner: JEFFERSON-PILOT COMMUNICATIONS COMPANY OF GEORGIA)
WVEE (103.3 FM; ATLANTA, GA; Owner: INFINITY BROADCASTING OPERATIONS, INC.)
WZGC (92.9 FM; ATLANTA, GA; Owner: INFINITY BROADCASTING CORP. OF ATLANTA)
WKHX-FM (101.5 FM; MARIETTA, GA; Owner: ABC, INC.)
WKLS (96.1 FM; ATLANTA, GA; Owner: CITICASTERS LICENSES, L.P.)
WLTM (94.9 FM; ATLANTA, GA; Owner: CITICASTERS LICENSES, L.P.)
WAMJ (102.5 FM; MABLETON, GA; Owner: NEW MABLETON BROADCASTING CORPORATION)
WMAX-FM (105.3 FM; BOWDON, GA; Owner: CLEAR CHANNEL BROADCASTING LICENSES, INC.)
WKEU-FM (88.9 FM; THE ROCK, GA; Owner: GEORGIA FOUNDATION OF PUBLIC BROADCASTING, INC.)
WABE (90.1 FM; ATLANTA, GA; Owner: BOARD OF EDUCATION, CITY OF ATLANTA)
WJSP-FM (88.1 FM; WARM SPRINGS, GA; Owner: GEORGIA PUBLIC TELECOMMUNICATIONS COMMISSION)
TV broadcast stations around Peachtree City:
W04DB (Channel 4; ATLANTA, GA; Owner: VVILPTV, INC.)
WUVG (Channel 34; ATHENS, GA; Owner: UNIVISION ATLANTA LLC)
WSB-TV (Channel 2; ATLANTA, GA; Owner: WSB-TV HOLDINGS, INC.)
WAGA (Channel 5; ATLANTA, GA; Owner: FOX TELEVISION STATIONS, INC.)
WXIA-TV (Channel 11; ATLANTA, GA; Owner: GANNETT GEORGIA, L.P.)
WHSG (Channel 63; MONROE, GA; Owner: TRINITY BROADCASTING NETWORK)
WUPA (Channel 69; ATLANTA, GA; Owner: VIACOM STATIONS GROUP OF ATLANTA INC.)
WANN-LP (Channel 32; ATLANTA, GA; Owner: PRISM BROADCASTING NETWORK, INC.)
WDTA-LP (Channel 53; FAYETTEVILLE, GA; Owner: WORD OF GOD FELLOWSHIP, INC.)
WPBA (Channel 30; ATLANTA, GA; Owner: BOARD OF EDUCATION OF THE CITY OF ATLANTA)
WATL (Channel 36; ATLANTA, GA; Owner: WATL, LLC)
WTBS (Channel 17; ATLANTA, GA; Owner: SUPERSTATION, INC.)
WGCL-TV (Channel 46; ATLANTA, GA; Owner: MEREDITH CORPORATION)
WTHC-LP (Channel 42; ATLANTA, GA; Owner: THE ATLANTA CHANNEL, INC.)
WANX-LP (Channel 26; ATLANTA, GA; Owner: PRISM BROADCASTING NETWORK, INC.)
WIRE-CA (Channel 40; ATLANTA, GA; Owner: COMMERCIAL BROADCASTING CORP.)
WJSP-TV (Channel 28; COLUMBUS, GA; Owner: GEORGIA PUBLIC TELECOMMUNICATIONS COMMISSION)
W52CL (Channel 52; MACON, GA; Owner: TRINITY BROADCASTING NETWORK)
W24AL (Channel 24; ATLANTA, GA; Owner: VENTANA TELEVISION, INC.)
WATC (Channel 57; ATLANTA, GA; Owner: COMMUNITY TELEVISION, INC.)
National Bridge Inventory (NBI) Statistics 36 Number of bridges413ft / 126m Total length $31,608,000 Total costs313,785 Total average daily traffic6,688 Total average daily truck traffic
New bridges - historical statistics
1 1940-1949 3 1950-1959 1 1960-1969 7 1970-1979 8 1980-1989 5 1990-1999 6 2000-2009 3 2010-2019
See full National Bridge Inventory statistics for Peachtree City, GA
Home Mortgage Disclosure Act Aggregated Statistics For Year 2009(Based on 2 full and 4 partial tracts) A) FHA, FSA/RHS & VA B) Conventional C) Refinancings D) Home Improvement Loans E) Loans on Dwellings For 5+ Families F) Non-occupant Loans on G) Loans On Manufactured Number Average Value Number Average Value Number Average Value Number Average Value Number Average Value Number Average Value Number Average Value
LOANS ORIGINATED 87 $215,206 177 $250,813 879 $215,206 35 $102,727 0 $0 35 $158,985 1 $14,480 APPLICATIONS APPROVED, NOT ACCEPTED 1 $101,320 16 $258,849 52 $239,302 6 $78,927 0 $0 2 $187,390 0 $0 APPLICATIONS DENIED 12 $191,496 18 $242,191 246 $246,843 13 $96,108 0 $0 11 $96,473 1 $37,610 APPLICATIONS WITHDRAWN 17 $178,394 22 $218,670 204 $230,307 4 $163,818 1 $183,000 6 $220,652 0 $0 FILES CLOSED FOR INCOMPLETENESS 3 $201,227 4 $235,842 27 $220,680 0 $0 0 $0 2 $134,705 1 $19,910
Aggregated Statistics For Year 2008(Based on 2 full and 4 partial tracts) A) FHA, FSA/RHS & VA B) Conventional C) Refinancings D) Home Improvement Loans F) Non-occupant Loans on G) Loans On Manufactured Number Average Value Number Average Value Number Average Value Number Average Value Number Average Value Number Average Value
LOANS ORIGINATED 73 $223,718 260 $232,356 398 $227,018 38 $75,291 73 $172,699 1 $30,170 APPLICATIONS APPROVED, NOT ACCEPTED 5 $192,662 22 $220,866 57 $220,519 6 $62,610 6 $119,427 1 $129,000 APPLICATIONS DENIED 10 $226,283 26 $215,163 164 $218,715 35 $66,853 18 $160,536 4 $25,208 APPLICATIONS WITHDRAWN 8 $212,202 34 $215,841 109 $229,594 8 $129,004 10 $157,366 1 $10,260 FILES CLOSED FOR INCOMPLETENESS 1 $158,000 3 $264,153 14 $246,296 4 $121,128 2 $126,215 0 $0
Aggregated Statistics For Year 2007(Based on 2 full and 4 partial tracts) A) FHA, FSA/RHS & VA B) Conventional C) Refinancings D) Home Improvement Loans F) Non-occupant Loans on G) Loans On Manufactured Number Average Value Number Average Value Number Average Value Number Average Value Number Average Value Number Average Value
LOANS ORIGINATED 28 $217,501 498 $198,251 433 $191,075 68 $69,176 93 $144,798 4 $52,540 APPLICATIONS APPROVED, NOT ACCEPTED 3 $168,510 60 $170,551 88 $182,008 9 $49,491 17 $139,727 2 $21,545 APPLICATIONS DENIED 5 $202,234 67 $182,147 251 $209,474 62 $83,243 19 $104,488 2 $86,800 APPLICATIONS WITHDRAWN 4 $204,485 53 $179,120 123 $219,172 8 $115,092 12 $158,705 1 $106,000 FILES CLOSED FOR INCOMPLETENESS 0 $0 20 $223,455 42 $229,487 4 $200,955 4 $141,910 0 $0
Aggregated Statistics For Year 2006(Based on 2 full and 4 partial tracts) A) FHA, FSA/RHS & VA B) Conventional C) Refinancings D) Home Improvement Loans E) Loans on Dwellings For 5+ Families F) Non-occupant Loans on G) Loans On Manufactured Number Average Value Number Average Value Number Average Value Number Average Value Number Average Value Number Average Value Number Average Value
LOANS ORIGINATED 23 $221,833 746 $183,357 487 $181,511 83 $71,936 1 $4,040,700 149 $132,865 1 $22,330 APPLICATIONS APPROVED, NOT ACCEPTED 1 $195,680 60 $176,970 87 $180,122 13 $57,318 0 $0 11 $116,747 3 $60,607 APPLICATIONS DENIED 1 $213,930 86 $176,964 239 $200,324 62 $47,754 0 $0 28 $111,164 4 $45,112 APPLICATIONS WITHDRAWN 2 $204,650 68 $188,092 187 $186,174 16 $116,102 0 $0 18 $144,523 0 $0 FILES CLOSED FOR INCOMPLETENESS 0 $0 16 $150,274 48 $224,170 2 $67,315 0 $0 6 $107,150 0 $0
Aggregated Statistics For Year 2005(Based on 2 full and 4 partial tracts) A) FHA, FSA/RHS & VA B) Conventional C) Refinancings D) Home Improvement Loans E) Loans on Dwellings For 5+ Families F) Non-occupant Loans on G) Loans On Manufactured Number Average Value Number Average Value Number Average Value Number Average Value Number Average Value Number Average Value Number Average Value
LOANS ORIGINATED 32 $181,274 749 $183,313 664 $182,293 55 $62,078 1 $1,665,280 148 $138,632 2 $45,165 APPLICATIONS APPROVED, NOT ACCEPTED 1 $165,670 65 $194,139 86 $187,754 12 $55,162 0 $0 12 $133,381 1 $47,410 APPLICATIONS DENIED 5 $147,892 101 $182,147 226 $187,033 48 $77,343 0 $0 27 $150,083 1 $32,320 APPLICATIONS WITHDRAWN 2 $131,195 59 $177,705 203 $209,757 28 $194,509 0 $0 15 $175,755 1 $114,000 FILES CLOSED FOR INCOMPLETENESS 2 $105,615 17 $166,779 100 $214,018 4 $39,222 0 $0 8 $147,979 0 $0
Aggregated Statistics For Year 2004(Based on 2 full and 4 partial tracts) A) FHA, FSA/RHS & VA B) Conventional C) Refinancings D) Home Improvement Loans E) Loans on Dwellings For 5+ Families F) Non-occupant Loans on G) Loans On Manufactured Number Average Value Number Average Value Number Average Value Number Average Value Number Average Value Number Average Value Number Average Value
LOANS ORIGINATED 43 $172,390 806 $190,516 750 $180,918 70 $81,097 1 $6,824,450 163 $135,801 3 $53,397 APPLICATIONS APPROVED, NOT ACCEPTED 2 $181,275 72 $170,307 78 $182,599 12 $48,815 0 $0 10 $126,431 1 $38,340 APPLICATIONS DENIED 4 $146,832 66 $163,165 257 $168,371 44 $75,828 0 $0 12 $159,068 6 $40,745 APPLICATIONS WITHDRAWN 4 $136,670 53 $208,201 169 $171,356 19 $81,142 1 $7,421,820 16 $141,531 0 $0 FILES CLOSED FOR INCOMPLETENESS 1 $138,000 23 $199,847 71 $192,161 7 $33,276 0 $0 3 $125,513 0 $0
Aggregated Statistics For Year 2003(Based on 2 full and 4 partial tracts) A) FHA, FSA/RHS & VA B) Conventional C) Refinancings D) Home Improvement Loans E) Loans on Dwellings For 5+ Families F) Non-occupant Loans on Number Average Value Number Average Value Number Average Value Number Average Value Number Average Value Number Average Value
LOANS ORIGINATED 52 $163,097 678 $177,744 2,090 $170,206 45 $46,670 1 $253,630 170 $133,801 APPLICATIONS APPROVED, NOT ACCEPTED 1 $84,740 33 $208,712 149 $169,855 4 $71,340 0 $0 12 $118,783 APPLICATIONS DENIED 2 $97,485 35 $171,641 226 $156,885 20 $32,736 0 $0 18 $115,569 APPLICATIONS WITHDRAWN 7 $173,596 56 $176,704 211 $181,938 5 $75,270 0 $0 16 $133,153 FILES CLOSED FOR INCOMPLETENESS 1 $232,300 10 $188,350 65 $189,990 3 $42,283 0 $0 6 $121,073
Aggregated Statistics For Year 1999(Based on 3 partial tracts) A) FHA, FSA/RHS & VA B) Conventional C) Refinancings D) Home Improvement Loans F) Non-occupant Loans on Number Average Value Number Average Value Number Average Value Number Average Value Number Average Value
LOANS ORIGINATED 75 $138,597 545 $170,553 342 $137,543 49 $29,719 42 $96,498 APPLICATIONS APPROVED, NOT ACCEPTED 0 $0 25 $167,370 45 $97,045 10 $19,506 2 $95,230 APPLICATIONS DENIED 4 $118,758 58 $133,439 81 $115,280 21 $25,637 4 $109,162 APPLICATIONS WITHDRAWN 4 $140,988 49 $170,439 67 $150,219 9 $44,680 7 $115,364 FILES CLOSED FOR INCOMPLETENESS 1 $124,490 5 $141,768 17 $159,918 2 $17,080 1 $124,050
Detailed HMDA statistics for the following Tracts:
1402.05
, 1402.06 , 1403.03 , 1403.04 , 1403.06 , 1403.07
Private Mortgage Insurance Companies Aggregated Statistics For Year 2009(Based on 2 full and 4 partial tracts) A) Conventional B) Refinancings C) Non-occupant Loans on Number Average Value Number Average Value Number Average Value
LOANS ORIGINATED 30 $270,399 31 $260,539 0 $0 APPLICATIONS APPROVED, NOT ACCEPTED 4 $314,362 13 $248,316 1 $186,000 APPLICATIONS DENIED 4 $228,155 10 $311,092 1 $81,780 APPLICATIONS WITHDRAWN 1 $406,810 2 $189,000 0 $0 FILES CLOSED FOR INCOMPLETENESS 1 $258,700 0 $0 0 $0
Aggregated Statistics For Year 2008(Based on 2 full and 4 partial tracts) A) Conventional B) Refinancings C) Non-occupant Loans on Number Average Value Number Average Value Number Average Value
LOANS ORIGINATED 82 $248,937 41 $250,100 12 $193,032 APPLICATIONS APPROVED, NOT ACCEPTED 15 $272,817 23 $257,315 4 $179,750 APPLICATIONS DENIED 7 $199,979 4 $293,712 5 $183,256 APPLICATIONS WITHDRAWN 6 $266,325 8 $259,250 1 $388,690 FILES CLOSED FOR INCOMPLETENESS 0 $0 2 $253,265 0 $0
Aggregated Statistics For Year 2007(Based on 2 full and 4 partial tracts) A) Conventional B) Refinancings C) Non-occupant Loans on D) Loans On Manufactured Number Average Value Number Average Value Number Average Value Number Average Value
LOANS ORIGINATED 90 $226,580 35 $210,457 8 $170,206 1 $106,000 APPLICATIONS APPROVED, NOT ACCEPTED 10 $241,440 13 $228,282 0 $0 0 $0 APPLICATIONS DENIED 0 $0 2 $148,370 1 $54,310 0 $0 APPLICATIONS WITHDRAWN 4 $210,775 3 $261,427 1 $156,940 0 $0 FILES CLOSED FOR INCOMPLETENESS 1 $120,080 1 $136,970 0 $0 0 $0
Aggregated Statistics For Year 2006(Based on 2 full and 4 partial tracts) A) Conventional B) Refinancings C) Non-occupant Loans on Number Average Value Number Average Value Number Average Value
LOANS ORIGINATED 61 $196,557 27 $224,127 6 $153,868 APPLICATIONS APPROVED, NOT ACCEPTED 6 $183,333 6 $238,462 2 $108,695 APPLICATIONS DENIED 1 $710,000 1 $78,220 0 $0 APPLICATIONS WITHDRAWN 4 $195,322 2 $241,155 1 $106,000 FILES CLOSED FOR INCOMPLETENESS 0 $0 0 $0 0 $0
Aggregated Statistics For Year 2005(Based on 2 full and 4 partial tracts) A) Conventional B) Refinancings C) Non-occupant Loans on Number Average Value Number Average Value Number Average Value
LOANS ORIGINATED 79 $207,621 34 $219,193 15 $215,877 APPLICATIONS APPROVED, NOT ACCEPTED 6 $175,192 15 $174,459 1 $79,410 APPLICATIONS DENIED 0 $0 0 $0 0 $0 APPLICATIONS WITHDRAWN 2 $222,850 3 $192,557 1 $77,040 FILES CLOSED FOR INCOMPLETENESS 0 $0 0 $0 0 $0
Aggregated Statistics For Year 2004(Based on 2 full and 4 partial tracts) A) Conventional B) Refinancings C) Non-occupant Loans on Number Average Value Number Average Value Number Average Value
LOANS ORIGINATED 87 $196,419 54 $207,821 15 $136,814 APPLICATIONS APPROVED, NOT ACCEPTED 8 $217,640 12 $191,601 1 $102,520 APPLICATIONS DENIED 0 $0 1 $175,810 0 $0 APPLICATIONS WITHDRAWN 3 $190,317 12 $185,320 1 $77,240 FILES CLOSED FOR INCOMPLETENESS 1 $166,190 0 $0 0 $0
Aggregated Statistics For Year 2003(Based on 2 full and 4 partial tracts) A) Conventional B) Refinancings C) Non-occupant Loans on Number Average Value Number Average Value Number Average Value
LOANS ORIGINATED 104 $185,337 156 $185,221 18 $132,277 APPLICATIONS APPROVED, NOT ACCEPTED 12 $225,030 29 $190,320 1 $162,050 APPLICATIONS DENIED 1 $117,930 3 $251,620 0 $0 APPLICATIONS WITHDRAWN 4 $180,098 10 $188,697 1 $78,820 FILES CLOSED FOR INCOMPLETENESS 0 $0 1 $125,630 0 $0
Aggregated Statistics For Year 1999(Based on 3 partial tracts) A) Conventional B) Refinancings C) Non-occupant Loans on Number Average Value Number Average Value Number Average Value
LOANS ORIGINATED 175 $174,459 39 $146,698 9 $101,631 APPLICATIONS APPROVED, NOT ACCEPTED 10 $164,478 8 $146,816 0 $0 APPLICATIONS DENIED 6 $189,060 1 $172,940 1 $140,640 APPLICATIONS WITHDRAWN 3 $292,930 3 $152,860 0 $0 FILES CLOSED FOR INCOMPLETENESS 1 $161,050 0 $0 0 $0
Detailed PMIC statistics for the following Tracts:
1402.05
, 1402.06 , 1403.03 , 1403.04 , 1403.06 , 1403.07 Fire-safe hotels and motels in Peachtree City, Georgia:
Peachtree City Hotel & Conference Center, 2443 Hwy 54 W, Peachtree City, Georgia 30269 Phone: (770) 486-3317, Fax: (770) 487-5190
Sleep Inn, 109 City Cir, Peachtree City, Georgia 30269 Phone: (770) 486-0044, Fax: (770) 632-7083
Crowne Plaza Atlanta SW - Peachtree City, 201 Aberdeen Pkwy, Peachtree City, Georgia 30269 Phone: (770) 487-2666
Best Western Peachtree City Inn & Suites, 976 Crosstown Dr, Peachtree City, Georgia 30269 Phone: (770) 632-9700, Fax: (770) 632-0308
Hilton Garden Inn Atlanta/Peachtree City, 2010 N Commerce Dr, Peachtree City, Georgia 30269 Phone: (678) 827-8400, Fax: (678) 827-8420
Fairfield Inn & Suites Atlanta Peachtree City, 295 Hwy 74 N, Peachtree city, Georgia 30269 Phone: (888) 236-2427
Fairfield by Marriott Atlanta Peachtree City, 295 Hwy 74N, Peachtree city, Georgia 30269 Phone: (470) 369-7100, Fax: (470) 369-7101
All 7 fire-safe hotels and motels in Peachtree City, Georgia
Most common first names in Peachtree City, GA among deceased individuals Name Count Lived (average)
Mary 78 79.7 years Robert 59 72.8 years James 59 74.8 years John 54 76.5 years William 52 73.4 years Margaret 31 78.5 years Dorothy 29 82.2 years Charles 28 72.0 years Frances 25 76.2 years George 25 77.2 years
Most common last names in Peachtree City, GA among deceased individuals Last name Count Lived (average)
Smith 33 73.0 years Johnson 21 73.2 years Brown 15 76.7 years Davis 14 73.2 years Williams 13 77.0 years Jones 13 77.9 years Young 12 84.0 years Miller 12 80.7 years King 11 72.5 years Wilson 9 75.8 years
Peachtree City compared to Georgia state average:
Median household income above state average. Median house value above state average. Unemployed percentage significantly below state average. Black race population percentage below state average. Foreign-born population percentage above state average. House age below state average. Percentage of population with a bachelor's degree or higher significantly above state average. Peachtree City on our top lists :
#42 on the list of "Top 101 cities with the most residents born in Other Southern Africa (population 500+)"
#51 on the list of "Top 101 cities with largest percentage of males in industries: transportation and warehousing (population 5,000+)"
#17 on the list of "Top 101 counties with the largest increase in the number of deaths per 1000 residents 2000-2006 to 2007-2013 (pop. 50,000+)"
#40 on the list of "Top 101 counties with the largest number of children under 18 without health insurance coverage in 2000 (pop. 50,000+)"
#47 on the list of "Top 101 counties with the largest number of people without health insurance coverage in 2000 (pop. 50,000+)"
Top Patent Applicants
Grzegorz Wronski (21)
Guoqiang Mao (18)
Arthur J. Nonni (16)
Stephen J. Flynn (16)
Robert Ingman (15)
Scott David Wegner (13)
Jamie Waltermire (12)
Timmy L. Gauvin (11)
Jun Zhang (11)
James P. Wingo (11)
Total of 550 patent applications in 2008-2024.


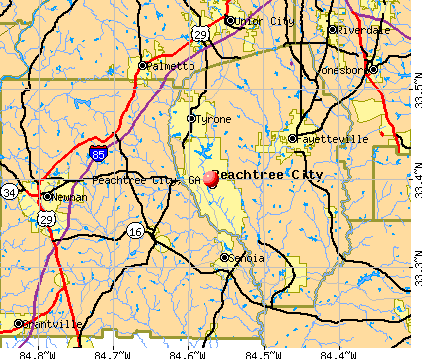


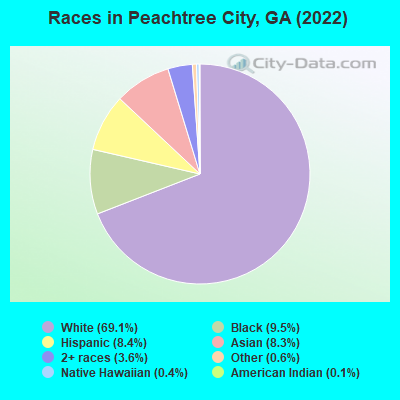
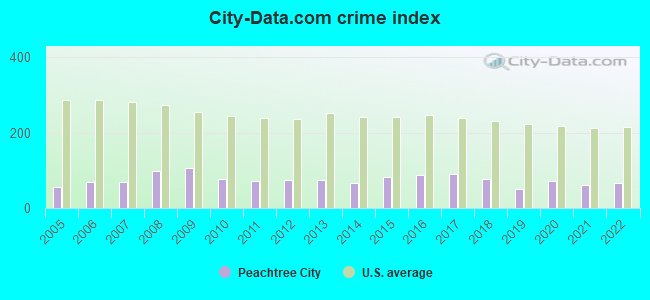
 Recent articles from our blog. Our writers, many of them Ph.D. graduates or candidates, create easy-to-read articles on a wide variety of topics.

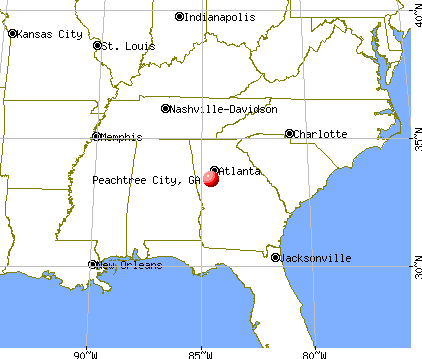
 (26.7 miles
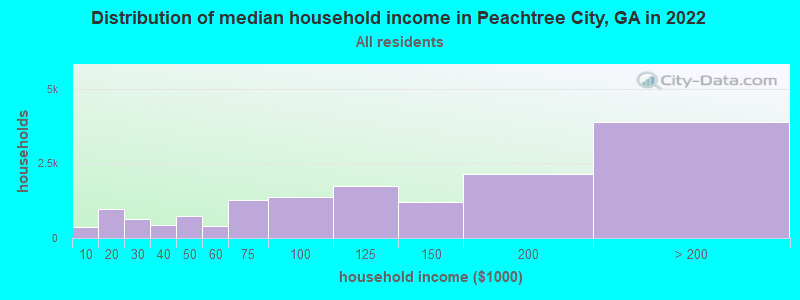
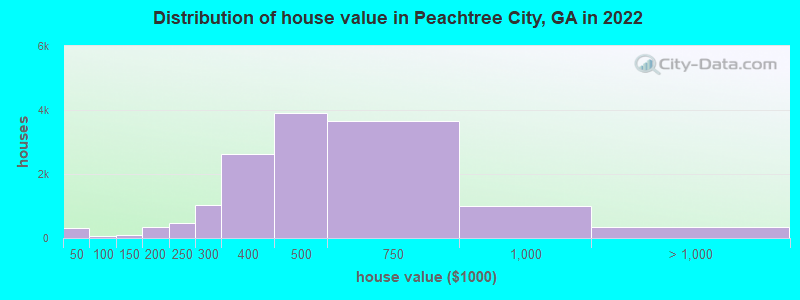
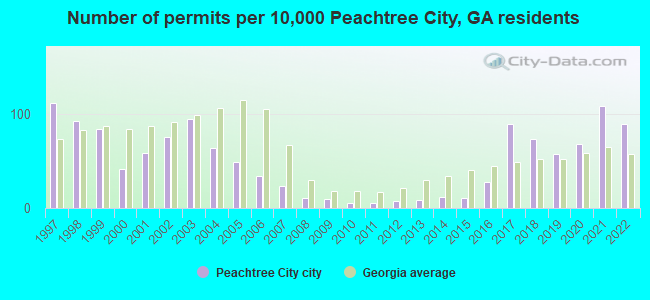
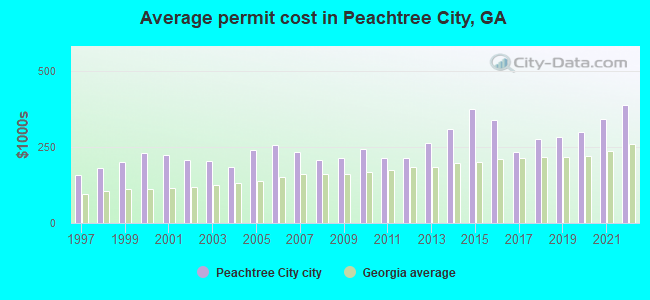
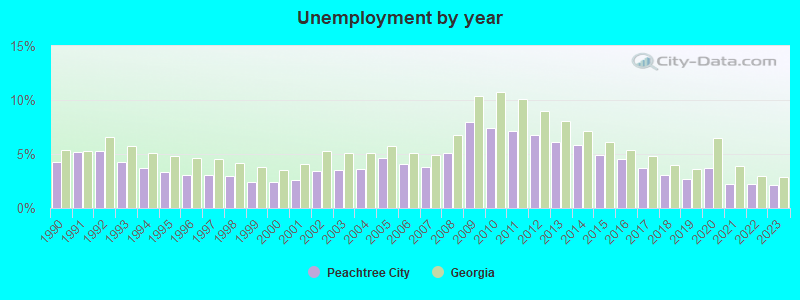
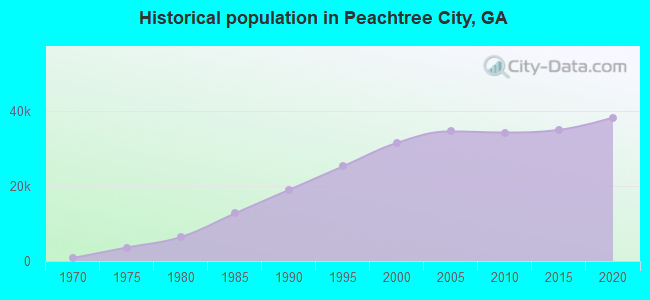
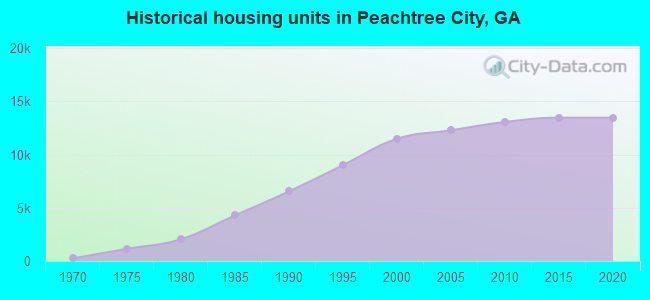
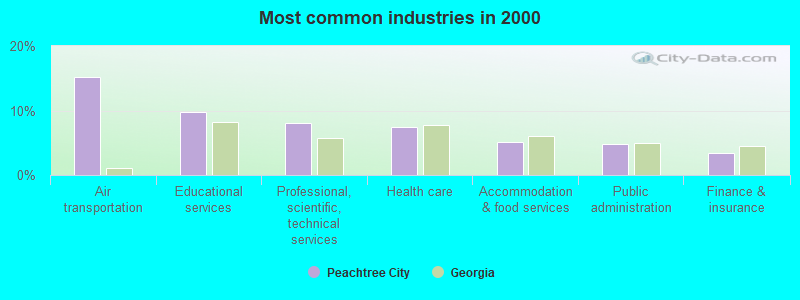
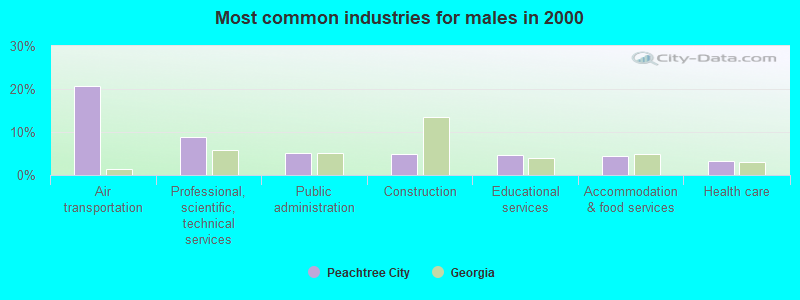
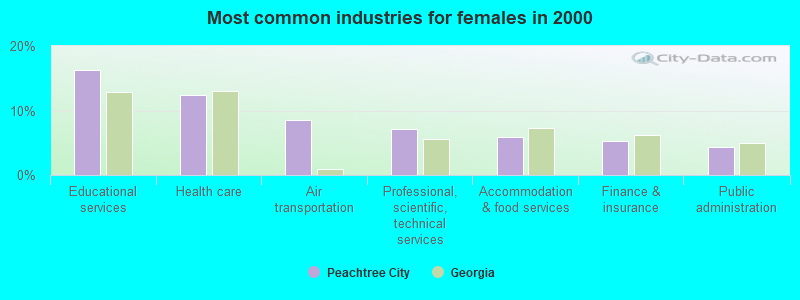
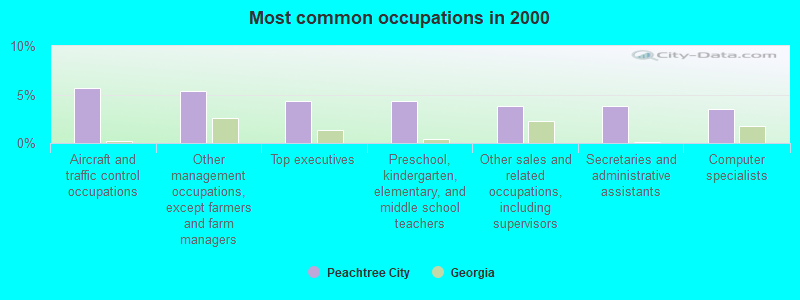
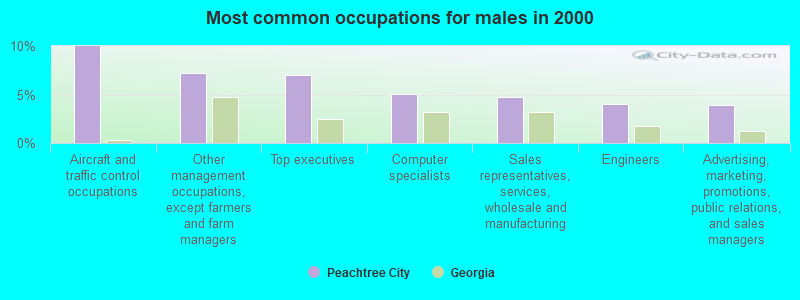
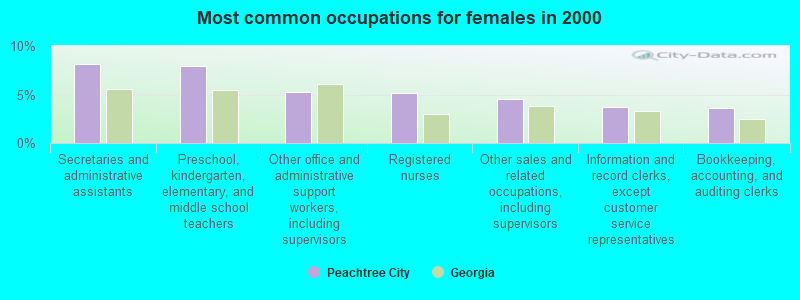


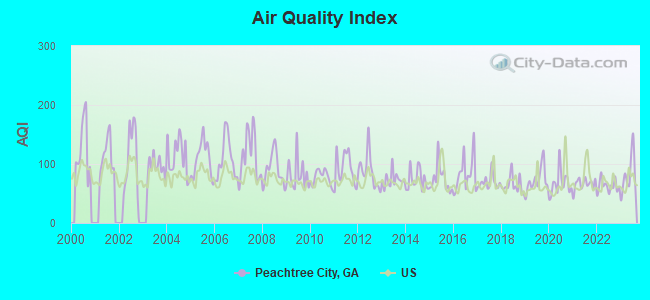
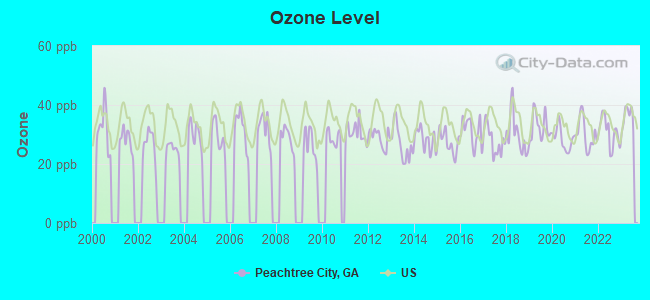
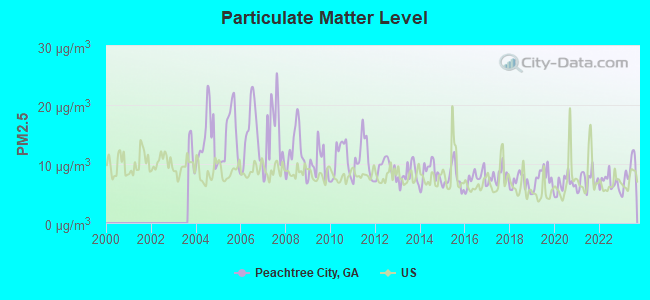
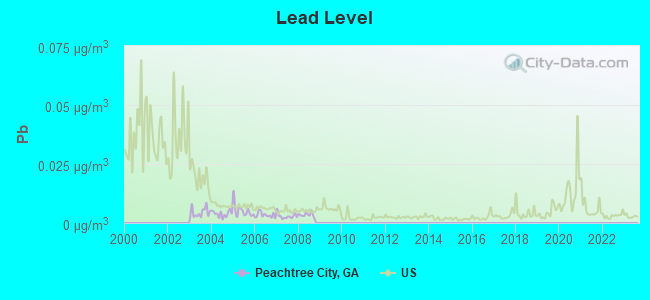

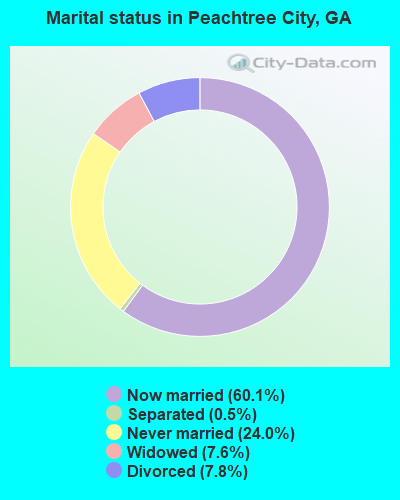
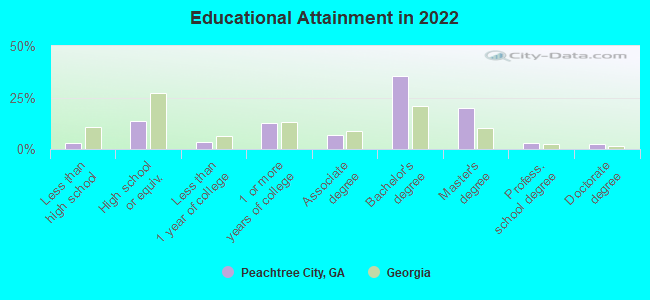
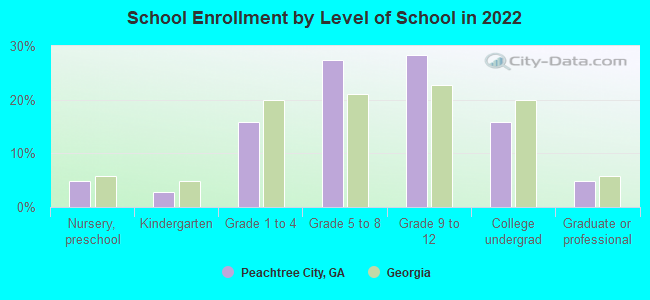
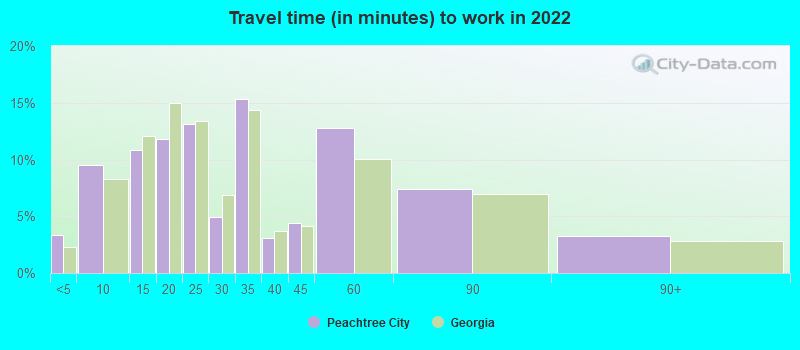
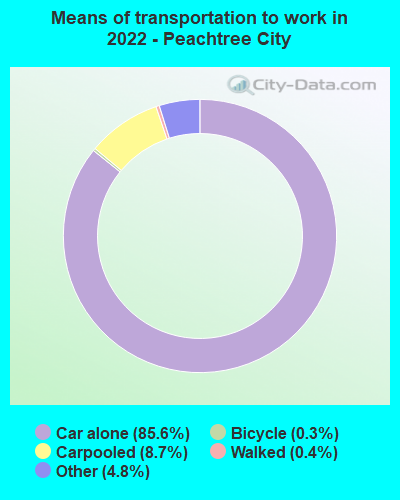
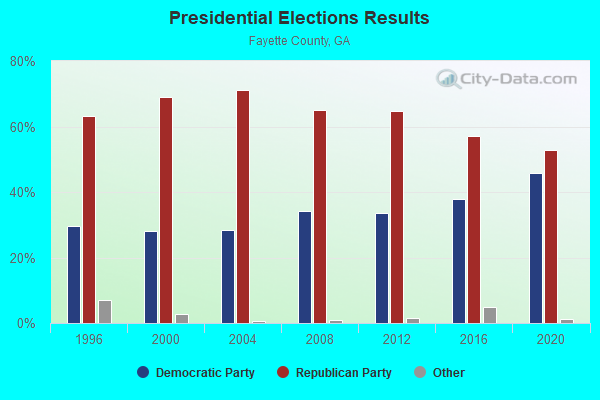
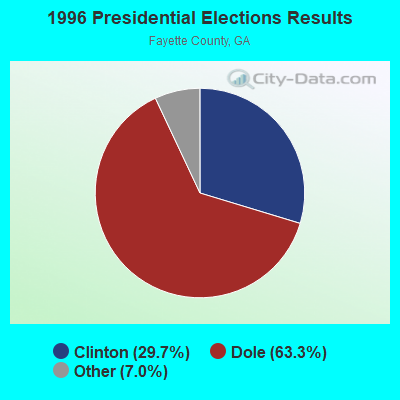

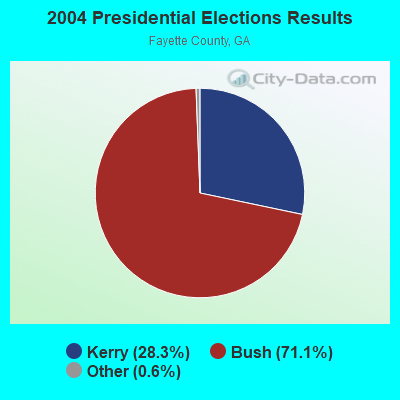

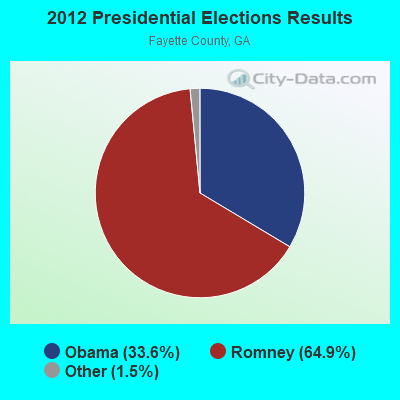
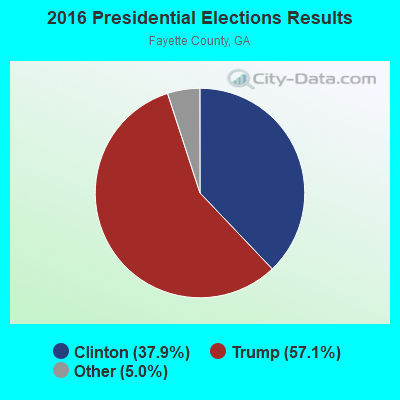
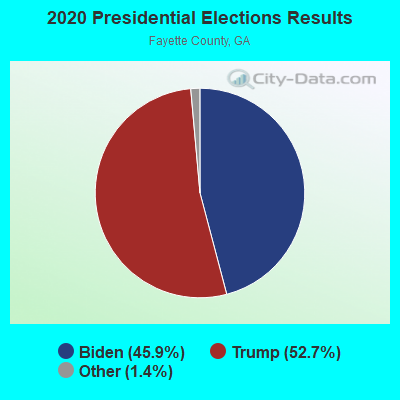
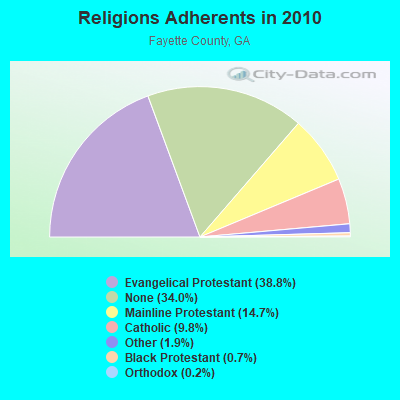
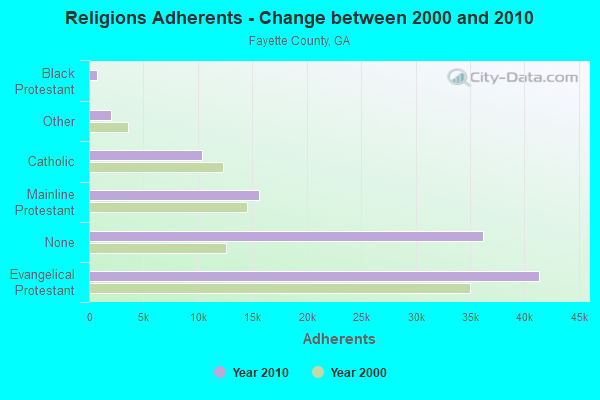
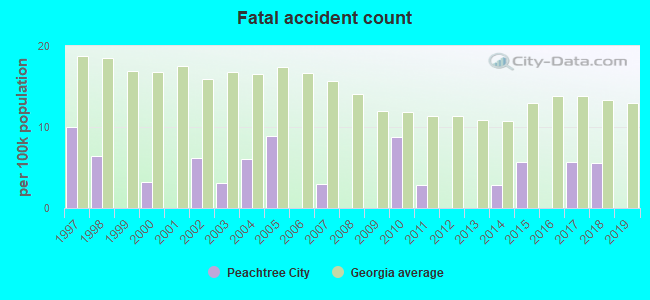
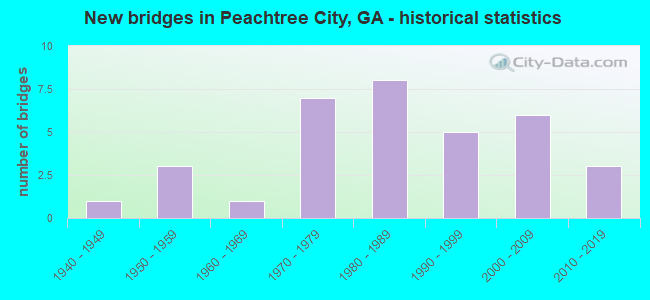
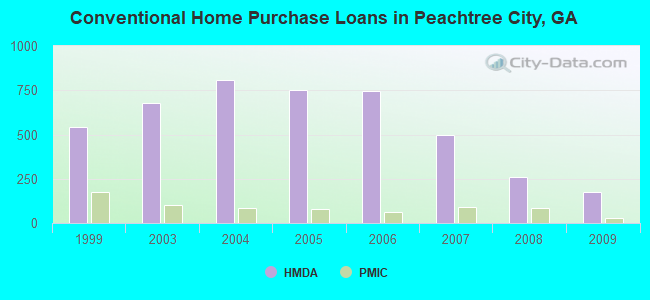
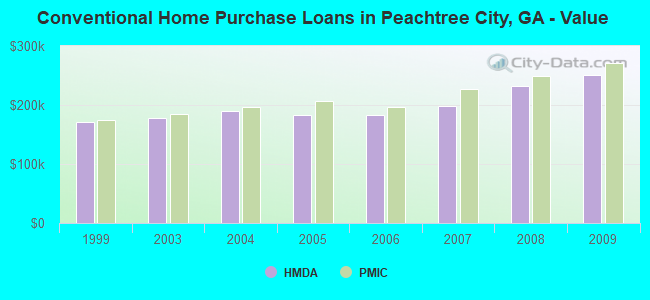
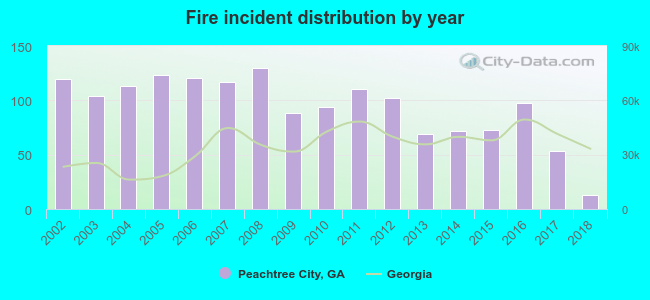 According to the data from the years 2002 - 2018 the average number of fires per year is 94. The highest number of reported fire incidents - 130 took place in 2008, and the least - 13 in 2018. The data has a decreasing trend.
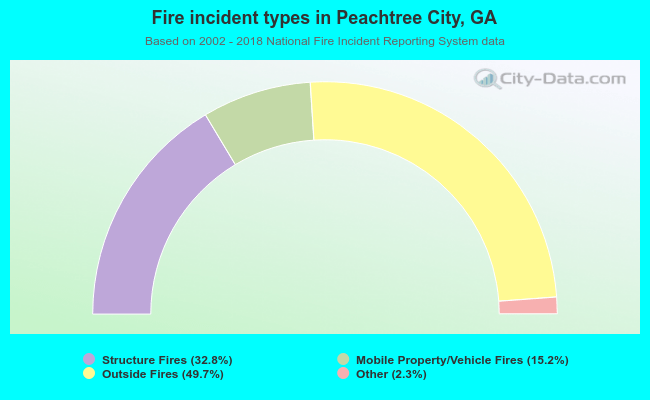 When looking into fire subcategories, the most incidents belonged to: Outside Fires (49.7%), and Structure Fires (32.8%).