Palo Pinto-Santo, Texas
Palo Pinto-Santo: Santo, TX Brazos, TX taken from Gene Edwards by Amy O'Bannon. Property is for sale www.santotxrealestate.com
- add
your
Submit your own pictures of this place and show them to the world
- OSM Map
- Google Map
- MSN Map
| Males: 1,687 | |
| Females: 1,542 |
| Median resident age: | 40.5 years |
| Texas median age: | 32.3 years |
Zip code: 76484
| Palo Pinto-Santo: | $77,182 |
| TX: | $72,284 |
Estimated per capita income in 2022: $34,360 (it was $16,385 in 2000)
Palo Pinto-Santo CCD income, earnings, and wages data
Estimated median house or condo value in 2022: $276,604 (it was $74,000 in 2000)
| Palo Pinto-Santo: | $276,604 |
| TX: | $275,400 |
Palo Pinto-Santo, TX residents, houses, and apartments details
Detailed information about poverty and poor residents in Palo Pinto-Santo, TX


- 2,91891.2%White alone
- 2016.3%Hispanic
- 371.2%Two or more races
- 190.6%American Indian alone
- 130.4%Black alone
- 100.3%Asian alone
- 10.03%Native Hawaiian and Other
Pacific Islander alone

Races in Palo Pinto-Santo detailed stats: ancestries, foreign born residents, place of birth
 Recent articles from our blog. Our writers, many of them Ph.D. graduates or candidates, create easy-to-read articles on a wide variety of topics.
Current Local Time: CST time zone
Land area: 284.1 square miles.
Population density: 11 people per square mile (very low).
| Palo Pinto-Santo CCD: | 0.9% ($649) |
| Texas: | 1.8% ($1,393) |
Nearest city with pop. 50,000+: Fort Worth, TX  (53.5 miles , pop. 534,694).
Nearest city with pop. 1,000,000+: Dallas, TX (85.6 miles , pop. 1,188,580).
Nearest cities:
), ), ), Latitude: 32.66 N, Longitude: 98.25 W

| Here: | 3.2% |
| Texas: | 3.5% |

- Educational services (10.3%)
- Construction (9.3%)
- Public administration (9.1%)
- Agriculture, forestry, fishing & hunting (6.9%)
- Accommodation & food services (5.9%)
- Professional, scientific, technical services (4.6%)
- Utilities (4.1%)

- Construction (14.2%)
- Agriculture, forestry, fishing & hunting (10.4%)
- Utilities (6.7%)
- Public administration (6.7%)
- Truck transportation (5.2%)
- Accommodation & food services (4.9%)
- Mining, quarrying, oil & gas extraction (4.0%)

- Educational services (19.2%)
- Public administration (12.6%)
- Health care (9.0%)
- Accommodation & food services (7.4%)
- Professional, scientific, technical services (5.4%)
- Finance & insurance (4.3%)
- Food & beverage stores (4.1%)

- Driver/sales workers and truck drivers (5.4%)
- Other management occupations, except farmers and farm managers (4.4%)
- Other production occupations, including supervisors (4.3%)
- Farmers and farm managers (4.0%)
- Other sales and related occupations, including supervisors (3.6%)
- Preschool, kindergarten, elementary, and middle school teachers (3.5%)
- Building and grounds cleaning and maintenance occupations (3.4%)

- Driver/sales workers and truck drivers (7.9%)
- Farmers and farm managers (6.6%)
- Other production occupations, including supervisors (5.6%)
- Other management occupations, except farmers and farm managers (5.1%)
- Agricultural workers, including supervisors (5.1%)
- Electrical equipment mechanics and other installation, maintenance, and repair workers, including supervisors (4.6%)
- Construction laborers (3.8%)

- Preschool, kindergarten, elementary, and middle school teachers (7.6%)
- Secretaries and administrative assistants (7.4%)
- Other office and administrative support workers, including supervisors (5.4%)
- Bookkeeping, accounting, and auditing clerks (5.2%)
- Cooks and food preparation workers (4.8%)
- Other sales and related occupations, including supervisors (4.7%)
- Building and grounds cleaning and maintenance occupations (3.8%)
Average climate in Palo Pinto-Santo, Texas
Based on data reported by over 4,000 weather stations


(lower is better)

Air Quality Index (AQI) level in 2022 was 78.1. This is about average.
| City: | 78.1 |
| U.S.: | 72.6 |

Nitrogen Dioxide (NO2) [ppb] level in 2011 was 3.13. This is significantly better than average. Closest monitor was 24.6 miles away from the city center.
| City: | 3.13 |
| U.S.: | 5.11 |

Ozone [ppb] level in 2022 was 35.1. This is about average. Closest monitor was 24.6 miles away from the city center.
| City: | 35.1 |
| U.S.: | 33.3 |
Tornado activity:
Palo Pinto-Santo-area historical tornado activity is slightly above Texas state average. It is 86% greater than the overall U.S. average.
On 4/25/1990, a category F4 (max. wind speeds 207-260 mph) tornado 25.7 miles away from the Palo Pinto-Santo place center caused between $500,000 and $5,000,000 in damages.
On 5/12/1982, a category F3 (max. wind speeds 158-206 mph) tornado 12.5 miles away from the place center injured 2 people and caused between $50,000 and $500,000 in damages.
Earthquake activity:
Palo Pinto-Santo-area historical earthquake activity is significantly above Texas state average. It is 446% greater than the overall U.S. average.On 11/6/2011 at 03:53:10, a magnitude 5.7 (5.7 MW, Depth: 3.2 mi, Class: Moderate, Intensity: VI - VII) earthquake occurred 216.0 miles away from Palo Pinto-Santo center
On 6/16/1978 at 11:46:54, a magnitude 5.3 (4.4 MB, 4.6 UK, 5.3 ML) earthquake occurred 148.5 miles away from Palo Pinto-Santo center
On 9/3/2016 at 12:02:44, a magnitude 5.8 (5.8 MW, Depth: 3.5 mi) earthquake occurred 271.0 miles away from the city center
On 4/14/1995 at 00:32:56, a magnitude 5.7 (5.6 MB, 5.7 MS, 5.7 MW, Depth: 11.1 mi) earthquake occurred 343.9 miles away from Palo Pinto-Santo center
On 11/7/2016 at 01:44:24, a magnitude 5.0 (5.0 MW, Depth: 2.8 mi) earthquake occurred 244.7 miles away from Palo Pinto-Santo center
On 2/13/2016 at 17:07:06, a magnitude 5.1 (5.1 MW, Depth: 5.2 mi) earthquake occurred 266.1 miles away from the city center
Magnitude types: body-wave magnitude (MB), local magnitude (ML), surface-wave magnitude (MS), moment magnitude (MW)
Natural disasters:
The number of natural disasters in Palo Pinto County (22) is greater than the US average (15).Major Disasters (Presidential) Declared: 9
Emergencies Declared: 6
Causes of natural disasters: Fires: 12, Storms: 6, Floods: 5, Hurricanes: 3, Tornadoes: 3, Wind: 1, Other: 1 (Note: some incidents may be assigned to more than one category).
Hospitals and medical centers near Palo Pinto-Santo:
- MINERAL WELLS CARE CENTER (Nursing Home, about 12 miles away; MINERAL WELLS, TX)
- MINERAL WELLS NURSING AND REHABILITATION LP (Nursing Home, about 12 miles away; MINERAL WELLS, TX)
- PALO PINTO NURSING CENTER (Nursing Home, about 12 miles away; MINERAL WELLS, TX)
- RESORT LODGE INC (Nursing Home, about 14 miles away; MINERAL WELLS, TX)
- NORTHWEST 23RD STREET (Hospital, about 14 miles away; MINERAL WELLS, TX)
- USRC MINERAL WELLS (Dialysis Facility, about 16 miles away; MINERAL WELLS, TX)
Colleges/universities with over 2000 students nearest to Palo Pinto-Santo:
- Weatherford College (about 28 miles; Weatherford, TX; Full-time enrollment: 4,080)
- Tarleton State University (about 31 miles; Stephenville, TX; FT enrollment: 8,882)
- Cisco College (about 47 miles; Cisco, TX; FT enrollment: 2,687)
- Texas Christian University (about 52 miles; Fort Worth, TX; FT enrollment: 9,131)
- Tarrant County College District (about 54 miles; Fort Worth, TX; FT enrollment: 33,775)
- The University of Texas at Arlington (about 67 miles; Arlington, TX; FT enrollment: 27,453)
- University of North Texas (about 75 miles; Denton, TX; FT enrollment: 31,694)
Points of interest:
Notable locations in Palo Pinto-Santo: Worth Ranch (A), Palo Pinto County Old Jail Museum (B), Santo Volunteer Fire and Emergency Medical Services (C), Palo Pinto Fire Department (D), Lone Camp Volunteer Fire Department and First Responders (E), Brazos Volunteer Fire Department (F), Lake Palo Pinto Volunteer Fire Department (G), Palo Pinto First Responders (H), Palo Pinto County Jail (I). Display/hide their locations on the map
Churches in Palo Pinto-Santo include: Pleasant Valley Church (A), Ward Mountain Church (B), Lone Camp Baptist Church (C), Live Oak Church (D). Display/hide their locations on the map
Cemeteries: Santo East Cemetery (1), Bosley Cemetery (2), Brannon Cemetery (3), Brierton Cemetery (4), New Hope Cemetery (5), Landreth Cemetery (6), Hittson Cemetery (7). Display/hide their locations on the map
Reservoirs: Henslee Lake Number 1 (A), Henslee Lake Number 2 (B), Le Wallen Lake Number 1 (C), Le Wallen Lake Number 2 (D), James Lake (E), Palo Pinto Creek Reservoir (F), Lawrence Porter Lake Number 2 (G), Lawrence Porter Lake Number 3 (H). Display/hide their locations on the map
Streams, rivers, and creeks: Worser Creek (A), Wolf Branch (B), Ward Branch (C), Town Branch (D), Saline Creek (E), Cantrell Creek (F), Rocky Bluff Creek (G), Rock Creek (H), Pollard Creek (I). Display/hide their locations on the map
| This place: | 2.5 people |
| Texas: | 2.8 people |
| This place: | 77.0% |
| Whole state: | 69.9% |
| This place: | 3.7% |
| Whole state: | 6.0% |
Likely homosexual households (counted as self-reported same-sex unmarried-partner households)
- Lesbian couples: 0.4% of all households
- Gay men: 0.1% of all households
| This place: | 7.8% |
| Whole state: | 15.4% |
| This place: | 2.8% |
| Whole state: | 6.7% |
106 people in local jails and other confinement facilities (including police lockups) in 2000
For population 15 years and over in Palo Pinto-Santo:

- Never married: 13.9%
- Now married: 70.9%
- Separated: 1.2%
- Widowed: 6.8%
- Divorced: 8.3%
For population 25 years and over in Palo Pinto-Santo:
- High school or higher: 79.5%
- Bachelor's degree or higher: 14.0%
- Graduate or professional degree: 2.5%
- Unemployed: 3.1%
- Mean travel time to work (commute): 32.5 minutes


| Here: | 10.3 |
| Texas average: | 15.6 |
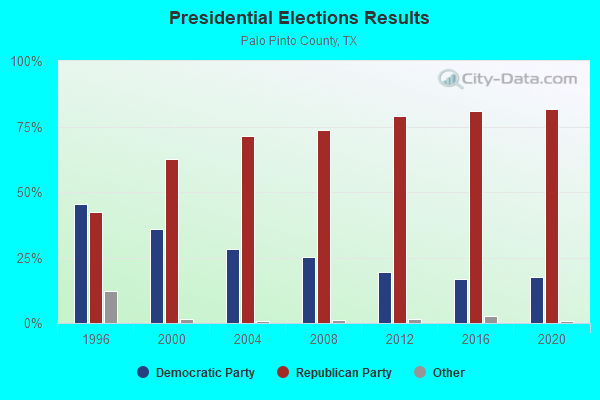
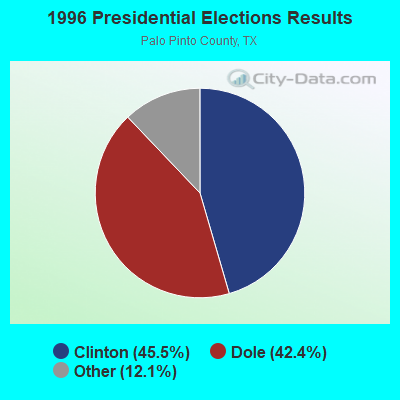
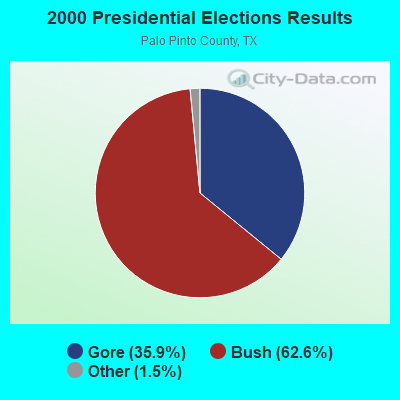
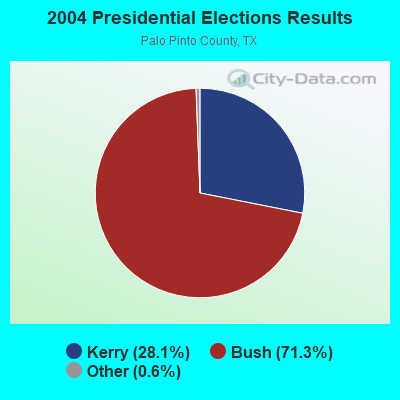
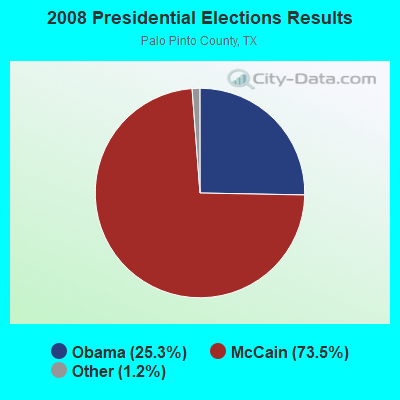
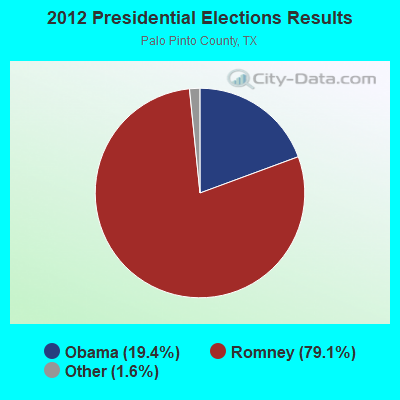
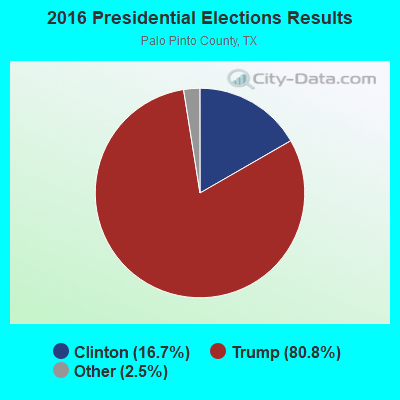
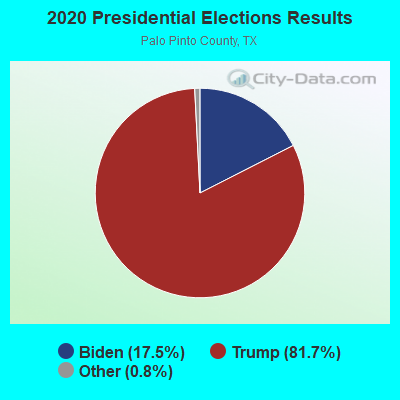
Graphs represent county-level data. Detailed 2008 Election Results
Religion statistics for Palo Pinto-Santo, TX (based on Palo Pinto County data)
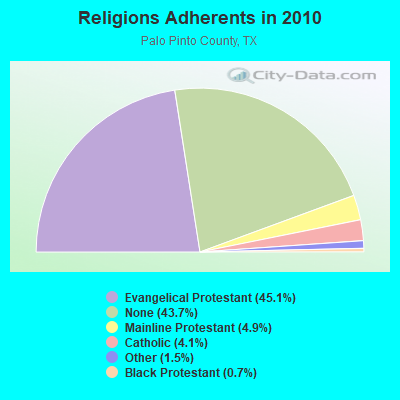
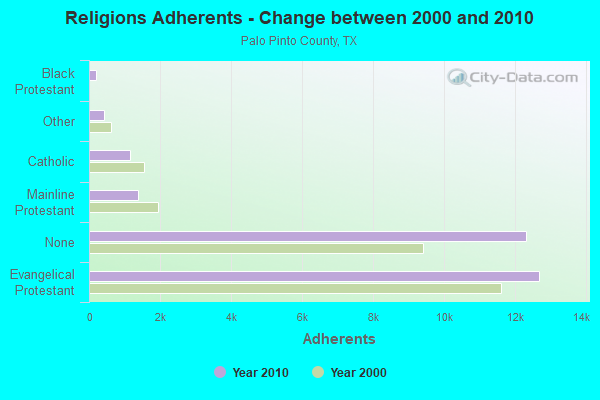
| Religion | Adherents | Congregations |
|---|---|---|
| Evangelical Protestant | 12,679 | 61 |
| Mainline Protestant | 1,376 | 10 |
| Catholic | 1,152 | 3 |
| Other | 429 | 3 |
| Black Protestant | 186 | 1 |
| None | 12,289 | - |
Food Environment Statistics:
| Palo Pinto County: | 2.93 / 10,000 pop. |
| State: | 1.47 / 10,000 pop. |
| Palo Pinto County: | 2.93 / 10,000 pop. |
| State: | 1.11 / 10,000 pop. |
| Palo Pinto County: | 7.33 / 10,000 pop. |
| Texas: | 3.95 / 10,000 pop. |
| Palo Pinto County: | 9.90 / 10,000 pop. |
| State: | 6.13 / 10,000 pop. |
| Palo Pinto County: | 9.2% |
| Texas: | 8.9% |
| Here: | 29.2% |
| State: | 26.6% |
| Palo Pinto County: | 18.7% |
| Texas: | 15.7% |
Strongest AM radio stations in Palo Pinto-Santo:
- KAHZ (1360 AM; 50 kW; HURST, TX)
- WBAP (820 AM; 50 kW; FORT WORTH, TX; Owner: WBAP-KSCS OPERATING, LTD.)
- KESS (1270 AM; 50 kW; FORT WORTH, TX; Owner: KESS-AM LICENSE CORP.)
- KZMP (1540 AM; 50 kW; UNIVERSITY PARK, TX; Owner: ENTRAVISION HOLDINGS, LLC)
- KRLD (1080 AM; 50 kW; DALLAS, TX; Owner: TEXAS INFINITY BROADCASTING L.P.)
- KFXR (1190 AM; 50 kW; DALLAS, TX; Owner: CLEAR CHANNEL BROADCASTING LICENSES, INC.)
- KBIS (1150 AM; 25 kW; HIGHLAND PARK, TX; Owner: DALLAS AM RADIO PARTNERS, L.P.)
- KSKY (660 AM; 20 kW; BALCH SPRINGS, TX; Owner: BISON MEDIA, INC.)
- KHVN (970 AM; 10 kW; FORT WORTH, TX; Owner: MORTENSON BROADCASTING COMPANY)
- KTNO (1440 AM; 12 kW; DENTON, TX; Owner: MORTENSON BROADCASTING COMPANY)
- KJSA (1120 AM; daytime; 0 kW; MINERAL WELLS, TX; Owner: JERRY SNYDER AND ASSOCIATES, INC.)
- KNAX (1630 AM; 10 kW; FT. WORTH, TX; Owner: MORTENSON BROADCASTING COMPANY)
- KKYX (680 AM; 50 kW; SAN ANTONIO, TX; Owner: CXR HOLDINGS, INC.)
Strongest FM radio stations in Palo Pinto-Santo:
- KFWR (95.9 FM; MINERAL WELLS, TX; Owner: LKCM RADIO GROUP, LP)
- KDXX (107.1 FM; BENBROOK, TX; Owner: KCYT-FM LICENSE CORP.)
- KTFW-FM (92.1 FM; GLEN ROSE, TX; Owner: M&M BROADCASTERS, LTD.)
- KYQX (89.5 FM; WEATHERFORD, TX; Owner: CSSI NON-PROFIT EDUCATIONAL BROADCASTING CORPORATION)
TV broadcast stations around Palo Pinto-Santo:
- KFWD (Channel 52; FORT WORTH, TX; Owner: HIC BROADCAST, INC.)

- 42.3%Electricity
- 42.2%Bottled, tank, or LP gas
- 12.5%Utility gas
- 2.4%Wood
- 0.3%No fuel used
- 0.2%Other fuel

- 46.4%Bottled, tank, or LP gas
- 27.6%Electricity
- 25.0%Utility gas
- 1.0%Other fuel
Palo Pinto-Santo compared to Texas state average:
- Unemployed percentage significantly below state average.
- Black race population percentage significantly below state average.
- Hispanic race population percentage significantly below state average.
- Median age significantly above state average.
- Foreign-born population percentage significantly below state average.
- Renting percentage significantly below state average.
- Length of stay since moving in significantly above state average.
- Number of rooms per house significantly below state average.
- House age significantly below state average.
- Number of college students below state average.
- Percentage of population with a bachelor's degree or higher below state average.