Oak Grove, South Carolina Submit your own pictures of this place and show them to the world
OSM Map
General Map
Google Map
MSN Map
OSM Map
General Map
Google Map
MSN Map
OSM Map
General Map
Google Map
MSN Map
OSM Map
General Map
Google Map
MSN Map
Please wait while loading the map...
Population in 2010: 10,291. Population change since 2000: +25.8%Males: 5,193 Females: 5,098
March 2022 cost of living index in Oak Grove: 86.8 (less than average, U.S. average is 100) Percentage of residents living in poverty in 2022: 11.9%for White Non-Hispanic residents , 20.0% for Black residents , 14.6% for Hispanic or Latino residents , 100.0% for American Indian residents , 16.6% for two or more races residents )Business Search - 14 Million verified businesses
Data:
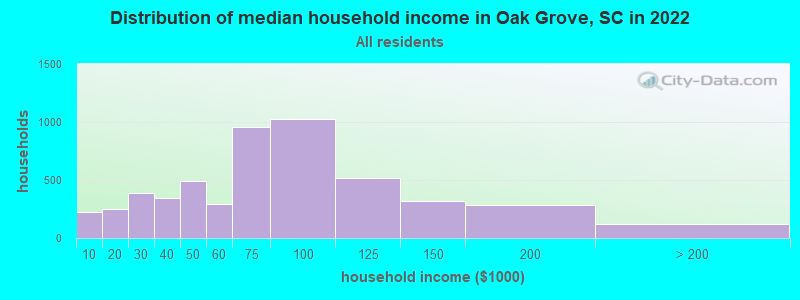
Median household income ($)
Median household income (% change since 2000)
Household income diversity
Ratio of average income to average house value (%)
Ratio of average income to average rent
Median household income ($) - White
Median household income ($) - Black or African American
Median household income ($) - Asian
Median household income ($) - Hispanic or Latino
Median household income ($) - American Indian and Alaska Native
Median household income ($) - Multirace
Median household income ($) - Other Race
Median household income for houses/condos with a mortgage ($)
Median household income for apartments without a mortgage ($)
Races - White alone (%)
Races - White alone (% change since 2000)
Races - Black alone (%)
Races - Black alone (% change since 2000)
Races - American Indian alone (%)
Races - American Indian alone (% change since 2000)
Races - Asian alone (%)
Races - Asian alone (% change since 2000)
Races - Hispanic (%)
Races - Hispanic (% change since 2000)
Races - Native Hawaiian and Other Pacific Islander alone (%)
Races - Native Hawaiian and Other Pacific Islander alone (% change since 2000)
Races - Two or more races (%)
Races - Two or more races (% change since 2000)
Races - Other race alone (%)
Races - Other race alone (% change since 2000)
Racial diversity
Unemployment (%)
Unemployment (% change since 2000)
Unemployment (%) - White
Unemployment (%) - Black or African American
Unemployment (%) - Asian
Unemployment (%) - Hispanic or Latino
Unemployment (%) - American Indian and Alaska Native
Unemployment (%) - Multirace
Unemployment (%) - Other Race
Population density (people per square mile)
Population - Males (%)
Population - Females (%)
Population - Males (%) - White
Population - Males (%) - Black or African American
Population - Males (%) - Asian
Population - Males (%) - Hispanic or Latino
Population - Males (%) - American Indian and Alaska Native
Population - Males (%) - Multirace
Population - Males (%) - Other Race
Population - Females (%) - White
Population - Females (%) - Black or African American
Population - Females (%) - Asian
Population - Females (%) - Hispanic or Latino
Population - Females (%) - American Indian and Alaska Native
Population - Females (%) - Multirace
Population - Females (%) - Other Race
Coronavirus confirmed cases (May 07, 2024)
Deaths caused by coronavirus (May 07, 2024)
Coronavirus confirmed cases (per 100k population) (May 07, 2024)
Deaths caused by coronavirus (per 100k population) (May 07, 2024)
Daily increase in number of cases (May 07, 2024)
Weekly increase in number of cases (May 07, 2024)
Cases doubled (in days) (May 07, 2024)
Hospitalized patients (Apr 18, 2022)
Negative test results (Apr 18, 2022)
Total test results (Apr 18, 2022)
COVID Vaccine doses distributed (per 100k population) (Sep 19, 2023)
COVID Vaccine doses administered (per 100k population) (Sep 19, 2023)
COVID Vaccine doses distributed (Sep 19, 2023)
COVID Vaccine doses administered (Sep 19, 2023)
Likely homosexual households (%)
Likely homosexual households (% change since 2000)
Likely homosexual households - Lesbian couples (%)
Likely homosexual households - Lesbian couples (% change since 2000)
Likely homosexual households - Gay men (%)
Likely homosexual households - Gay men (% change since 2000)
Cost of living index
Median gross rent ($)
Median contract rent ($)
Median monthly housing costs ($)
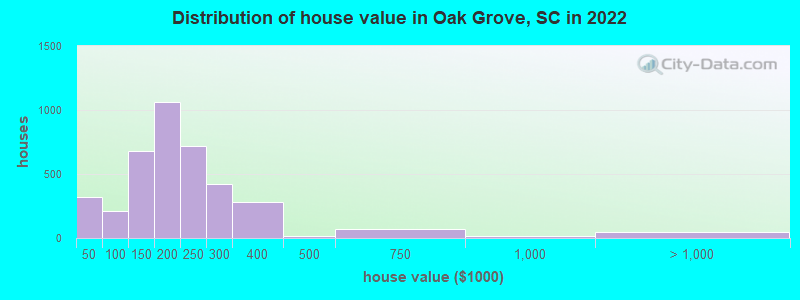
Median house or condo value ($)
Median house or condo value ($ change since 2000)
Mean house or condo value by units in structure - 1, detached ($)
Mean house or condo value by units in structure - 1, attached ($)
Mean house or condo value by units in structure - 2 ($)
Mean house or condo value by units in structure by units in structure - 3 or 4 ($)
Mean house or condo value by units in structure - 5 or more ($)
Mean house or condo value by units in structure - Boat, RV, van, etc. ($)
Mean house or condo value by units in structure - Mobile home ($)
Median house or condo value ($) - White
Median house or condo value ($) - Black or African American
Median house or condo value ($) - Asian
Median house or condo value ($) - Hispanic or Latino
Median house or condo value ($) - American Indian and Alaska Native
Median house or condo value ($) - Multirace
Median house or condo value ($) - Other Race
Median resident age
Resident age diversity
Median resident age - Males
Median resident age - Females
Median resident age - White
Median resident age - Black or African American
Median resident age - Asian
Median resident age - Hispanic or Latino
Median resident age - American Indian and Alaska Native
Median resident age - Multirace
Median resident age - Other Race
Median resident age - Males - White
Median resident age - Males - Black or African American
Median resident age - Males - Asian
Median resident age - Males - Hispanic or Latino
Median resident age - Males - American Indian and Alaska Native
Median resident age - Males - Multirace
Median resident age - Males - Other Race
Median resident age - Females - White
Median resident age - Females - Black or African American
Median resident age - Females - Asian
Median resident age - Females - Hispanic or Latino
Median resident age - Females - American Indian and Alaska Native
Median resident age - Females - Multirace
Median resident age - Females - Other Race
Commute - mean travel time to work (minutes)
Travel time to work - Less than 5 minutes (%)
Travel time to work - Less than 5 minutes (% change since 2000)
Travel time to work - 5 to 9 minutes (%)
Travel time to work - 5 to 9 minutes (% change since 2000)
Travel time to work - 10 to 19 minutes (%)
Travel time to work - 10 to 19 minutes (% change since 2000)
Travel time to work - 20 to 29 minutes (%)
Travel time to work - 20 to 29 minutes (% change since 2000)
Travel time to work - 30 to 39 minutes (%)
Travel time to work - 30 to 39 minutes (% change since 2000)
Travel time to work - 40 to 59 minutes (%)
Travel time to work - 40 to 59 minutes (% change since 2000)
Travel time to work - 60 to 89 minutes (%)
Travel time to work - 60 to 89 minutes (% change since 2000)
Travel time to work - 90 or more minutes (%)
Travel time to work - 90 or more minutes (% change since 2000)
Marital status - Never married (%)
Marital status - Now married (%)
Marital status - Separated (%)
Marital status - Widowed (%)
Marital status - Divorced (%)
Median family income ($)
Median family income (% change since 2000)
Median non-family income ($)
Median non-family income (% change since 2000)
Median per capita income ($)
Median per capita income (% change since 2000)
Median family income ($) - White
Median family income ($) - Black or African American
Median family income ($) - Asian
Median family income ($) - Hispanic or Latino
Median family income ($) - American Indian and Alaska Native
Median family income ($) - Multirace
Median family income ($) - Other Race
Median year house/condo built
Median year apartment built
Year house built - Built 2005 or later (%)
Year house built - Built 2000 to 2004 (%)
Year house built - Built 1990 to 1999 (%)
Year house built - Built 1980 to 1989 (%)
Year house built - Built 1970 to 1979 (%)
Year house built - Built 1960 to 1969 (%)
Year house built - Built 1950 to 1959 (%)
Year house built - Built 1940 to 1949 (%)
Year house built - Built 1939 or earlier (%)
Average household size
Household density (households per square mile)
Average household size - White
Average household size - Black or African American
Average household size - Asian
Average household size - Hispanic or Latino
Average household size - American Indian and Alaska Native
Average household size - Multirace
Average household size - Other Race
Occupied housing units (%)
Vacant housing units (%)
Owner occupied housing units (%)
Renter occupied housing units (%)
Vacancy status - For rent (%)
Vacancy status - For sale only (%)
Vacancy status - Rented or sold, not occupied (%)
Vacancy status - For seasonal, recreational, or occasional use (%)
Vacancy status - For migrant workers (%)
Vacancy status - Other vacant (%)
Residents with income below the poverty level (%)
Residents with income below 50% of the poverty level (%)
Children below poverty level (%)
Poor families by family type - Married-couple family (%)
Poor families by family type - Male, no wife present (%)
Poor families by family type - Female, no husband present (%)
Poverty status for native-born residents (%)
Poverty status for foreign-born residents (%)
Poverty among high school graduates not in families (%)
Poverty among people who did not graduate high school not in families (%)
Residents with income below the poverty level (%) - White
Residents with income below the poverty level (%) - Black or African American
Residents with income below the poverty level (%) - Asian
Residents with income below the poverty level (%) - Hispanic or Latino
Residents with income below the poverty level (%) - American Indian and Alaska Native
Residents with income below the poverty level (%) - Multirace
Residents with income below the poverty level (%) - Other Race
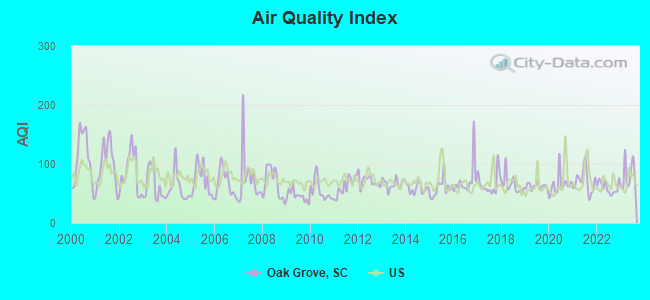
Air pollution - Air Quality Index (AQI)
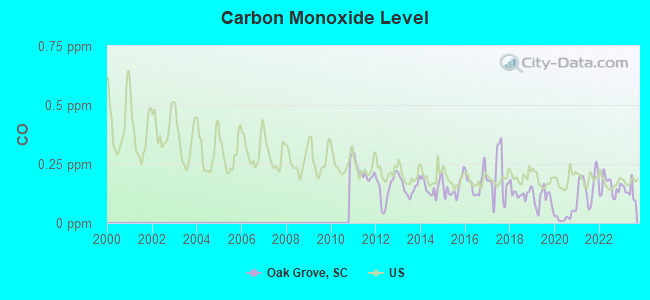
Air pollution - CO
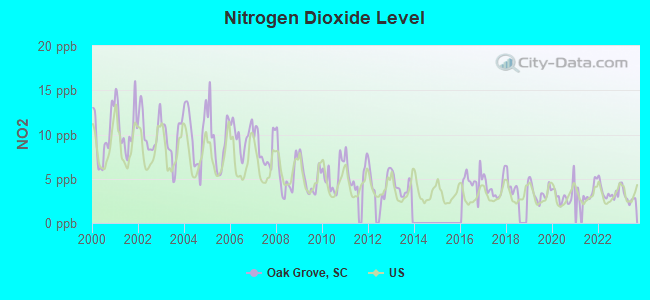
Air pollution - NO2
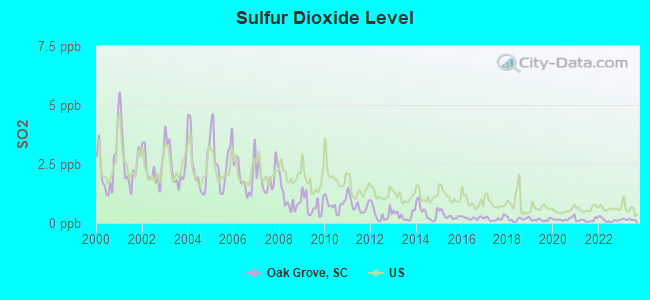
Air pollution - SO2
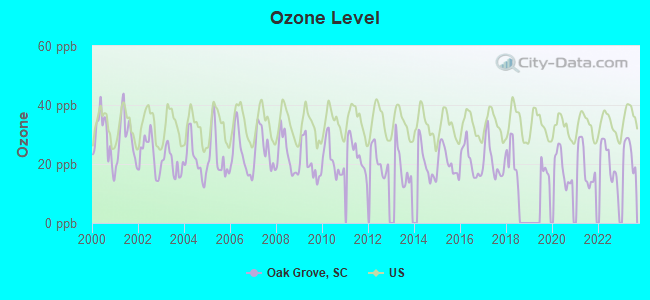
Air pollution - Ozone
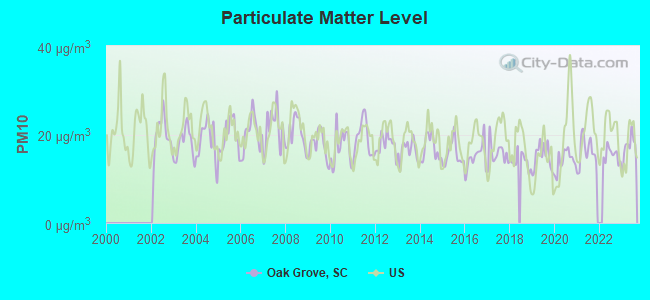
Air pollution - PM10
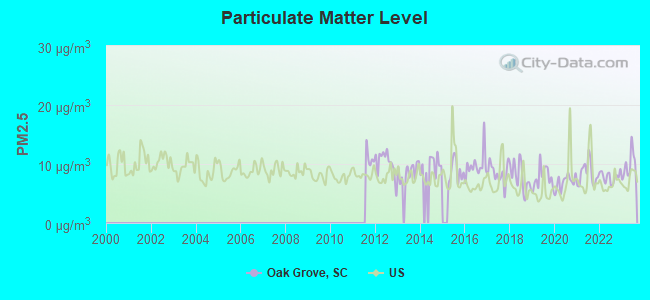
Air pollution - PM25
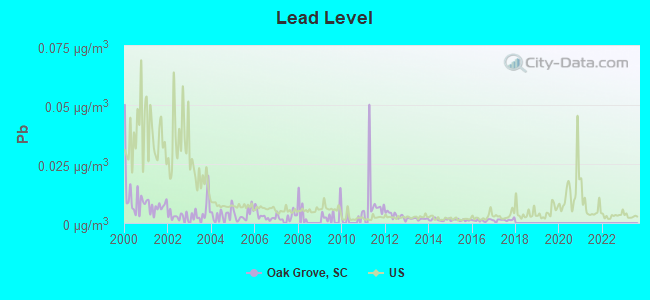
Air pollution - Pb
Crime - Murders per 100,000 population
Crime - Rapes per 100,000 population
Crime - Robberies per 100,000 population
Crime - Assaults per 100,000 population
Crime - Burglaries per 100,000 population
Crime - Thefts per 100,000 population
Crime - Auto thefts per 100,000 population
Crime - Arson per 100,000 population
Crime - City-data.com crime index
Crime - Violent crime index
Crime - Property crime index
Crime - Murders per 100,000 population (5 year average)
Crime - Rapes per 100,000 population (5 year average)
Crime - Robberies per 100,000 population (5 year average)
Crime - Assaults per 100,000 population (5 year average)
Crime - Burglaries per 100,000 population (5 year average)
Crime - Thefts per 100,000 population (5 year average)
Crime - Auto thefts per 100,000 population (5 year average)
Crime - Arson per 100,000 population (5 year average)
Crime - City-data.com crime index (5 year average)
Crime - Violent crime index (5 year average)
Crime - Property crime index (5 year average)
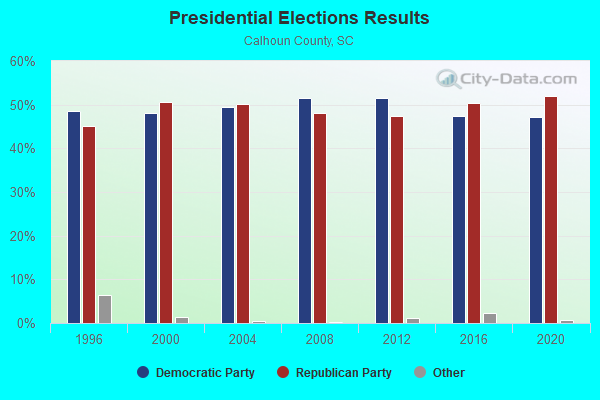
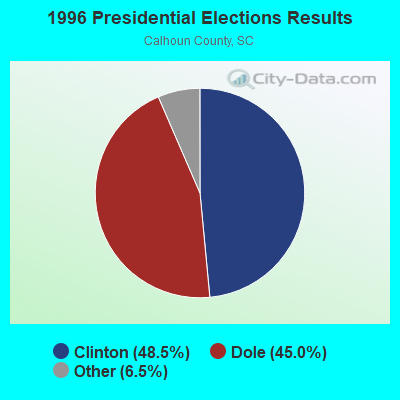
1996 Presidential Elections Results (%) - Democratic Party (Clinton)
1996 Presidential Elections Results (%) - Republican Party (Dole)
1996 Presidential Elections Results (%) - Other
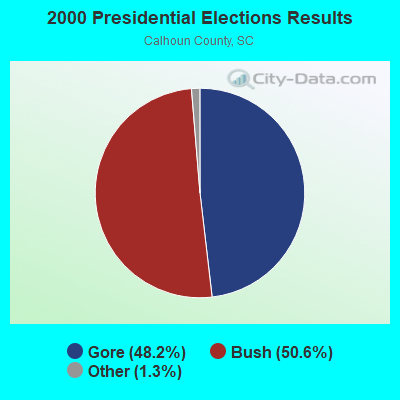
2000 Presidential Elections Results (%) - Democratic Party (Gore)
2000 Presidential Elections Results (%) - Republican Party (Bush)
2000 Presidential Elections Results (%) - Other
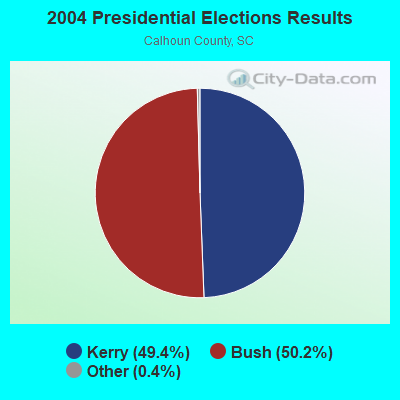
2004 Presidential Elections Results (%) - Democratic Party (Kerry)
2004 Presidential Elections Results (%) - Republican Party (Bush)
2004 Presidential Elections Results (%) - Other
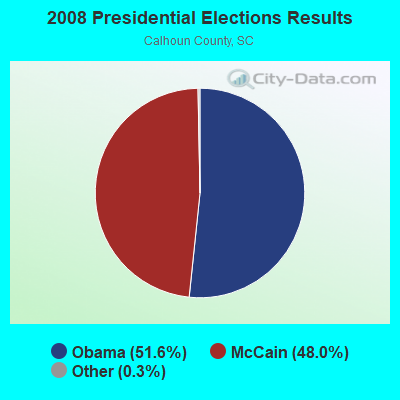
2008 Presidential Elections Results (%) - Democratic Party (Obama)
2008 Presidential Elections Results (%) - Republican Party (McCain)
2008 Presidential Elections Results (%) - Other
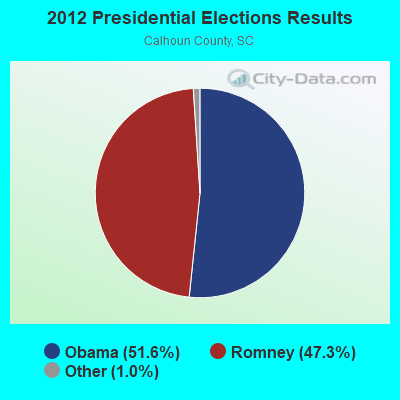
2012 Presidential Elections Results (%) - Democratic Party (Obama)
2012 Presidential Elections Results (%) - Republican Party (Romney)
2012 Presidential Elections Results (%) - Other
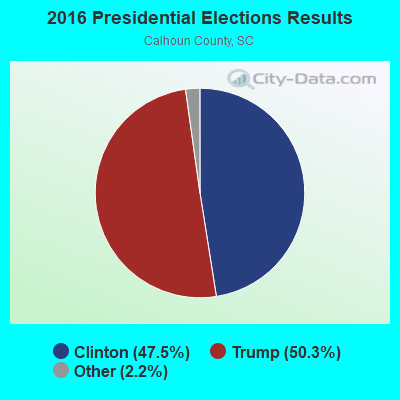
2016 Presidential Elections Results (%) - Democratic Party (Clinton)
2016 Presidential Elections Results (%) - Republican Party (Trump)
2016 Presidential Elections Results (%) - Other
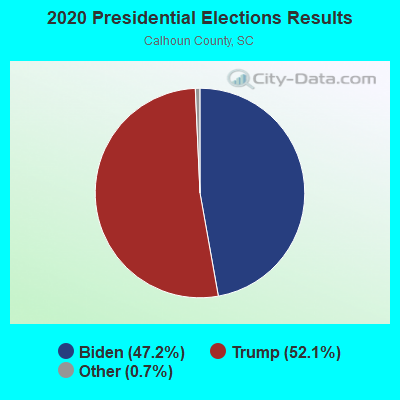
2020 Presidential Elections Results (%) - Democratic Party (Biden)
2020 Presidential Elections Results (%) - Republican Party (Trump)
2020 Presidential Elections Results (%) - Other
Ancestries Reported - Arab (%)
Ancestries Reported - Czech (%)
Ancestries Reported - Danish (%)
Ancestries Reported - Dutch (%)
Ancestries Reported - English (%)
Ancestries Reported - French (%)
Ancestries Reported - French Canadian (%)
Ancestries Reported - German (%)
Ancestries Reported - Greek (%)
Ancestries Reported - Hungarian (%)
Ancestries Reported - Irish (%)
Ancestries Reported - Italian (%)
Ancestries Reported - Lithuanian (%)
Ancestries Reported - Norwegian (%)
Ancestries Reported - Polish (%)
Ancestries Reported - Portuguese (%)
Ancestries Reported - Russian (%)
Ancestries Reported - Scotch-Irish (%)
Ancestries Reported - Scottish (%)
Ancestries Reported - Slovak (%)
Ancestries Reported - Subsaharan African (%)
Ancestries Reported - Swedish (%)
Ancestries Reported - Swiss (%)
Ancestries Reported - Ukrainian (%)
Ancestries Reported - United States (%)
Ancestries Reported - Welsh (%)
Ancestries Reported - West Indian (%)
Ancestries Reported - Other (%)
Educational Attainment - No schooling completed (%)
Educational Attainment - Less than high school (%)
Educational Attainment - High school or equivalent (%)
Educational Attainment - Less than 1 year of college (%)
Educational Attainment - 1 or more years of college (%)
Educational Attainment - Associate degree (%)
Educational Attainment - Bachelor's degree (%)
Educational Attainment - Master's degree (%)
Educational Attainment - Professional school degree (%)
Educational Attainment - Doctorate degree (%)
School Enrollment - Nursery, preschool (%)
School Enrollment - Kindergarten (%)
School Enrollment - Grade 1 to 4 (%)
School Enrollment - Grade 5 to 8 (%)
School Enrollment - Grade 9 to 12 (%)
School Enrollment - College undergrad (%)
School Enrollment - Graduate or professional (%)
School Enrollment - Not enrolled in school (%)
School enrollment - Public schools (%)
School enrollment - Private schools (%)
School enrollment - Not enrolled (%)
Median number of rooms in houses and condos
Median number of rooms in apartments
Housing units lacking complete plumbing facilities (%)
Housing units lacking complete kitchen facilities (%)
Density of houses
Urban houses (%)
Rural houses (%)
Households with people 60 years and over (%)
Households with people 65 years and over (%)
Households with people 75 years and over (%)
Households with one or more nonrelatives (%)
Households with no nonrelatives (%)
Population in households (%)
Family households (%)
Nonfamily households (%)
Population in families (%)
Family households with own children (%)
Median number of bedrooms in owner occupied houses
Mean number of bedrooms in owner occupied houses
Median number of bedrooms in renter occupied houses
Mean number of bedrooms in renter occupied houses
Median number of vehichles in owner occupied houses
Mean number of vehichles in owner occupied houses
Median number of vehichles in renter occupied houses
Mean number of vehichles in renter occupied houses
Mortgage status - with mortgage (%)
Mortgage status - with second mortgage (%)
Mortgage status - with home equity loan (%)
Mortgage status - with both second mortgage and home equity loan (%)
Mortgage status - without a mortgage (%)
Average family size
Average family size - White
Average family size - Black or African American
Average family size - Asian
Average family size - Hispanic or Latino
Average family size - American Indian and Alaska Native
Average family size - Multirace
Average family size - Other Race
Geographical mobility - Same house 1 year ago (%)
Geographical mobility - Moved within same county (%)
Geographical mobility - Moved from different county within same state (%)
Geographical mobility - Moved from different state (%)
Geographical mobility - Moved from abroad (%)
Place of birth - Born in state of residence (%)
Place of birth - Born in other state (%)
Place of birth - Native, outside of US (%)
Place of birth - Foreign born (%)
Housing units in structures - 1, detached (%)
Housing units in structures - 1, attached (%)
Housing units in structures - 2 (%)
Housing units in structures - 3 or 4 (%)
Housing units in structures - 5 to 9 (%)
Housing units in structures - 10 to 19 (%)
Housing units in structures - 20 to 49 (%)
Housing units in structures - 50 or more (%)
Housing units in structures - Mobile home (%)
Housing units in structures - Boat, RV, van, etc. (%)
House/condo owner moved in on average (years ago)
Renter moved in on average (years ago)
Year householder moved into unit - Moved in 1999 to March 2000 (%)
Year householder moved into unit - Moved in 1995 to 1998 (%)
Year householder moved into unit - Moved in 1990 to 1994 (%)
Year householder moved into unit - Moved in 1980 to 1989 (%)
Year householder moved into unit - Moved in 1970 to 1979 (%)
Year householder moved into unit - Moved in 1969 or earlier (%)
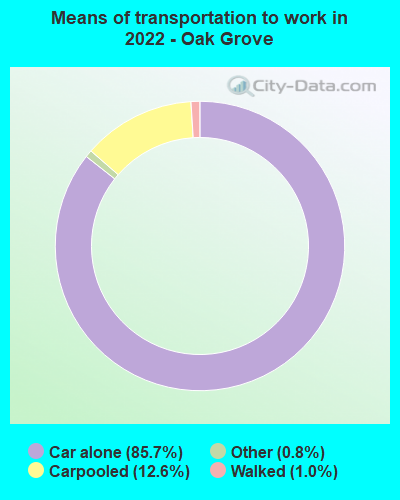
Means of transportation to work - Drove car alone (%)
Means of transportation to work - Carpooled (%)
Means of transportation to work - Public transportation (%)
Means of transportation to work - Bus or trolley bus (%)
Means of transportation to work - Streetcar or trolley car (%)
Means of transportation to work - Subway or elevated (%)
Means of transportation to work - Railroad (%)
Means of transportation to work - Ferryboat (%)
Means of transportation to work - Taxicab (%)
Means of transportation to work - Motorcycle (%)
Means of transportation to work - Bicycle (%)
Means of transportation to work - Walked (%)
Means of transportation to work - Other means (%)
Working at home (%)
Industry diversity
Most Common Industries - Agriculture, forestry, fishing and hunting, and mining (%)
Most Common Industries - Agriculture, forestry, fishing and hunting (%)
Most Common Industries - Mining, quarrying, and oil and gas extraction (%)
Most Common Industries - Construction (%)
Most Common Industries - Manufacturing (%)
Most Common Industries - Wholesale trade (%)
Most Common Industries - Retail trade (%)
Most Common Industries - Transportation and warehousing, and utilities (%)
Most Common Industries - Transportation and warehousing (%)
Most Common Industries - Utilities (%)
Most Common Industries - Information (%)
Most Common Industries - Finance and insurance, and real estate and rental and leasing (%)
Most Common Industries - Finance and insurance (%)
Most Common Industries - Real estate and rental and leasing (%)
Most Common Industries - Professional, scientific, and management, and administrative and waste management services (%)
Most Common Industries - Professional, scientific, and technical services (%)
Most Common Industries - Management of companies and enterprises (%)
Most Common Industries - Administrative and support and waste management services (%)
Most Common Industries - Educational services, and health care and social assistance (%)
Most Common Industries - Educational services (%)
Most Common Industries - Health care and social assistance (%)
Most Common Industries - Arts, entertainment, and recreation, and accommodation and food services (%)
Most Common Industries - Arts, entertainment, and recreation (%)
Most Common Industries - Accommodation and food services (%)
Most Common Industries - Other services, except public administration (%)
Most Common Industries - Public administration (%)
Occupation diversity
Most Common Occupations - Management, business, science, and arts occupations (%)
Most Common Occupations - Management, business, and financial occupations (%)
Most Common Occupations - Management occupations (%)
Most Common Occupations - Business and financial operations occupations (%)
Most Common Occupations - Computer, engineering, and science occupations (%)
Most Common Occupations - Computer and mathematical occupations (%)
Most Common Occupations - Architecture and engineering occupations (%)
Most Common Occupations - Life, physical, and social science occupations (%)
Most Common Occupations - Education, legal, community service, arts, and media occupations (%)
Most Common Occupations - Community and social service occupations (%)
Most Common Occupations - Legal occupations (%)
Most Common Occupations - Education, training, and library occupations (%)
Most Common Occupations - Arts, design, entertainment, sports, and media occupations (%)
Most Common Occupations - Healthcare practitioners and technical occupations (%)
Most Common Occupations - Health diagnosing and treating practitioners and other technical occupations (%)
Most Common Occupations - Health technologists and technicians (%)
Most Common Occupations - Service occupations (%)
Most Common Occupations - Healthcare support occupations (%)
Most Common Occupations - Protective service occupations (%)
Most Common Occupations - Fire fighting and prevention, and other protective service workers including supervisors (%)
Most Common Occupations - Law enforcement workers including supervisors (%)
Most Common Occupations - Food preparation and serving related occupations (%)
Most Common Occupations - Building and grounds cleaning and maintenance occupations (%)
Most Common Occupations - Personal care and service occupations (%)
Most Common Occupations - Sales and office occupations (%)
Most Common Occupations - Sales and related occupations (%)
Most Common Occupations - Office and administrative support occupations (%)
Most Common Occupations - Natural resources, construction, and maintenance occupations (%)
Most Common Occupations - Farming, fishing, and forestry occupations (%)
Most Common Occupations - Construction and extraction occupations (%)
Most Common Occupations - Installation, maintenance, and repair occupations (%)
Most Common Occupations - Production, transportation, and material moving occupations (%)
Most Common Occupations - Production occupations (%)
Most Common Occupations - Transportation occupations (%)
Most Common Occupations - Material moving occupations (%)
People in Group quarters - Institutionalized population (%)
People in Group quarters - Correctional institutions (%)
People in Group quarters - Federal prisons and detention centers (%)
People in Group quarters - Halfway houses (%)
People in Group quarters - Local jails and other confinement facilities (including police lockups) (%)
People in Group quarters - Military disciplinary barracks (%)
People in Group quarters - State prisons (%)
People in Group quarters - Other types of correctional institutions (%)
People in Group quarters - Nursing homes (%)
People in Group quarters - Hospitals/wards, hospices, and schools for the handicapped (%)
People in Group quarters - Hospitals/wards and hospices for chronically ill (%)
People in Group quarters - Hospices or homes for chronically ill (%)
People in Group quarters - Military hospitals or wards for chronically ill (%)
People in Group quarters - Other hospitals or wards for chronically ill (%)
People in Group quarters - Hospitals or wards for drug/alcohol abuse (%)
People in Group quarters - Mental (Psychiatric) hospitals or wards (%)
People in Group quarters - Schools, hospitals, or wards for the mentally retarded (%)
People in Group quarters - Schools, hospitals, or wards for the physically handicapped (%)
People in Group quarters - Institutions for the deaf (%)
People in Group quarters - Institutions for the blind (%)
People in Group quarters - Orthopedic wards and institutions for the physically handicapped (%)
People in Group quarters - Wards in general hospitals for patients who have no usual home elsewhere (%)
People in Group quarters - Wards in military hospitals for patients who have no usual home elsewhere (%)
People in Group quarters - Juvenile institutions (%)
People in Group quarters - Long-term care (%)
People in Group quarters - Homes for abused, dependent, and neglected children (%)
People in Group quarters - Residential treatment centers for emotionally disturbed children (%)
People in Group quarters - Training schools for juvenile delinquents (%)
People in Group quarters - Short-term care, detention or diagnostic centers for delinquent children (%)
People in Group quarters - Type of juvenile institution unknown (%)
People in Group quarters - Noninstitutionalized population (%)
People in Group quarters - College dormitories (includes college quarters off campus) (%)
People in Group quarters - Military quarters (%)
People in Group quarters - On base (%)
People in Group quarters - Barracks, unaccompanied personnel housing (UPH), (Enlisted/Officer), ;and similar group living quarters for military personnel (%)
People in Group quarters - Transient quarters for temporary residents (%)
People in Group quarters - Military ships (%)
People in Group quarters - Group homes (%)
People in Group quarters - Homes or halfway houses for drug/alcohol abuse (%)
People in Group quarters - Homes for the mentally ill (%)
People in Group quarters - Homes for the mentally retarded (%)
People in Group quarters - Homes for the physically handicapped (%)
People in Group quarters - Other group homes (%)
People in Group quarters - Religious group quarters (%)
People in Group quarters - Dormitories (%)
People in Group quarters - Agriculture workers' dormitories on farms (%)
People in Group quarters - Job Corps and vocational training facilities (%)
People in Group quarters - Other workers' dormitories (%)
People in Group quarters - Crews of maritime vessels (%)
People in Group quarters - Other nonhousehold living situations (%)
People in Group quarters - Other noninstitutional group quarters (%)
Residents speaking English at home (%)
Residents speaking English at home - Born in the United States (%)
Residents speaking English at home - Native, born elsewhere (%)
Residents speaking English at home - Foreign born (%)
Residents speaking Spanish at home (%)
Residents speaking Spanish at home - Born in the United States (%)
Residents speaking Spanish at home - Native, born elsewhere (%)
Residents speaking Spanish at home - Foreign born (%)
Residents speaking other language at home (%)
Residents speaking other language at home - Born in the United States (%)
Residents speaking other language at home - Native, born elsewhere (%)
Residents speaking other language at home - Foreign born (%)
Class of Workers - Employee of private company (%)
Class of Workers - Self-employed in own incorporated business (%)
Class of Workers - Private not-for-profit wage and salary workers (%)
Class of Workers - Local government workers (%)
Class of Workers - State government workers (%)
Class of Workers - Federal government workers (%)
Class of Workers - Self-employed workers in own not incorporated business and Unpaid family workers (%)
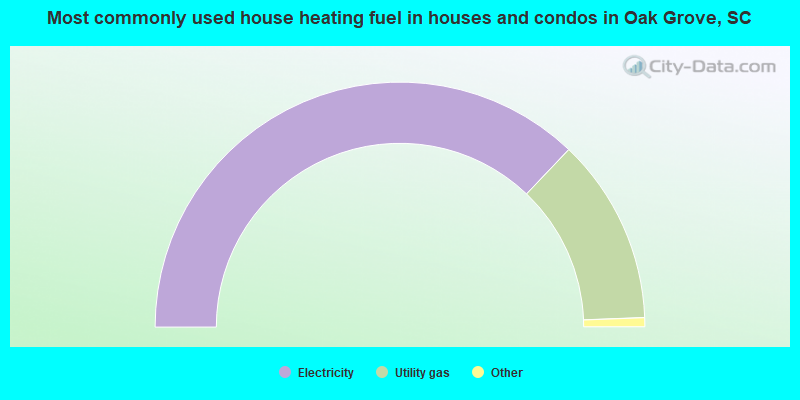
House heating fuel used in houses and condos - Utility gas (%)
House heating fuel used in houses and condos - Bottled, tank, or LP gas (%)
House heating fuel used in houses and condos - Electricity (%)
House heating fuel used in houses and condos - Fuel oil, kerosene, etc. (%)
House heating fuel used in houses and condos - Coal or coke (%)
House heating fuel used in houses and condos - Wood (%)
House heating fuel used in houses and condos - Solar energy (%)
House heating fuel used in houses and condos - Other fuel (%)
House heating fuel used in houses and condos - No fuel used (%)
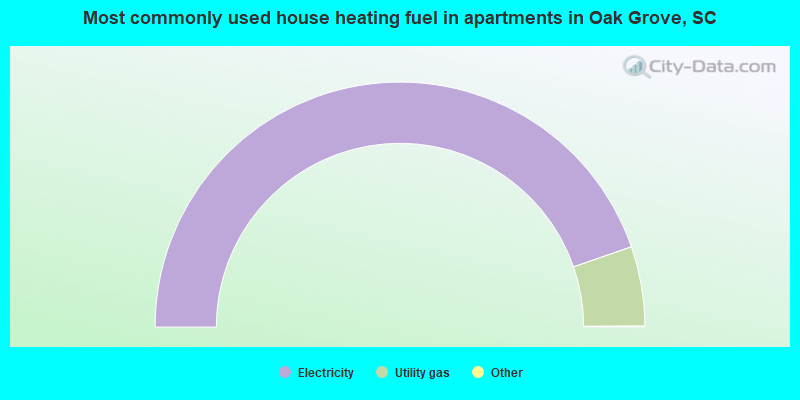
House heating fuel used in apartments - Utility gas (%)
House heating fuel used in apartments - Bottled, tank, or LP gas (%)
House heating fuel used in apartments - Electricity (%)
House heating fuel used in apartments - Fuel oil, kerosene, etc. (%)
House heating fuel used in apartments - Coal or coke (%)
House heating fuel used in apartments - Wood (%)
House heating fuel used in apartments - Solar energy (%)
House heating fuel used in apartments - Other fuel (%)
House heating fuel used in apartments - No fuel used (%)
Armed forces status - In Armed Forces (%)
Armed forces status - Civilian (%)
Armed forces status - Civilian - Veteran (%)
Armed forces status - Civilian - Nonveteran (%)
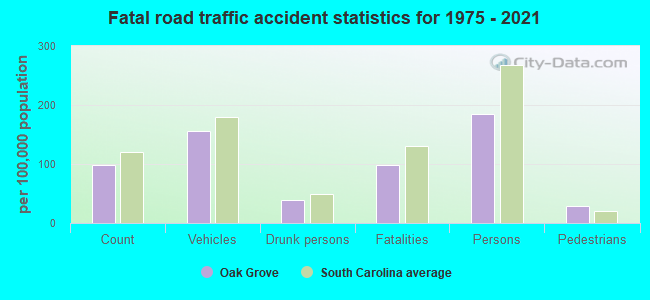
Fatal accidents locations in years 2005-2021
Fatal accidents locations in 2005
Fatal accidents locations in 2006
Fatal accidents locations in 2007
Fatal accidents locations in 2008
Fatal accidents locations in 2009
Fatal accidents locations in 2010
Fatal accidents locations in 2011
Fatal accidents locations in 2012
Fatal accidents locations in 2013
Fatal accidents locations in 2014
Fatal accidents locations in 2015
Fatal accidents locations in 2016
Fatal accidents locations in 2017
Fatal accidents locations in 2018
Fatal accidents locations in 2019
Fatal accidents locations in 2020
Fatal accidents locations in 2021
Alcohol use - People drinking some alcohol every month (%)
Alcohol use - People not drinking at all (%)
Alcohol use - Average days/month drinking alcohol
Alcohol use - Average drinks/week
Alcohol use - Average days/year people drink much
Audiometry - Average condition of hearing (%)
Audiometry - People that can hear a whisper from across a quiet room (%)
Audiometry - People that can hear normal voice from across a quiet room (%)
Audiometry - Ears ringing, roaring, buzzing (%)
Audiometry - Had a job exposure to loud noise (%)
Audiometry - Had off-work exposure to loud noise (%)
Blood Pressure & Cholesterol - Has high blood pressure (%)
Blood Pressure & Cholesterol - Checking blood pressure at home (%)
Blood Pressure & Cholesterol - Frequently checking blood cholesterol (%)
Blood Pressure & Cholesterol - Has high cholesterol level (%)
Consumer Behavior - Money monthly spent on food at supermarket/grocery store
Consumer Behavior - Money monthly spent on food at other stores
Consumer Behavior - Money monthly spent on eating out
Consumer Behavior - Money monthly spent on carryout/delivered foods
Consumer Behavior - Income spent on food at supermarket/grocery store (%)
Consumer Behavior - Income spent on food at other stores (%)
Consumer Behavior - Income spent on eating out (%)
Consumer Behavior - Income spent on carryout/delivered foods (%)
Current Health Status - General health condition (%)
Current Health Status - Blood donors (%)
Current Health Status - Has blood ever tested for HIV virus (%)
Current Health Status - Left-handed people (%)
Dermatology - People using sunscreen (%)
Diabetes - Diabetics (%)
Diabetes - Had a blood test for high blood sugar (%)
Diabetes - People taking insulin (%)
Diet Behavior & Nutrition - Diet health (%)
Diet Behavior & Nutrition - Milk product consumption (# of products/month)
Diet Behavior & Nutrition - Meals not home prepared (#/week)
Diet Behavior & Nutrition - Meals from fast food or pizza place (#/week)
Diet Behavior & Nutrition - Ready-to-eat foods (#/month)
Diet Behavior & Nutrition - Frozen meals/pizza (#/month)
Drug Use - People that ever used marijuana or hashish (%)
Drug Use - Ever used hard drugs (%)
Drug Use - Ever used any form of cocaine (%)
Drug Use - Ever used heroin (%)
Drug Use - Ever used methamphetamine (%)
Health Insurance - People covered by health insurance (%)
Kidney Conditions-Urology - Avg. # of times urinating at night
Medical Conditions - People with asthma (%)
Medical Conditions - People with anemia (%)
Medical Conditions - People with psoriasis (%)
Medical Conditions - People with overweight (%)
Medical Conditions - Elderly people having difficulties in thinking or remembering (%)
Medical Conditions - People who ever received blood transfusion (%)
Medical Conditions - People having trouble seeing even with glass/contacts (%)
Medical Conditions - People with arthritis (%)
Medical Conditions - People with gout (%)
Medical Conditions - People with congestive heart failure (%)
Medical Conditions - People with coronary heart disease (%)
Medical Conditions - People with angina pectoris (%)
Medical Conditions - People who ever had heart attack (%)
Medical Conditions - People who ever had stroke (%)
Medical Conditions - People with emphysema (%)
Medical Conditions - People with thyroid problem (%)
Medical Conditions - People with chronic bronchitis (%)
Medical Conditions - People with any liver condition (%)
Medical Conditions - People who ever had cancer or malignancy (%)
Mental Health - People who have little interest in doing things (%)
Mental Health - People feeling down, depressed, or hopeless (%)
Mental Health - People who have trouble sleeping or sleeping too much (%)
Mental Health - People feeling tired or having little energy (%)
Mental Health - People with poor appetite or overeating (%)
Mental Health - People feeling bad about themself (%)
Mental Health - People who have trouble concentrating on things (%)
Mental Health - People moving or speaking slowly or too fast (%)
Mental Health - People having thoughts they would be better off dead (%)
Oral Health - Average years since last visit a dentist
Oral Health - People embarrassed because of mouth (%)
Oral Health - People with gum disease (%)
Oral Health - General health of teeth and gums (%)
Oral Health - Average days a week using dental floss/device
Oral Health - Average days a week using mouthwash for dental problem
Oral Health - Average number of teeth
Pesticide Use - Households using pesticides to control insects (%)
Pesticide Use - Households using pesticides to kill weeds (%)
Physical Activity - People doing vigorous-intensity work activities (%)
Physical Activity - People doing moderate-intensity work activities (%)
Physical Activity - People walking or bicycling (%)
Physical Activity - People doing vigorous-intensity recreational activities (%)
Physical Activity - People doing moderate-intensity recreational activities (%)
Physical Activity - Average hours a day doing sedentary activities
Physical Activity - Average hours a day watching TV or videos
Physical Activity - Average hours a day using computer
Physical Functioning - People having limitations keeping them from working (%)
Physical Functioning - People limited in amount of work they can do (%)
Physical Functioning - People that need special equipment to walk (%)
Physical Functioning - People experiencing confusion/memory problems (%)
Physical Functioning - People requiring special healthcare equipment (%)
Prescription Medications - Average number of prescription medicines taking
Preventive Aspirin Use - Adults 40+ taking low-dose aspirin (%)
Reproductive Health - Vaginal deliveries (%)
Reproductive Health - Cesarean deliveries (%)
Reproductive Health - Deliveries resulted in a live birth (%)
Reproductive Health - Pregnancies resulted in a delivery (%)
Reproductive Health - Women breastfeeding newborns (%)
Reproductive Health - Women that had a hysterectomy (%)
Reproductive Health - Women that had both ovaries removed (%)
Reproductive Health - Women that have ever taken birth control pills (%)
Reproductive Health - Women taking birth control pills (%)
Reproductive Health - Women that have ever used Depo-Provera or injectables (%)
Reproductive Health - Women that have ever used female hormones (%)
Sexual Behavior - People 18+ that ever had sex (vaginal, anal, or oral) (%)
Sexual Behavior - Males 18+ that ever had vaginal sex with a woman (%)
Sexual Behavior - Males 18+ that ever performed oral sex on a woman (%)
Sexual Behavior - Males 18+ that ever had anal sex with a woman (%)
Sexual Behavior - Males 18+ that ever had any sex with a man (%)
Sexual Behavior - Females 18+ that ever had vaginal sex with a man (%)
Sexual Behavior - Females 18+ that ever performed oral sex on a man (%)
Sexual Behavior - Females 18+ that ever had anal sex with a man (%)
Sexual Behavior - Females 18+ that ever had any kind of sex with a woman (%)
Sexual Behavior - Average age people first had sex
Sexual Behavior - Average number of female sex partners in lifetime (males 18+)
Sexual Behavior - Average number of female vaginal sex partners in lifetime (males 18+)
Sexual Behavior - Average age people first performed oral sex on a woman (18+)
Sexual Behavior - Average number of woman performed oral sex on in lifetime (18+)
Sexual Behavior - Average number of male sex partners in lifetime (males 18+)
Sexual Behavior - Average number of male anal sex partners in lifetime (males 18+)
Sexual Behavior - Average age people first performed oral sex on a man (18+)
Sexual Behavior - Average number of male oral sex partners in lifetime (18+)
Sexual Behavior - People using protection when performing oral sex (%)
Sexual Behavior - Average number of times people have vaginal or anal sex a year
Sexual Behavior - People having sex without condom (%)
Sexual Behavior - Average number of male sex partners in lifetime (females 18+)
Sexual Behavior - Average number of male vaginal sex partners in lifetime (females 18+)
Sexual Behavior - Average number of female sex partners in lifetime (females 18+)
Sexual Behavior - Circumcised males 18+ (%)
Sleep Disorders - Average hours sleeping at night
Sleep Disorders - People that has trouble sleeping (%)
Smoking-Cigarette Use - People smoking cigarettes (%)
Taste & Smell - People 40+ having problems with smell (%)
Taste & Smell - People 40+ having problems with taste (%)
Taste & Smell - People 40+ that ever had wisdom teeth removed (%)
Taste & Smell - People 40+ that ever had tonsils teeth removed (%)
Taste & Smell - People 40+ that ever had a loss of consciousness because of a head injury (%)
Taste & Smell - People 40+ that ever had a broken nose or other serious injury to face or skull (%)
Taste & Smell - People 40+ that ever had two or more sinus infections (%)
Weight - Average height (inches)
Weight - Average weight (pounds)
Weight - Average BMI
Weight - People that are obese (%)
Weight - People that ever were obese (%)
Weight - People trying to lose weight (%)
Latest news from Oak Grove, SC collected exclusively by city-data.com from local newspapers, TV, and radio stations
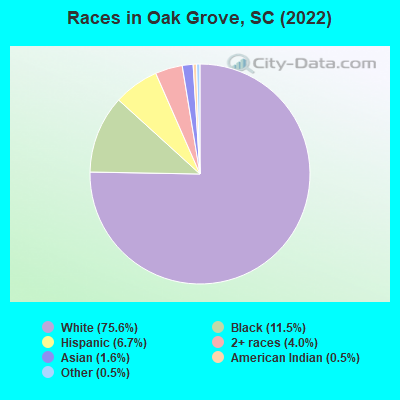
Ancestries: American (15.6%), English (9.6%), German (8.3%), Irish (5.8%), Scotch-Irish (3.6%), European (3.6%).
Current Local Time:
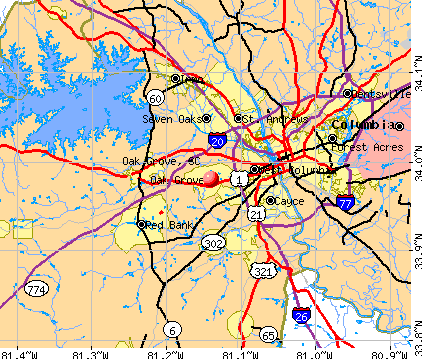
Land area: 6.74 square miles.
Population density: 1,527 people per square mile (low).
469 residents are foreign born (2.0% Latin America , 1.3% Asia , 0.5% Europe ).
This place:
4.0%South Carolina:
5.3%
Median real estate property taxes paid for housing units with mortgages in 2022: $1,005 (0.5%)Median real estate property taxes paid for housing units with no mortgage in 2022: $687 (0.4%)
Nearest city with pop. 50,000+: Dutch Fork, SC
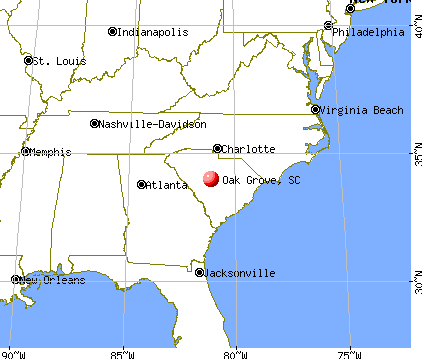
Nearest city with pop. 200,000+: Charlotte, NC
Nearest city with pop. 1,000,000+: Philadelphia, PA
Nearest cities:
Latitude: 33.98 N, Longitude: 81.14 W
Daytime population change due to commuting: -3,636 (-31.1%)Workers who live and work in this place: 866 (14.4%)
Area code commonly used in this area: 803
Unemployment in December 2023: Here:
3.2%South Carolina:
3.1%
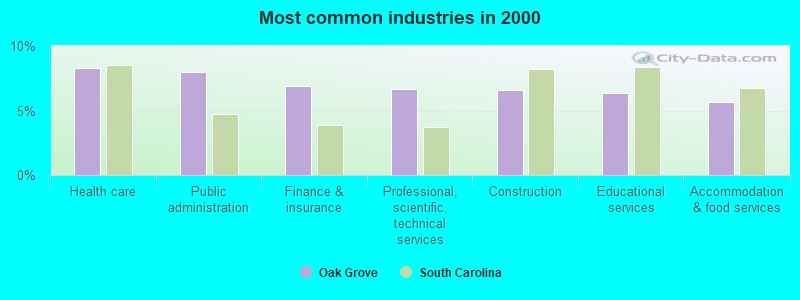
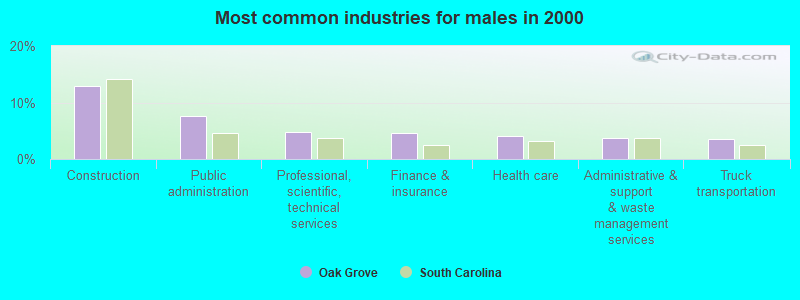
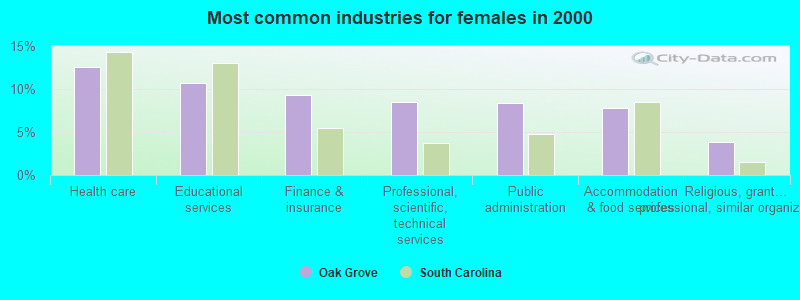
Most common industries in Oak Grove, SC (%)
Both Males Females
Health care (8.3%)
Public administration (8.0%)
Finance & insurance (6.9%)
Professional, scientific, technical services (6.6%)
Construction (6.6%)
Educational services (6.3%)
Accommodation & food services (5.7%)
Construction (12.8%)
Public administration (7.6%)
Professional, scientific, technical services (4.8%)
Finance & insurance (4.5%)
Health care (4.1%)
Administrative & support & waste management services (3.7%)
Truck transportation (3.6%)
Health care (12.5%)
Educational services (10.7%)
Finance & insurance (9.3%)
Professional, scientific, technical services (8.4%)
Public administration (8.4%)
Accommodation & food services (7.7%)
Religious, grantmaking, civic, professional, similar organizations (3.8%)
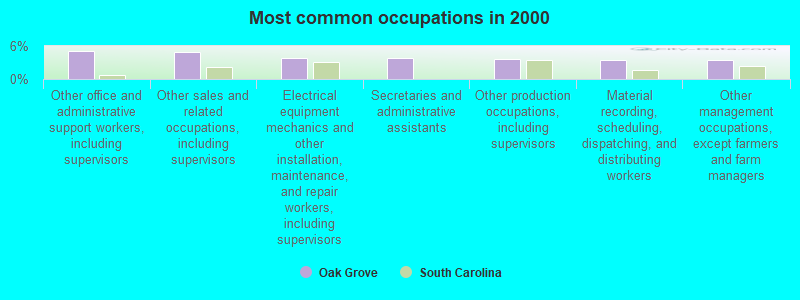
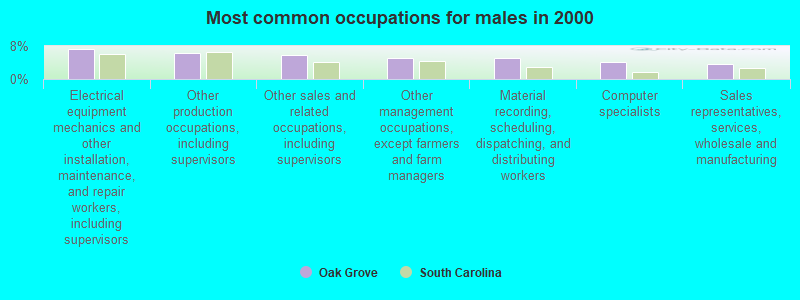
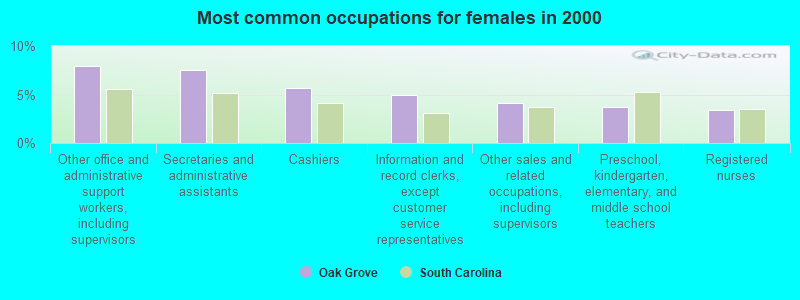
Most common occupations in Oak Grove, SC (%)
Both Males Females
Other office and administrative support workers, including supervisors (5.1%)
Other sales and related occupations, including supervisors (5.0%)
Electrical equipment mechanics and other installation, maintenance, and repair workers, including supervisors (3.9%)
Secretaries and administrative assistants (3.8%)
Other production occupations, including supervisors (3.6%)
Material recording, scheduling, dispatching, and distributing workers (3.5%)
Other management occupations, except farmers and farm managers (3.5%)
Electrical equipment mechanics and other installation, maintenance, and repair workers, including supervisors (7.4%)
Other production occupations, including supervisors (6.3%)
Other sales and related occupations, including supervisors (5.8%)
Other management occupations, except farmers and farm managers (5.0%)
Material recording, scheduling, dispatching, and distributing workers (5.0%)
Computer specialists (4.0%)
Sales representatives, services, wholesale and manufacturing (3.7%)
Other office and administrative support workers, including supervisors (7.9%)
Secretaries and administrative assistants (7.5%)
Cashiers (5.7%)
Information and record clerks, except customer service representatives (4.9%)
Other sales and related occupations, including supervisors (4.2%)
Preschool, kindergarten, elementary, and middle school teachers (3.7%)
Registered nurses (3.4%)
Tornado activity:
Oak Grove-area historical tornado activity is slightly above South Carolina state average. It is 31% greater than the overall U.S. average.
On 3/28/1984, a category F4 (max. wind speeds 207-260 mph) tornado 28.9 miles away from the Oak Grove place center killed 5 people and injured 49 people and caused between $5,000,000 and $50,000,000 in damages.
On 8/16/1994, a category F3 (max. wind speeds 158-206 mph) tornado 6.2 miles away from the place center injured 40 people and caused between $5,000,000 and $50,000,000 in damages.
Earthquake activity:
Oak Grove-area historical earthquake activity is significantly above South Carolina state average. It is 24% smaller than the overall U.S. average. On 8/2/1974 at 08:52:09, a magnitude 4.9 (4.3 MB, 4.9 LG, Class: Light, Intensity: IV - V) earthquake occurred 77.7 miles away from Oak Grove center On 8/9/2020 at 12:07:37, a magnitude 5.1 (5.1 MW, Depth: 4.7 mi, Class: Moderate, Intensity: VI - VII) earthquake occurred 172.6 miles away from the city center On 11/22/1974 at 05:25:55, a magnitude 4.7 (4.7 MB) earthquake occurred 94.2 miles away from Oak Grove center On 8/23/2011 at 17:51:04, a magnitude 5.8 (5.8 MW, Depth: 3.7 mi) earthquake occurred 325.6 miles away from Oak Grove center On 8/21/1992 at 16:31:55, a magnitude 4.4 (4.1 MB, 4.1 LG, 4.4 LG, Depth: 6.2 mi) earthquake occurred 87.3 miles away from the city center On 2/15/2014 at 03:23:38, a magnitude 4.1 (4.1 MW, Depth: 3.2 mi) earthquake occurred 55.8 miles away from the city center Magnitude types: regional Lg-wave magnitude (LG), body-wave magnitude (MB), moment magnitude (MW) Natural disasters: The number of natural disasters in Calhoun County (18) is near the US average (15).Major Disasters (Presidential) Declared: 9Emergencies Declared: 6Hurricanes: 8, Floods: 3, Storms: 3, Winter Storms: 3, Drought: 1, Ice Storm: 1, Tropical Storm: 1, Other: 1 (Note: some incidents may be assigned to more than one category). Hospitals and medical centers near Oak Grove: AGAPE NURSING AND REHAB CENTER (Nursing Home, about 2 miles away; WEST COLUMBIA, SC)
ADVANTAGE HOSPICE AND HOME CARE (Hospital, about 2 miles away; WEST COLUMBIA, SC)
HEARTLAND HOSPICE SERVICES - THE MIDLANDS (Hospital, about 3 miles away; WEST COLUMBIA, SC)
NHC HEALTHCARE - LEXINGTON (Nursing Home, about 3 miles away; WEST COLUMBIA, SC)
THREE RIVERS BEHAVIORAL HEALTHCARE LLC (Hospital, about 3 miles away; WEST COLUMBIA, SC)
LEXINGTON MEDICAL CENTER (about 3 miles away; WEST COLUMBIA, SC)
NHC HOME CARE MIDLANDS (Home Health Center, about 3 miles away; WEST COLUMBIA, SC)
Amtrak station near Oak Grove: 6 miles: COLUMBIA (850 PULASKI ST.) Services: ticket office, fully wheelchair accessible, enclosed waiting area, public restrooms, public payphones, vending machines, free short-term parking, free long-term parking, call for car rental service, taxi stand.
Colleges/universities with over 2000 students nearest to Oak Grove:
Midlands Technical College (about 3 miles; West Columbia, SC ; Full-time enrollment: 8,916)
University of South Carolina-Columbia (about 7 miles; Columbia, SC ; FT enrollment: 27,789)
Benedict College (about 8 miles; Columbia, SC ; FT enrollment: 3,039)
Orangeburg Calhoun Technical College (about 36 miles; Orangeburg, SC ; FT enrollment: 2,113)
South Carolina State University (about 38 miles; Orangeburg, SC ; FT enrollment: 3,481)
Central Carolina Technical College (about 45 miles; Sumter, SC ; FT enrollment: 3,108)
University of South Carolina-Aiken (about 46 miles; Aiken, SC ; FT enrollment: 2,815)
Calhoun County has a predicted average indoor radon screening level less than 2 pCi/L (pico curies per liter) - Low Potential Average household size: This place:
2.5 peopleSouth Carolina:
2.5 people
Percentage of family households: This place:
65.6%Whole state:
67.5%
Percentage of households with unmarried partners: This place:
6.5%Whole state:
6.0%
Likely homosexual households (counted as self-reported same-sex unmarried-partner households)
Lesbian couples: 0.3% of all households Gay men: 0.3% of all households
People in group quarters in Oak Grove in 2010:
52 people in residential treatment centers for juveniles (non-correctional)
10 people in workers' group living quarters and job corps centers
4 people in residential treatment centers for adults
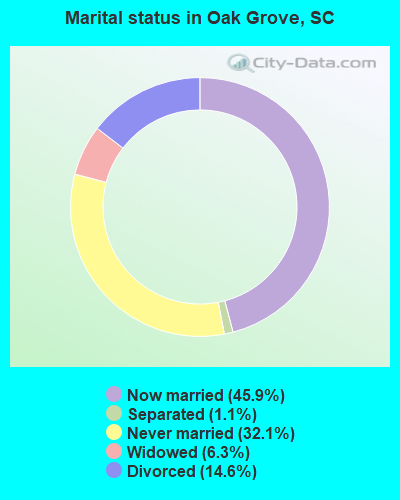
For population 15 years and over in Oak Grove:
Never married: 32.1%Now married: 45.9%Separated: 1.1%Widowed: 6.3%Divorced: 14.6% For population 25 years and over in Oak Grove:
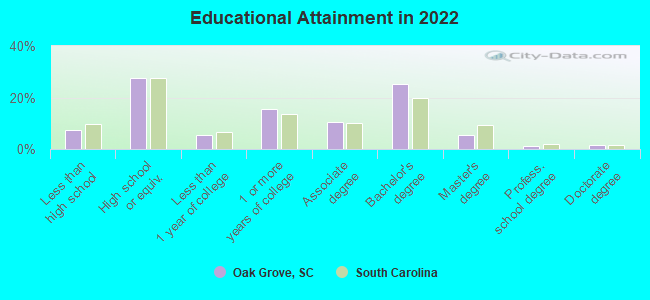
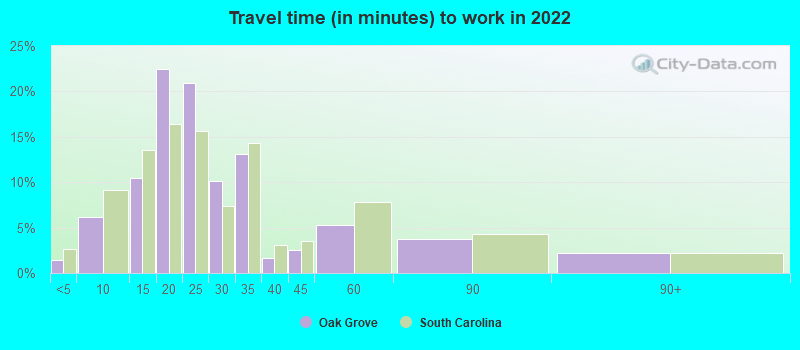
High school or higher: 91.7%Bachelor's degree or higher: 31.6%Graduate or professional degree: 7.5%Unemployed: 4.0%Mean travel time to work (commute): 19.0 minutes
Education Gini index (Inequality in education) Here:
9.5South Carolina average:
11.1
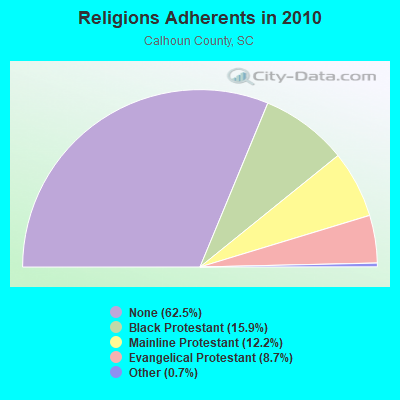
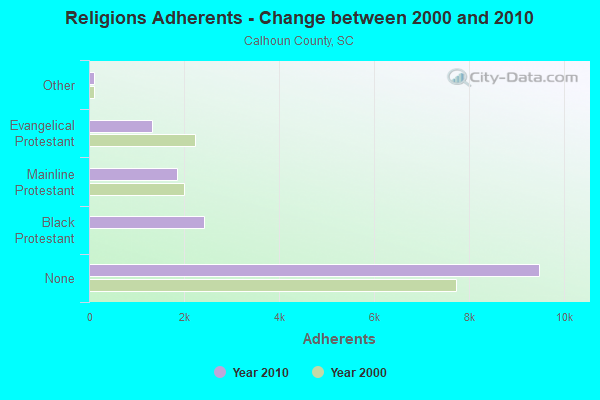
Religion statistics for Oak Grove, SC (based on Calhoun County data)
Religion Adherents Congregations Black Protestant 2,411 15 Mainline Protestant 1,857 14 Evangelical Protestant 1,318 11 Other 106 1 Catholic - - None 9,483 -
Source: Clifford Grammich, Kirk Hadaway, Richard Houseal, Dale E.Jones, Alexei Krindatch, Richie Stanley and Richard H.Taylor. 2012. 2010 U.S.Religion Census: Religious Congregations & Membership Study. Association of Statisticians of American Religious Bodies. Jones, Dale E., et al. 2002. Congregations and Membership in the United States 2000. Nashville, TN: Glenmary Research Center. Graphs represent county-level data
Food Environment Statistics: Number of grocery stores : 1This county :
0.68 / 10,000 pop.State :
1.99 / 10,000 pop.
Number of convenience stores (no gas) : 1This county :
0.68 / 10,000 pop.South Carolina :
0.85 / 10,000 pop.
Number of convenience stores (with gas) : 13Calhoun County :
8.82 / 10,000 pop.South Carolina :
5.38 / 10,000 pop.
Number of full-service restaurants : 2This county :
1.36 / 10,000 pop.South Carolina :
7.75 / 10,000 pop.
Adult diabetes rate : This county :
13.0%South Carolina :
10.6%
Adult obesity rate : Calhoun County :
33.0%South Carolina :
29.4%
Low-income preschool obesity rate : This county :
15.6%State :
13.4%
Health and Nutrition: Healthy diet rate : Oak Grove:
47.5%South Carolina:
49.2%
Average overall health of teeth and gums : This city:
43.2%State:
46.2%
People feeling badly about themselves : Oak Grove:
22.4%State:
20.4%
People not drinking alcohol at all : This city:
10.1%State:
11.0%
Average hours sleeping at night : Overweight people : This city:
33.6%State:
34.4%
General health condition : Oak Grove:
55.0%South Carolina:
55.6%
Average condition of hearing : Oak Grove:
78.7%South Carolina:
79.9%
More about Health and Nutrition of Oak Grove, SC Residents Strongest AM radio stations in Oak Grove:
WVOC (560 AM; 5 kW; COLUMBIA, SC; Owner: CAPSTAR TX LIMITED PARTNERSHIP)
WBAJ (890 AM; daytime; 50 kW; BLYTHEWOOD, SC; Owner: FAMILY FIRST)
WISW (1320 AM; 5 kW; COLUMBIA, SC; Owner: CITADEL BROADCASTING COMPANY)
WLGO (1170 AM; daytime; 10 kW; LEXINGTON, SC; Owner: LEVAS COMMUNICATIONS, LLC)
WCEO (840 AM; daytime; 50 kW; COLUMBIA, SC; Owner: EASTERN BROADCASTING GROUP, INC.)
WQXL (1470 AM; 5 kW; COLUMBIA, SC; Owner: METRO COMMUNICATIONS, INCORP.)
WGCV (620 AM; 1 kW; CAYCE, SC; Owner: GLORY COMMUNICATIONS, INC.)
WOIC (1230 AM; 1 kW; COLUMBIA, SC; Owner: URBAN RADIO OF SOUTH CAROLINA, LLC)
WCOS (1400 AM; 1 kW; COLUMBIA, SC; Owner: CAPSTAR TX LIMITED PARTNERSHIP)
WBCU (1460 AM; 50 kW; UNION, SC)
WAGL (1560 AM; daytime; 50 kW; LANCASTER, SC; Owner: PALMETTO BROADCASTING SYSTEM, INC.)
WLFJ (660 AM; daytime; 50 kW; GREENVILLE, SC; Owner: CLEAR CHANNEL BROADCASTING LICENSES, INC.)
WBLR (1430 AM; 5 kW; BATESBURG, SC; Owner: BARINOWSKI INVESTMENT COMPANY)
Strongest FM radio stations in Oak Grove:
WMHK (89.7 FM; COLUMBIA, SC; Owner: COLUMBIA BIBLE COLLEGE B/CING CO.)
WCOS-FM (97.5 FM; COLUMBIA, SC; Owner: CAPSTAR TX LIMITED PARTNERSHIP)
WLTY (96.7 FM; CAYCE, SC; Owner: CAPSTAR TX LIMITED PARTNERSHIP)
WXBT (100.1 FM; WEST COLUMBIA, SC; Owner: CAPSTAR TX LIMITED PARTNERSHIP)
WFMV (95.3 FM; SOUTH CONGAREE, SC; Owner: GLORY COMMUNICATIONS, INC.)
WNOK (104.7 FM; COLUMBIA, SC; Owner: CAPSTAR TX LIMITED PARTNERSHIP)
WARQ (93.5 FM; COLUMBIA, SC; Owner: URBAN RADIO OF SOUTH CAROLINA, LLC)
WLTR (91.3 FM; COLUMBIA, SC; Owner: SOUTH CAROLINA EDUCATIONAL TV COMMISSION)
WLXC (98.5 FM; LEXINGTON, SC; Owner: CITADEL BROADCASTING COMPANY)
WUSC-FM (90.5 FM; COLUMBIA, SC; Owner: THE UNIVERSITY OF SOUTH CAROLINA)
WMFX (102.3 FM; ST. ANDREWS, SC; Owner: URBAN RADIO OF SOUTH CAROLINA, LLC)
W240AX (95.9 FM; COLUMBIA, SC; Owner: BIBLE BROADCASTING NETWORK, INC.)
WWDM (101.3 FM; SUMTER, SC; Owner: URBAN RADIO OF SOUTH CAROLINA, LLC)
WTCB (106.7 FM; ORANGEBURG, SC; Owner: CITADEL BROADCASTING COMPANY)
WOMG (103.1 FM; COLUMBIA, SC; Owner: CITADEL BROADCASTING COMPANY)
WYFV (88.7 FM; CAYCE, SC; Owner: BIBLE BROADCASTING NETWORK, INC.)
WZMJ (93.1 FM; BATESBURG, SC; Owner: URBAN RADIO OF SOUTH CAROLINA, LLC)
W207BQ (89.3 FM; COLUMBIA, SC; Owner: CALVARY CHAPEL OF TWIN FALLS, INC.)
W222AD (92.3 FM; IRMO, SC; Owner: BIBLE BROADCASTING NETWORK, INC.)
WHXT (103.9 FM; ORANGEBURG, SC; Owner: URBAN RADIO OF SOUTH CAROLINA, LLC)
TV broadcast stations around Oak Grove:
WRLK-TV (Channel 35; COLUMBIA, SC; Owner: SOUTH CAROLINA EDUCATIONAL TV COMMISSION)
WOLO-TV (Channel 25; COLUMBIA, SC; Owner: SOUTH CAROLINA BROADCASTING PARTNERS)
WLTX (Channel 19; COLUMBIA, SC; Owner: PACIFIC AND SOUTHERN COMPANY, INC.)
WACH (Channel 57; COLUMBIA, SC; Owner: RAYCOM AMERICA, INC.)
W67DP (Channel 67; COLUMBIA, SC; Owner: DOVE BROADCASTING, INC.)
WIS (Channel 10; COLUMBIA, SC; Owner: LIBCO, INC.)
W39CL (Channel 39; COLUMBIA, SC; Owner: NATIONAL MINORITY T.V., INC.)
W21CA (Channel 21; COLUMBIA, SC; Owner: DOVE BROADCASTING, INC.)
WBHQ (Channel 63; SUMTER, SC; Owner: COLUMBIA BROADCASTING, INC.)
W31BS (Channel 31; ORANGEBURG, SC; Owner: DOVE BROADCASTING INC.)
National Bridge Inventory (NBI) Statistics 5 Number of bridges66ft / 19.9m Total length301,900 Total average daily traffic25,225 Total average daily truck traffic
FCC Registered Cell Phone Towers: 1 (
See the full list of FCC Registered Cell Phone Towers in Oak Grove )
FCC Registered Antenna Towers: 24 (
See the full list of FCC Registered Antenna Towers )
FCC Registered Microwave Towers: 3
OAK GROVE, .8 Mi S Of (Lat: 33.739306 Lon: -81.520083), Overall height: 73.2 m, Call Sign: WMJ348, Assigned Frequencies: 2174.80 MHz, Grant Date: 03/06/2001, Expiration Date: 02/01/2011, Cancellation Date: 11/05/2009, Certifier: Glenn S Rabin, Registrant: Verizon Wireless, 1120 Sanctuary Pkwy, #150 Gasa5reg, Alpharetta, GA 30009-7630, Phone: (770) 797-1070, Fax: (770) 797-1036, Email:
CR03AW261, Calvary Church Road (Lat: 33.762583 Lon: -80.974083), Type: Ltower, Structure height: 91.4 m, Overall height: 97.5 m, Call Sign: WQVD307, Assigned Frequencies: 11265.0 MHz, 11265.0 MHz, 11265.0 MHz, 11265.0 MHz, 11265.0 MHz, 11265.0 MHz, 11265.0 MHz, Grant Date: 01/07/2015, Expiration Date: 01/07/2025, Cancellation Date: 06/22/2016, Certifier: Kyle B Entz, Registrant: Sprint Corporation, 12502 Sunrise Valley Drive, M/S: Varesa0209, Reston, VA 20196, Phone: (703) 433-4000, Fax: (703) 433-4483 CR03AW261, Calvary Church Road (Lat: 33.762583 Lon: -80.974083), Type: Gtower, Structure height: 91.4 m, Overall height: 97.5 m, Call Sign: WRNY311, Assigned Frequencies: 11265.0 MHz, Grant Date: 09/08/2021, Expiration Date: 09/08/2031, Cancellation Date: 03/07/2023, Certifier: Jenny Knopf, Registrant: T-Mobile Usa, Inc., 12920 Se 38th St, Bellevue, WA 98006, Phone: (425) 383-8401, Fax: (425) 383-4840, Email:
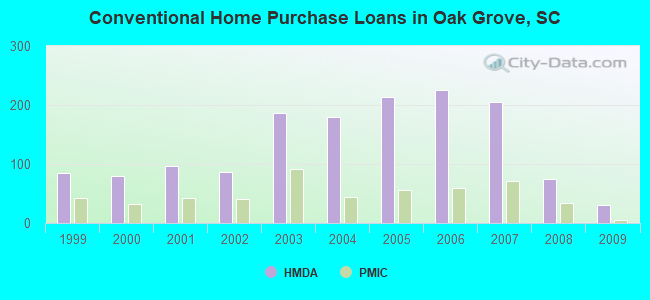
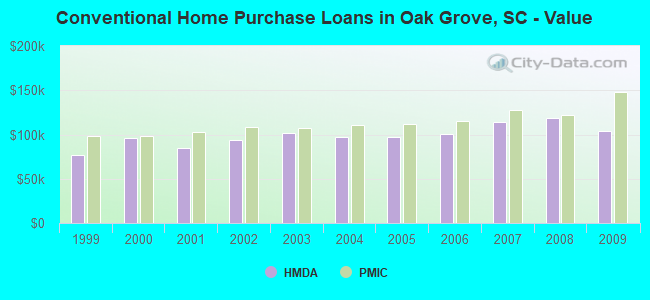
Home Mortgage Disclosure Act Aggregated Statistics For Year 2009(Based on 3 partial tracts) A) FHA, FSA/RHS & VA B) Conventional C) Refinancings D) Home Improvement Loans F) Non-occupant Loans on G) Loans On Manufactured Number Average Value Number Average Value Number Average Value Number Average Value Number Average Value Number Average Value
LOANS ORIGINATED 72 $116,168 30 $104,240 189 $118,328 5 $66,510 11 $63,711 4 $35,568 APPLICATIONS APPROVED, NOT ACCEPTED 3 $137,843 0 $0 14 $128,131 1 $46,890 0 $0 0 $0 APPLICATIONS DENIED 7 $123,730 4 $141,938 63 $123,464 7 $42,010 3 $99,463 0 $0 APPLICATIONS WITHDRAWN 4 $111,072 7 $112,031 43 $132,988 0 $0 3 $79,007 0 $0 FILES CLOSED FOR INCOMPLETENESS 0 $0 2 $114,410 15 $115,354 0 $0 1 $94,090 0 $0
Aggregated Statistics For Year 2008(Based on 3 partial tracts) A) FHA, FSA/RHS & VA B) Conventional C) Refinancings D) Home Improvement Loans E) Loans on Dwellings For 5+ Families F) Non-occupant Loans on G) Loans On Manufactured Number Average Value Number Average Value Number Average Value Number Average Value Number Average Value Number Average Value Number Average Value
LOANS ORIGINATED 40 $126,297 75 $119,153 134 $111,433 13 $37,376 1 $4,256,940 23 $112,053 8 $166,154 APPLICATIONS APPROVED, NOT ACCEPTED 1 $137,180 10 $123,901 19 $112,592 3 $37,933 0 $0 4 $77,962 1 $35,080 APPLICATIONS DENIED 6 $120,485 14 $90,200 82 $114,380 22 $60,652 0 $0 8 $133,576 4 $61,630 APPLICATIONS WITHDRAWN 2 $120,865 7 $150,486 32 $126,672 1 $113,290 0 $0 0 $0 0 $0 FILES CLOSED FOR INCOMPLETENESS 1 $157,670 1 $167,590 10 $140,420 1 $21,880 0 $0 2 $69,505 0 $0
Aggregated Statistics For Year 2007(Based on 3 partial tracts) A) FHA, FSA/RHS & VA B) Conventional C) Refinancings D) Home Improvement Loans F) Non-occupant Loans on G) Loans On Manufactured Number Average Value Number Average Value Number Average Value Number Average Value Number Average Value Number Average Value
LOANS ORIGINATED 13 $123,522 205 $114,125 140 $102,990 21 $43,242 33 $96,702 4 $39,428 APPLICATIONS APPROVED, NOT ACCEPTED 0 $0 24 $109,279 22 $105,135 6 $24,312 1 $143,730 2 $58,335 APPLICATIONS DENIED 0 $0 28 $100,654 89 $108,474 16 $74,628 9 $110,107 4 $49,290 APPLICATIONS WITHDRAWN 2 $116,390 16 $135,637 45 $120,612 4 $79,385 1 $74,400 0 $0 FILES CLOSED FOR INCOMPLETENESS 0 $0 4 $166,020 12 $108,122 1 $68,300 2 $112,890 0 $0
Aggregated Statistics For Year 2006(Based on 3 partial tracts) A) FHA, FSA/RHS & VA B) Conventional C) Refinancings D) Home Improvement Loans F) Non-occupant Loans on G) Loans On Manufactured Number Average Value Number Average Value Number Average Value Number Average Value Number Average Value Number Average Value
LOANS ORIGINATED 18 $131,936 226 $100,226 135 $95,450 32 $39,288 32 $84,050 5 $47,834 APPLICATIONS APPROVED, NOT ACCEPTED 0 $0 13 $97,848 30 $86,990 6 $17,332 3 $101,393 2 $37,440 APPLICATIONS DENIED 3 $103,920 42 $91,107 112 $100,250 27 $57,341 11 $103,675 8 $45,270 APPLICATIONS WITHDRAWN 1 $158,410 16 $98,617 67 $100,101 6 $83,342 5 $88,582 0 $0 FILES CLOSED FOR INCOMPLETENESS 1 $89,780 6 $101,727 17 $113,200 0 $0 0 $0 0 $0
Aggregated Statistics For Year 2005(Based on 3 partial tracts) A) FHA, FSA/RHS & VA B) Conventional C) Refinancings D) Home Improvement Loans E) Loans on Dwellings For 5+ Families F) Non-occupant Loans on G) Loans On Manufactured Number Average Value Number Average Value Number Average Value Number Average Value Number Average Value Number Average Value Number Average Value
LOANS ORIGINATED 29 $125,613 213 $96,713 150 $95,453 24 $46,122 2 $4,788,860 32 $82,867 5 $43,698 APPLICATIONS APPROVED, NOT ACCEPTED 1 $111,940 22 $80,607 33 $96,232 1 $16,400 0 $0 2 $63,405 5 $56,140 APPLICATIONS DENIED 2 $105,495 33 $76,374 140 $95,448 32 $35,863 0 $0 10 $110,335 12 $37,099 APPLICATIONS WITHDRAWN 1 $169,400 28 $90,451 68 $127,596 8 $71,224 0 $0 6 $107,528 0 $0 FILES CLOSED FOR INCOMPLETENESS 1 $110,030 5 $84,106 35 $116,465 0 $0 0 $0 2 $69,930 0 $0
Aggregated Statistics For Year 2004(Based on 3 partial tracts) A) FHA, FSA/RHS & VA B) Conventional C) Refinancings D) Home Improvement Loans F) Non-occupant Loans on G) Loans On Manufactured Number Average Value Number Average Value Number Average Value Number Average Value Number Average Value Number Average Value
LOANS ORIGINATED 42 $116,138 179 $97,141 188 $88,022 17 $41,764 33 $82,458 8 $61,691 APPLICATIONS APPROVED, NOT ACCEPTED 1 $143,240 12 $80,658 31 $79,665 3 $16,833 4 $62,902 7 $40,520 APPLICATIONS DENIED 4 $105,955 33 $93,513 109 $95,850 19 $25,339 8 $87,794 6 $37,682 APPLICATIONS WITHDRAWN 2 $110,455 19 $89,883 55 $94,187 3 $29,853 4 $71,708 1 $43,160 FILES CLOSED FOR INCOMPLETENESS 1 $155,650 4 $97,870 19 $104,103 2 $26,680 2 $98,910 0 $0
Aggregated Statistics For Year 2003(Based on 3 partial tracts) A) FHA, FSA/RHS & VA B) Conventional C) Refinancings D) Home Improvement Loans F) Non-occupant Loans on Number Average Value Number Average Value Number Average Value Number Average Value Number Average Value
LOANS ORIGINATED 54 $112,957 187 $101,699 455 $93,632 14 $35,114 30 $67,937 APPLICATIONS APPROVED, NOT ACCEPTED 2 $93,015 9 $86,481 49 $89,156 5 $9,194 3 $41,053 APPLICATIONS DENIED 3 $92,457 29 $63,163 137 $91,801 15 $22,837 4 $80,065 APPLICATIONS WITHDRAWN 5 $115,712 20 $96,304 79 $95,108 3 $31,320 3 $91,857 FILES CLOSED FOR INCOMPLETENESS 0 $0 1 $96,940 12 $101,691 2 $48,175 0 $0
Aggregated Statistics For Year 2002(Based on 2 partial tracts) A) FHA, FSA/RHS & VA B) Conventional C) Refinancings D) Home Improvement Loans F) Non-occupant Loans on Number Average Value Number Average Value Number Average Value Number Average Value Number Average Value
LOANS ORIGINATED 15 $96,065 87 $94,071 194 $88,965 11 $28,755 16 $68,356 APPLICATIONS APPROVED, NOT ACCEPTED 0 $0 14 $42,569 25 $76,664 0 $0 2 $12,055 APPLICATIONS DENIED 1 $53,030 39 $59,059 98 $75,319 6 $27,855 3 $30,543 APPLICATIONS WITHDRAWN 3 $97,103 5 $91,184 37 $85,856 1 $73,920 1 $105,060 FILES CLOSED FOR INCOMPLETENESS 0 $0 0 $0 13 $87,356 0 $0 0 $0
Aggregated Statistics For Year 2001(Based on 2 partial tracts) A) FHA, FSA/RHS & VA B) Conventional C) Refinancings D) Home Improvement Loans F) Non-occupant Loans on Number Average Value Number Average Value Number Average Value Number Average Value Number Average Value
LOANS ORIGINATED 37 $103,184 96 $85,034 158 $88,756 6 $23,867 11 $66,144 APPLICATIONS APPROVED, NOT ACCEPTED 0 $0 14 $53,100 25 $75,734 1 $27,340 0 $0 APPLICATIONS DENIED 3 $114,243 35 $44,203 77 $67,835 6 $29,308 3 $63,500 APPLICATIONS WITHDRAWN 2 $93,915 12 $68,216 50 $90,124 1 $18,520 1 $72,030 FILES CLOSED FOR INCOMPLETENESS 0 $0 1 $74,730 14 $86,845 0 $0 0 $0
Aggregated Statistics For Year 2000(Based on 2 partial tracts) A) FHA, FSA/RHS & VA B) Conventional C) Refinancings D) Home Improvement Loans F) Non-occupant Loans on Number Average Value Number Average Value Number Average Value Number Average Value Number Average Value
LOANS ORIGINATED 23 $91,400 79 $95,964 48 $64,404 12 $18,999 11 $191,585 APPLICATIONS APPROVED, NOT ACCEPTED 7 $27,073 20 $46,606 18 $53,569 3 $21,507 1 $73,050 APPLICATIONS DENIED 7 $53,531 47 $39,929 64 $64,616 11 $31,688 3 $39,993 APPLICATIONS WITHDRAWN 6 $57,028 3 $81,247 33 $59,816 4 $25,680 1 $20,090 FILES CLOSED FOR INCOMPLETENESS 0 $0 1 $106,830 16 $68,922 0 $0 0 $0
Aggregated Statistics For Year 1999(Based on 2 partial tracts) A) FHA, FSA/RHS & VA B) Conventional C) Refinancings D) Home Improvement Loans F) Non-occupant Loans on Number Average Value Number Average Value Number Average Value Number Average Value Number Average Value
LOANS ORIGINATED 21 $87,553 84 $76,612 108 $70,814 13 $13,408 11 $53,685 APPLICATIONS APPROVED, NOT ACCEPTED 0 $0 24 $59,714 40 $55,872 2 $21,220 1 $67,280 APPLICATIONS DENIED 3 $65,757 70 $44,563 63 $66,251 9 $12,787 3 $59,260 APPLICATIONS WITHDRAWN 0 $0 7 $75,557 30 $70,179 1 $40,660 2 $34,445 FILES CLOSED FOR INCOMPLETENESS 0 $0 0 $0 10 $150,071 0 $0 1 $1,051,710
Detailed HMDA statistics for the following Tracts:
0205.07
, 0210.07 , 0210.16
Private Mortgage Insurance Companies Aggregated Statistics For Year 2009(Based on 3 partial tracts) A) Conventional B) Refinancings Number Average Value Number Average Value
LOANS ORIGINATED 5 $147,596 12 $125,680 APPLICATIONS APPROVED, NOT ACCEPTED 1 $92,400 4 $124,645 APPLICATIONS DENIED 0 $0 2 $111,340 APPLICATIONS WITHDRAWN 1 $263,450 1 $104,690 FILES CLOSED FOR INCOMPLETENESS 0 $0 1 $206,040
Aggregated Statistics For Year 2008(Based on 3 partial tracts) A) Conventional B) Refinancings C) Non-occupant Loans on Number Average Value Number Average Value Number Average Value
LOANS ORIGINATED 34 $121,941 15 $137,423 2 $79,440 APPLICATIONS APPROVED, NOT ACCEPTED 8 $124,975 7 $136,046 1 $108,060 APPLICATIONS DENIED 1 $163,160 1 $133,780 0 $0 APPLICATIONS WITHDRAWN 1 $65,210 0 $0 0 $0 FILES CLOSED FOR INCOMPLETENESS 0 $0 1 $120,850 0 $0
Aggregated Statistics For Year 2007(Based on 3 partial tracts) A) Conventional B) Refinancings C) Non-occupant Loans on Number Average Value Number Average Value Number Average Value
LOANS ORIGINATED 72 $128,107 32 $134,367 8 $102,775 APPLICATIONS APPROVED, NOT ACCEPTED 7 $129,733 5 $149,524 1 $92,850 APPLICATIONS DENIED 2 $82,995 3 $117,550 1 $132,720 APPLICATIONS WITHDRAWN 2 $121,930 2 $127,060 0 $0 FILES CLOSED FOR INCOMPLETENESS 1 $60,700 0 $0 1 $43,390
Aggregated Statistics For Year 2006(Based on 3 partial tracts) A) Conventional B) Refinancings C) Non-occupant Loans on D) Loans On Manufactured Number Average Value Number Average Value Number Average Value Number Average Value
LOANS ORIGINATED 60 $115,123 22 $120,710 6 $92,640 1 $68,300 APPLICATIONS APPROVED, NOT ACCEPTED 6 $125,038 4 $145,208 1 $88,330 0 $0 APPLICATIONS DENIED 0 $0 1 $91,090 0 $0 0 $0 APPLICATIONS WITHDRAWN 3 $83,967 4 $182,540 0 $0 0 $0 FILES CLOSED FOR INCOMPLETENESS 0 $0 0 $0 0 $0 0 $0
Aggregated Statistics For Year 2005(Based on 3 partial tracts) A) Conventional B) Refinancings C) Non-occupant Loans on D) Loans On Manufactured Number Average Value Number Average Value Number Average Value Number Average Value
LOANS ORIGINATED 56 $111,714 20 $121,388 7 $98,854 2 $62,510 APPLICATIONS APPROVED, NOT ACCEPTED 6 $115,798 4 $115,940 1 $73,630 1 $59,540 APPLICATIONS DENIED 1 $57,850 0 $0 0 $0 1 $57,850 APPLICATIONS WITHDRAWN 3 $131,977 3 $104,360 0 $0 0 $0 FILES CLOSED FOR INCOMPLETENESS 0 $0 0 $0 0 $0 0 $0
Aggregated Statistics For Year 2004(Based on 3 partial tracts) A) Conventional B) Refinancings C) Non-occupant Loans on Number Average Value Number Average Value Number Average Value
LOANS ORIGINATED 44 $110,544 32 $111,094 3 $100,840 APPLICATIONS APPROVED, NOT ACCEPTED 5 $92,534 9 $98,358 1 $74,790 APPLICATIONS DENIED 2 $95,215 0 $0 1 $50,620 APPLICATIONS WITHDRAWN 3 $157,300 2 $99,385 0 $0 FILES CLOSED FOR INCOMPLETENESS 1 $50,620 0 $0 1 $50,620
Aggregated Statistics For Year 2003(Based on 3 partial tracts) A) Conventional B) Refinancings C) Non-occupant Loans on Number Average Value Number Average Value Number Average Value
LOANS ORIGINATED 91 $107,388 103 $104,213 6 $87,617 APPLICATIONS APPROVED, NOT ACCEPTED 6 $128,197 25 $102,117 0 $0 APPLICATIONS DENIED 1 $125,200 2 $106,420 1 $47,150 APPLICATIONS WITHDRAWN 1 $89,990 6 $97,558 1 $120,450 FILES CLOSED FOR INCOMPLETENESS 0 $0 0 $0 0 $0
Aggregated Statistics For Year 2002(Based on 2 partial tracts) A) Conventional B) Refinancings C) Non-occupant Loans on Number Average Value Number Average Value Number Average Value
LOANS ORIGINATED 41 $108,879 57 $102,043 2 $53,985 APPLICATIONS APPROVED, NOT ACCEPTED 4 $88,655 9 $90,266 0 $0 APPLICATIONS DENIED 0 $0 0 $0 0 $0 APPLICATIONS WITHDRAWN 3 $86,730 4 $99,540 0 $0 FILES CLOSED FOR INCOMPLETENESS 0 $0 0 $0 0 $0
Aggregated Statistics For Year 2001(Based on 2 partial tracts) A) Conventional B) Refinancings C) Non-occupant Loans on Number Average Value Number Average Value Number Average Value
LOANS ORIGINATED 43 $103,203 51 $107,637 3 $89,497 APPLICATIONS APPROVED, NOT ACCEPTED 4 $87,602 7 $100,631 0 $0 APPLICATIONS DENIED 1 $80,350 4 $102,122 0 $0 APPLICATIONS WITHDRAWN 0 $0 2 $85,170 0 $0 FILES CLOSED FOR INCOMPLETENESS 0 $0 1 $137,770 0 $0
Aggregated Statistics For Year 2000(Based on 2 partial tracts) A) Conventional B) Refinancings Number Average Value Number Average Value
LOANS ORIGINATED 32 $97,795 8 $101,360 APPLICATIONS APPROVED, NOT ACCEPTED 3 $96,000 1 $47,410 APPLICATIONS DENIED 1 $102,000 1 $86,780 APPLICATIONS WITHDRAWN 2 $73,620 1 $62,670 FILES CLOSED FOR INCOMPLETENESS 0 $0 0 $0
Aggregated Statistics For Year 1999(Based on 2 partial tracts) A) Conventional B) Refinancings C) Non-occupant Loans on Number Average Value Number Average Value Number Average Value
LOANS ORIGINATED 43 $98,498 22 $82,055 1 $59,270 APPLICATIONS APPROVED, NOT ACCEPTED 4 $72,912 3 $86,540 0 $0 APPLICATIONS DENIED 2 $68,485 1 $94,140 0 $0 APPLICATIONS WITHDRAWN 1 $82,500 1 $35,240 0 $0 FILES CLOSED FOR INCOMPLETENESS 1 $50,460 1 $98,520 1 $50,460
Detailed PMIC statistics for the following Tracts:
0205.07
, 0210.07 , 0210.16 Oak Grove compared to South Carolina state average:
Unemployed percentage significantly below state average. Length of stay since moving in significantly above state average.
#39 on the list of "Top 101 cities with the most residents born in Lebanon (population 500+)"


 Recent articles from our blog. Our writers, many of them Ph.D. graduates or candidates, create easy-to-read articles on a wide variety of topics.


 (7.8 miles