Estimated median house or condo value in 2022: $462,546 (it was $111,900 in 2000)
North Topsail Beach:
$462,546
NC:
$280,600
Mean prices in 2022:all housing units: $252,118; detached houses: $269,564; townhouses or other attached units: $196,221; in 2-unit structures: $336,576; in 3-to-4-unit structures: $283,844; in 5-or-more-unit structures: $150,612; mobile homes: $117,612; occupied boats, rvs, vans, etc.: $30,792
Median gross rent in 2022: $1,335.
March 2022 cost of living index in North Topsail Beach: 84.9 (less than average, U.S. average is 100)
Percentage of residents living in poverty in 2022: 9.2%
(7.0% for White Non-Hispanic residents, 25.0% for Black residents, 31.2% for Hispanic or Latino residents, 41.5% for two or more races residents)
According to our research of North Carolina and other state lists, there was 1 registered sex offender living in North Topsail Beach, North Carolina as of May 08, 2024. The ratio of all residents to sex offenders in North Topsail Beach is 1,112 to 1. The ratio of registered sex offenders to all residents in this city is lower than the state average.
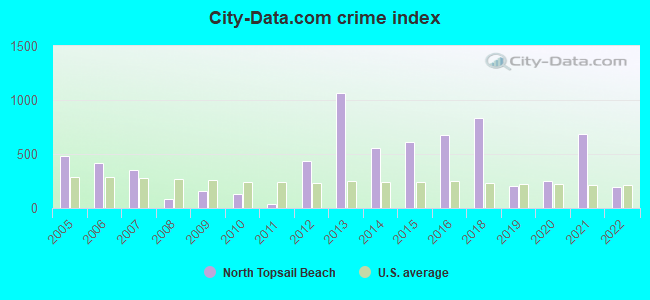
Crime rates in North Topsail Beach by year
Type
2009
2010
2011
2012
2013
2014
2015
2016
2018
2019
2020
2021
2022
Murders (per 100,000)
0 (0.0)
0 (0.0)
0 (0.0)
0 (0.0)
2 (272.1)
0 (0.0)
0 (0.0)
0 (0.0)
2 (276.6)
0 (0.0)
0 (0.0)
1 (134.6)
0 (0.0)
Rapes (per 100,000)
1 (103.2)
0 (0.0)
0 (0.0)
0 (0.0)
0 (0.0)
1 (136.4)
0 (0.0)
3 (407.6)
0 (0.0)
0 (0.0)
0 (0.0)
1 (134.6)
1 (99.9)
Robberies (per 100,000)
0 (0.0)
0 (0.0)
0 (0.0)
0 (0.0)
0 (0.0)
0 (0.0)
0 (0.0)
0 (0.0)
0 (0.0)
0 (0.0)
0 (0.0)
0 (0.0)
0 (0.0)
Assaults (per 100,000)
0 (0.0)
0 (0.0)
0 (0.0)
3 (395.3)
0 (0.0)
4 (545.7)
2 (273.2)
1 (135.9)
0 (0.0)
2 (271.0)
2 (269.2)
2 (269.2)
0 (0.0)
Burglaries (per 100,000)
7 (722.4)
10 (1,346)
2 (266.0)
22 (2,899)
25 (3,401)
22 (3,001)
42 (5,738)
22 (2,989)
19 (2,628)
10 (1,355)
11 (1,480)
16 (2,153)
5 (499.5)
Thefts (per 100,000)
3 (309.6)
7 (942.1)
1 (133.0)
27 (3,557)
48 (6,531)
22 (3,001)
28 (3,825)
19 (2,582)
15 (2,075)
8 (1,084)
16 (2,153)
16 (2,153)
17 (1,698)
Auto thefts (per 100,000)
1 (103.2)
0 (0.0)
1 (133.0)
1 (131.8)
2 (272.1)
1 (136.4)
0 (0.0)
1 (135.9)
1 (138.3)
1 (135.5)
1 (134.6)
2 (269.2)
1 (99.9)
Arson (per 100,000)
0 (0.0)
0 (0.0)
0 (0.0)
0 (0.0)
0 (0.0)
0 (0.0)
0 (0.0)
0 (0.0)
0 (0.0)
0 (0.0)
0 (0.0)
0 (0.0)
0 (0.0)
City-Data.com crime index
153.8
131.9
34.6
434.8
1065.3
559.3
609.3
676.6
831.3
203.3
254.4
689.1
190.8
The City-Data.com crime index weighs serious crimes and violent crimes more heavily. Higher means more crime, U.S. average is 246.1. It adjusts for the number of visitors and daily workers commuting into cities.
Latest news from North Topsail Beach, NC collected exclusively by city-data.com from local newspapers, TV, and radio stations
Ancestries: Irish (30.1%), English (18.0%), German (8.6%), American (8.1%), Scottish (3.8%), British (2.2%).
Current Local Time: EST time zone
Elevation: 5 feet
Land area: 6.42 square miles.
Population density: 161 people per square mile (very low).
7 residents are foreign born
This city:
0.9%
North Carolina:
8.3%
Median real estate property taxes paid for housing units with mortgages in 2022: $3,843 (0.8%) Median real estate property taxes paid for housing units with no mortgage in 2022: $2,521 (0.6%)
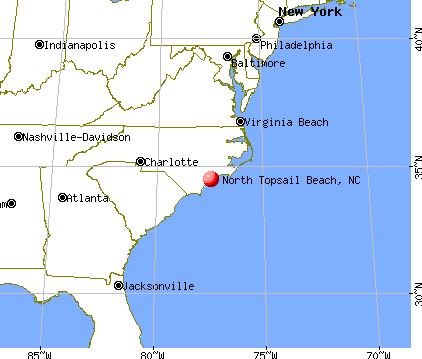
Nearest city with pop. 50,000+: Jacksonville, NC (19.8 miles , pop. 66,715).
Nearest city with pop. 200,000+: Raleigh, NC (114.4 miles , pop. 276,093).
Nearest city with pop. 1,000,000+: Philadelphia, PA (402.6 miles , pop. 1,517,550).
Air Quality Index (AQI) level in 2023 was 71.2. This is about average.
City:
71.2
U.S.:
72.6
Sulfur Dioxide (SO2) [ppb] level in 2005 was 2.27. This is significantly worse than average.Closest monitor was 19.0 miles away from the city center.
City:
2.27
U.S.:
1.51
Ozone [ppb] level in 2022 was 23.5. This is significantly better than average.Closest monitor was 22.9 miles away from the city center.
City:
23.5
U.S.:
33.3
Particulate Matter (PM10) [µg/m3] level in 2022 was 15.4. This is better than average.Closest monitor was 20.1 miles away from the city center.
City:
15.4
U.S.:
19.2
Particulate Matter (PM2.5) [µg/m3] level in 2022 was 6.30. This is better than average.Closest monitor was 20.6 miles away from the city center.
City:
6.30
U.S.:
8.11
Tornado activity:
North Topsail Beach-area historical tornado activity is slightly below North Carolina state average. It is 31% smaller than the overall U.S. average.
On 3/17/1965, a category F3 (max. wind speeds 158-206 mph) tornado 38.7 miles away from the North Topsail Beach city center killed 2 peopleand injured 85 peopleand causedbetween $500,000 and $5,000,000 in damages.
On 11/2/1954, a category F2 (max. wind speeds 113-157 mph) tornado 15.5 miles away from the city center causedbetween $5000 and $50,000 in damages.
Earthquake activity:
North Topsail Beach-area historical earthquake activity is significantly above North Carolina state average. It is 66% smaller than the overall U.S. average.
On 8/23/2011 at 17:51:04, a magnitude 5.8 (5.8 MW, Depth: 3.7 mi, Class: Moderate, Intensity: VI - VII) earthquake occurred 238.9 miles away from North Topsail Beach center On 8/9/2020 at 12:07:37, a magnitude 5.1 (5.1 MW, Depth: 4.7 mi) earthquake occurred 246.9 miles away from the city center On 11/22/1974 at 05:25:55, a magnitude 4.7 (4.7 MB, Class: Light, Intensity: IV - V) earthquake occurred 189.1 miles away from North Topsail Beach center On 8/6/1994 at 19:54:09, a magnitude 3.8 (3.6 LG, 3.8 LG, Depth: 3.1 mi, Class: Light, Intensity: II - III) earthquake occurred 57.4 miles away from the city center On 8/21/1992 at 16:31:55, a magnitude 4.4 (4.1 MB, 4.1 LG, 4.4 LG, Depth: 6.2 mi) earthquake occurred 181.8 miles away from the city center On 12/9/2003 at 20:59:14, a magnitude 4.5 (4.5 MB, 4.5 LG) earthquake occurred 216.5 miles away from the city center Magnitude types: regional Lg-wave magnitude (LG), body-wave magnitude (MB), moment magnitude (MW)
Natural disasters:
The number of natural disasters in Onslow County (21) is greater than the US average (15). Major Disasters (Presidential) Declared: 10 Emergencies Declared: 7
Causes of natural disasters: Hurricanes: 18, Floods: 2, Storms: 2, Tornado: 1, Tropical Storm: 1, Wind: 1, Other: 1 (Note: some incidents may be assigned to more than one category).
Hospitals and medical centers near North Topsail Beach:
WOODBURY WELLNESS CENTER INC (Nursing Home, about 12 miles away; HAMPSTEAD, NC)
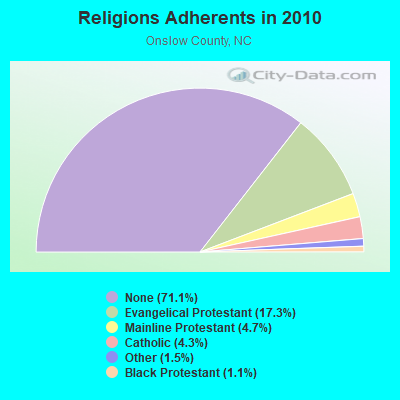
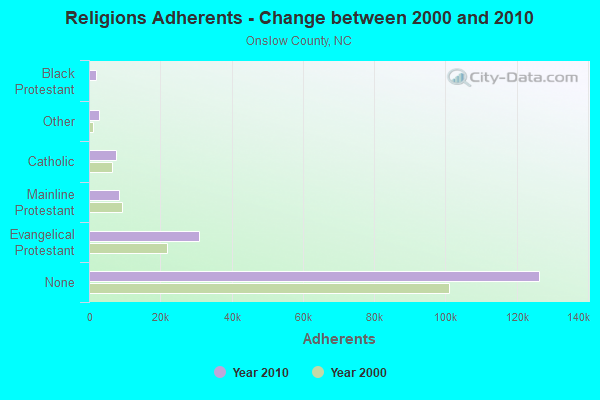
Religion statistics for North Topsail Beach, NC (based on Onslow County data)
Religion
Adherents
Congregations
Evangelical Protestant
30,825
110
Mainline Protestant
8,398
22
Catholic
7,579
2
Other
2,704
7
Black Protestant
1,891
17
None
126,375
-
Source: Clifford Grammich, Kirk Hadaway, Richard Houseal, Dale E.Jones, Alexei Krindatch, Richie Stanley and Richard H.Taylor. 2012. 2010 U.S.Religion Census: Religious Congregations & Membership Study. Association of Statisticians of American Religious Bodies. Jones, Dale E., et al. 2002. Congregations and Membership in the United States 2000. Nashville, TN: Glenmary Research Center. Graphs represent county-level data
Hwy 210 And Grey St (Lat: 34.452944 Lon: -77.492750), Call Sign: WNUY382, Assigned Frequencies: 154.830 MHz, 155.730 MHz, Grant Date: 11/13/2010, Expiration Date: 11/29/2020, Cancellation Date: 08/25/2016, Registrant: North Topsail, 2008 Loggenhead Ct, North Topsail, NC 28460, Phone: (910) 328-1349
FCC Registered Microwave Towers:
1
ST REGIS ROOF, Lat: 34.520583 Lon: -77.358222, Type: Building, Structure height: 37 m, Call Sign: WQNA410, Assigned Frequencies: 3650.00 MHz, Grant Date: 11/23/2010, Expiration Date: 11/23/2020, Cancellation Date: 01/23/2021, Certifier: S. F Mcneill, Registrant: Attorney At Law, 5151 Wisconsin Ave Nw Ste 312, Washington, DC 20016, Phone: (202) 223-3772, Fax: (202) 840-6499, Email:
FCC Registered Amateur Radio Licenses:
3
Call Sign: KK4PES, Licensee ID: L01771268, Grant Date: 03/06/2013, Expiration Date: 03/06/2023, Certifier: William C Selby, Registrant: William C Selby, 790 New River Inlet Rd #403a, North Topsail Beach, NC 28460
Call Sign: KM4PBF, Licensee ID: L01984982, Grant Date: 11/19/2015, Expiration Date: 11/19/2025, Cancellation Date: 12/03/2022, Certifier: Christopher T Campbell, Registrant: Christopher T Campbell, 3226 Island Drive, North Topsail Beach, NC 28460
Call Sign: WO2CC, Previous Call Sign: KM4PBF, Licensee ID: L01984982, Grant Date: 12/03/2022, Expiration Date: 12/03/2032, Certifier: Christopher Campbell, Registrant: Christopher T Campbell, 3226 Island Drive, North Topsail Beach, NC 28460
Home Mortgage Disclosure Act Aggregated Statistics For Year 2009 (Based on 1 partial tract)
A) FHA, FSA/RHS & VA Home Purchase Loans
B) Conventional Home Purchase Loans
C) Refinancings
D) Home Improvement Loans
F) Non-occupant Loans on < 5 Family Dwellings (A B C & D)
G) Loans On Manufactured Home Dwelling (A B C & D)
Number
Average Value
Number
Average Value
Number
Average Value
Number
Average Value
Number
Average Value
Number
Average Value
LOANS ORIGINATED
17
$196,673
12
$221,672
37
$217,569
1
$141,170
18
$251,923
3
$88,040
APPLICATIONS APPROVED, NOT ACCEPTED
0
$0
1
$241,990
4
$199,248
0
$0
2
$273,325
0
$0
APPLICATIONS DENIED
2
$185,845
3
$210,840
17
$219,688
1
$236,920
8
$239,464
2
$87,300
APPLICATIONS WITHDRAWN
1
$159,660
3
$228,740
11
$210,830
0
$0
5
$253,010
1
$92,100
FILES CLOSED FOR INCOMPLETENESS
0
$0
1
$138,150
2
$290,345
0
$0
1
$155,310
0
$0
Aggregated Statistics For Year 2008 (Based on 1 partial tract)
A) FHA, FSA/RHS & VA Home Purchase Loans
B) Conventional Home Purchase Loans
C) Refinancings
D) Home Improvement Loans
F) Non-occupant Loans on < 5 Family Dwellings (A B C & D)
G) Loans On Manufactured Home Dwelling (A B C & D)
Number
Average Value
Number
Average Value
Number
Average Value
Number
Average Value
Number
Average Value
Number
Average Value
LOANS ORIGINATED
10
$194,149
18
$215,973
22
$239,194
3
$122,503
18
$251,972
4
$113,125
APPLICATIONS APPROVED, NOT ACCEPTED
1
$114,860
2
$174,820
5
$245,364
1
$41,160
4
$239,030
1
$88,280
APPLICATIONS DENIED
1
$169,620
4
$211,292
14
$238,296
3
$71,743
6
$310,928
3
$85,283
APPLICATIONS WITHDRAWN
1
$95,660
3
$289,783
6
$231,437
1
$113,260
5
$257,312
0
$0
FILES CLOSED FOR INCOMPLETENESS
0
$0
1
$256,390
2
$141,440
0
$0
0
$0
0
$0
Aggregated Statistics For Year 2007 (Based on 1 partial tract)
A) FHA, FSA/RHS & VA Home Purchase Loans
B) Conventional Home Purchase Loans
C) Refinancings
D) Home Improvement Loans
F) Non-occupant Loans on < 5 Family Dwellings (A B C & D)
G) Loans On Manufactured Home Dwelling (A B C & D)
Number
Average Value
Number
Average Value
Number
Average Value
Number
Average Value
Number
Average Value
Number
Average Value
LOANS ORIGINATED
8
$198,891
29
$232,332
28
$233,191
3
$96,160
29
$276,194
5
$103,764
APPLICATIONS APPROVED, NOT ACCEPTED
1
$97,260
4
$219,405
5
$324,948
1
$62,500
4
$373,270
1
$107,300
APPLICATIONS DENIED
1
$260,300
8
$276,612
14
$255,156
3
$94,620
10
$356,916
4
$78,832
APPLICATIONS WITHDRAWN
0
$0
4
$271,190
6
$300,348
1
$32,450
4
$375,870
1
$83,390
FILES CLOSED FOR INCOMPLETENESS
0
$0
2
$343,065
2
$256,700
0
$0
2
$241,850
0
$0
Aggregated Statistics For Year 2006 (Based on 1 partial tract)
A) FHA, FSA/RHS & VA Home Purchase Loans
B) Conventional Home Purchase Loans
C) Refinancings
D) Home Improvement Loans
F) Non-occupant Loans on < 5 Family Dwellings (A B C & D)
G) Loans On Manufactured Home Dwelling (A B C & D)
Number
Average Value
Number
Average Value
Number
Average Value
Number
Average Value
Number
Average Value
Number
Average Value
LOANS ORIGINATED
7
$183,781
37
$225,119
34
$309,513
4
$109,280
36
$298,934
5
$77,698
APPLICATIONS APPROVED, NOT ACCEPTED
1
$145,970
6
$228,177
5
$244,866
1
$61,610
5
$282,648
1
$72,450
APPLICATIONS DENIED
1
$127,930
8
$249,586
14
$298,653
2
$94,765
10
$325,161
3
$82,113
APPLICATIONS WITHDRAWN
0
$0
4
$235,052
6
$275,620
1
$106,590
4
$325,352
1
$51,380
FILES CLOSED FOR INCOMPLETENESS
0
$0
1
$62,230
2
$222,470
0
$0
1
$197,800
0
$0
Aggregated Statistics For Year 2005 (Based on 1 partial tract)
A) FHA, FSA/RHS & VA Home Purchase Loans
B) Conventional Home Purchase Loans
C) Refinancings
D) Home Improvement Loans
F) Non-occupant Loans on < 5 Family Dwellings (A B C & D)
G) Loans On Manufactured Home Dwelling (A B C & D)
Number
Average Value
Number
Average Value
Number
Average Value
Number
Average Value
Number
Average Value
Number
Average Value
LOANS ORIGINATED
5
$151,842
55
$236,363
36
$235,024
4
$121,370
55
$272,045
4
$76,898
APPLICATIONS APPROVED, NOT ACCEPTED
0
$0
7
$206,249
5
$220,152
1
$73,080
5
$253,188
1
$69,610
APPLICATIONS DENIED
0
$0
13
$208,675
13
$203,068
3
$60,897
9
$294,061
4
$60,608
APPLICATIONS WITHDRAWN
1
$104,900
5
$284,444
8
$190,801
1
$147,130
5
$303,024
1
$93,430
FILES CLOSED FOR INCOMPLETENESS
0
$0
1
$226,780
4
$223,605
0
$0
1
$248,920
1
$53,610
Aggregated Statistics For Year 2004 (Based on 1 partial tract)
A) FHA, FSA/RHS & VA Home Purchase Loans
B) Conventional Home Purchase Loans
C) Refinancings
D) Home Improvement Loans
F) Non-occupant Loans on < 5 Family Dwellings (A B C & D)
G) Loans On Manufactured Home Dwelling (A B C & D)
Number
Average Value
Number
Average Value
Number
Average Value
Number
Average Value
Number
Average Value
Number
Average Value
LOANS ORIGINATED
3
$149,707
49
$191,462
32
$163,279
3
$133,290
49
$196,199
4
$75,475
APPLICATIONS APPROVED, NOT ACCEPTED
0
$0
5
$200,594
4
$137,840
1
$30,850
5
$182,654
1
$80,010
APPLICATIONS DENIED
0
$0
8
$176,222
12
$134,921
2
$68,585
7
$203,086
4
$73,320
APPLICATIONS WITHDRAWN
0
$0
6
$200,143
7
$169,469
0
$0
6
$205,937
1
$53,340
FILES CLOSED FOR INCOMPLETENESS
0
$0
1
$246,080
2
$114,990
0
$0
1
$188,730
0
$0
Aggregated Statistics For Year 2003 (Based on 1 partial tract)
A) FHA, FSA/RHS & VA Home Purchase Loans
B) Conventional Home Purchase Loans
C) Refinancings
D) Home Improvement Loans
F) Non-occupant Loans on < 5 Family Dwellings (A B C & D)
Number
Average Value
Number
Average Value
Number
Average Value
Number
Average Value
Number
Average Value
LOANS ORIGINATED
4
$114,860
44
$134,148
55
$133,150
2
$17,735
54
$136,755
APPLICATIONS APPROVED, NOT ACCEPTED
0
$0
5
$117,260
5
$123,198
0
$0
4
$149,598
APPLICATIONS DENIED
1
$118,680
7
$116,459
17
$131,468
1
$36,630
8
$152,841
APPLICATIONS WITHDRAWN
0
$0
4
$157,398
7
$131,026
0
$0
5
$138,596
FILES CLOSED FOR INCOMPLETENESS
0
$0
1
$124,900
1
$201,890
0
$0
1
$237,450
Aggregated Statistics For Year 2002 (Based on 1 partial tract)
A) FHA, FSA/RHS & VA Home Purchase Loans
B) Conventional Home Purchase Loans
C) Refinancings
D) Home Improvement Loans
F) Non-occupant Loans on < 5 Family Dwellings (A B C & D)
Number
Average Value
Number
Average Value
Number
Average Value
Number
Average Value
Number
Average Value
LOANS ORIGINATED
4
$112,192
38
$115,006
41
$125,510
1
$34,670
43
$123,354
APPLICATIONS APPROVED, NOT ACCEPTED
0
$0
3
$96,930
4
$89,190
0
$0
2
$101,435
APPLICATIONS DENIED
1
$64,630
8
$81,678
11
$108,151
1
$32,890
5
$127,376
APPLICATIONS WITHDRAWN
0
$0
2
$184,690
6
$93,863
0
$0
2
$181,225
FILES CLOSED FOR INCOMPLETENESS
0
$0
1
$119,300
2
$102,415
0
$0
1
$145,710
Aggregated Statistics For Year 2001 (Based on 1 partial tract)
A) FHA, FSA/RHS & VA Home Purchase Loans
B) Conventional Home Purchase Loans
C) Refinancings
D) Home Improvement Loans
F) Non-occupant Loans on < 5 Family Dwellings (A B C & D)
Number
Average Value
Number
Average Value
Number
Average Value
Number
Average Value
Number
Average Value
LOANS ORIGINATED
4
$112,238
34
$101,830
38
$121,079
2
$43,830
35
$115,430
APPLICATIONS APPROVED, NOT ACCEPTED
0
$0
4
$74,720
4
$127,928
0
$0
3
$98,027
APPLICATIONS DENIED
0
$0
11
$58,949
11
$92,860
2
$13,425
3
$99,687
APPLICATIONS WITHDRAWN
0
$0
2
$100,500
5
$87,424
1
$14,670
1
$129,170
FILES CLOSED FOR INCOMPLETENESS
0
$0
1
$151,930
1
$112,460
0
$0
1
$124,280
Aggregated Statistics For Year 2000 (Based on 1 partial tract)
A) FHA, FSA/RHS & VA Home Purchase Loans
B) Conventional Home Purchase Loans
C) Refinancings
D) Home Improvement Loans
F) Non-occupant Loans on < 5 Family Dwellings (A B C & D)
Number
Average Value
Number
Average Value
Number
Average Value
Number
Average Value
Number
Average Value
LOANS ORIGINATED
2
$124,370
36
$107,016
12
$95,752
2
$30,180
25
$115,019
APPLICATIONS APPROVED, NOT ACCEPTED
1
$31,830
9
$80,563
2
$71,610
0
$0
3
$100,753
APPLICATIONS DENIED
1
$33,250
21
$61,282
9
$78,044
1
$18,940
3
$101,760
APPLICATIONS WITHDRAWN
0
$0
2
$123,525
4
$61,298
0
$0
1
$158,330
FILES CLOSED FOR INCOMPLETENESS
0
$0
1
$116,810
1
$70,680
0
$0
0
$0
Aggregated Statistics For Year 1999 (Based on 1 partial tract)
A) FHA, FSA/RHS & VA Home Purchase Loans
B) Conventional Home Purchase Loans
C) Refinancings
D) Home Improvement Loans
F) Non-occupant Loans on < 5 Family Dwellings (A B C & D)
Detailed PMIC statistics for the following Tracts:0004.00
2002 - 2018 National Fire Incident Reporting System (NFIRS) incidents
Based on the data from the years 2002 - 2018 the average number of fire incidents per year is 13. The highest number of reported fires - 27 took place in 2009, and the least - 7 in 2006. The data has a growing trend.
When looking into fire subcategories, the most incidents belonged to: Structure Fires (55.1%), and Outside Fires (27.1%).
Fire incident types reported to NFIRS in North Topsail Beach, NC


 Recent articles from our blog. Our writers, many of them Ph.D. graduates or candidates, create easy-to-read articles on a wide variety of topics.


 (19.8 miles


 Based on the data from the years 2002 - 2018 the average number of fire incidents per year is 13. The highest number of reported fires - 27 took place in 2009, and the least - 7 in 2006. The data has a growing trend.
 When looking into fire subcategories, the most incidents belonged to: Structure Fires (55.1%), and Outside Fires (27.1%).
