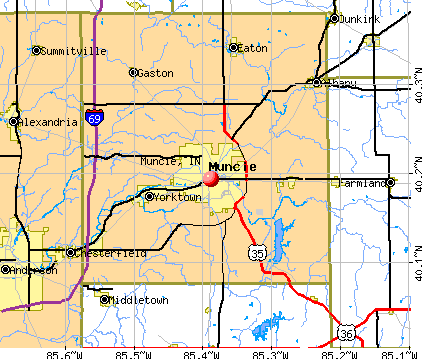
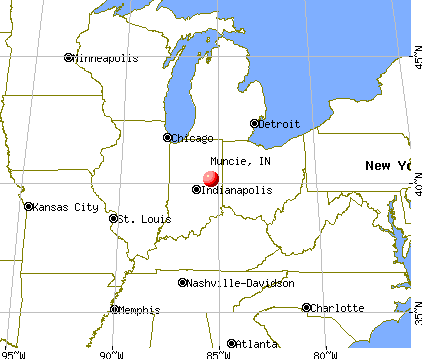
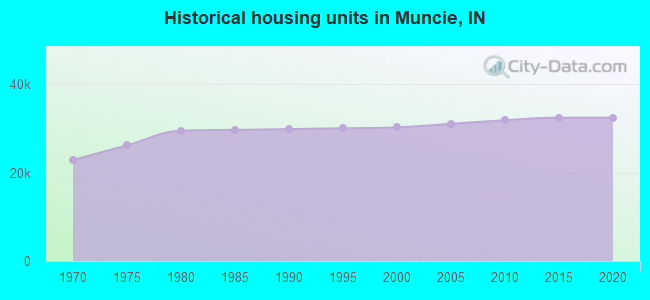
Muncie, Indiana

Muncie: A statute in down town muncie.
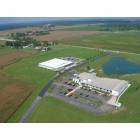
Muncie: Academy of Model Aeronautics Headquarters & museum
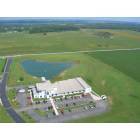
Muncie: Academy of Model Aeronautics Headquarters
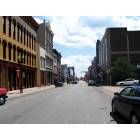
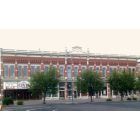
Muncie: Downtown Muncie
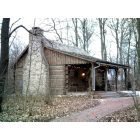
Muncie: Muncie, IN - Cabin in Minnetrista Gardens
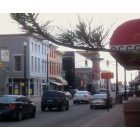
Muncie: Muncie, IN - Downtown
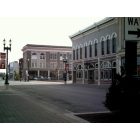
Muncie: Muncie, IN - Downtown Adams Street
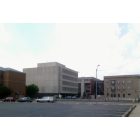
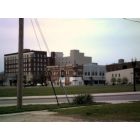
Muncie: Muncie, IN - Part of the Skyline
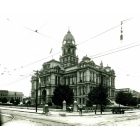
Muncie: The First Court House
Muncie: Muncie, IN - The Civic Theather
Muncie: Muncie, IN - Downtown
- see
53
more - add
your
Submit your own pictures of this city and show them to the world
- OSM Map
- General Map
- Google Map
- MSN Map
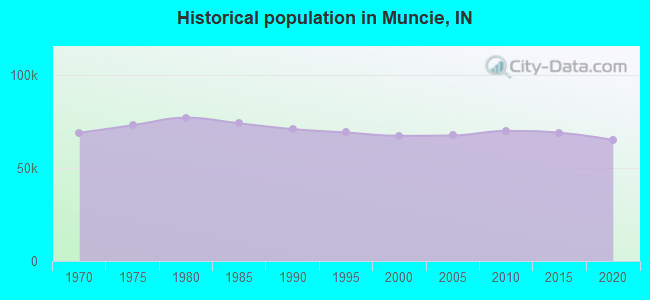
Population change since 2000: -3.5%
 |
| Males: 29,569 | |
| Females: 35,507 |
| Median resident age: | 30.8 years |
| Indiana median age: | 38.2 years |
Zip codes: 47302, 47304, 47305, 47306.
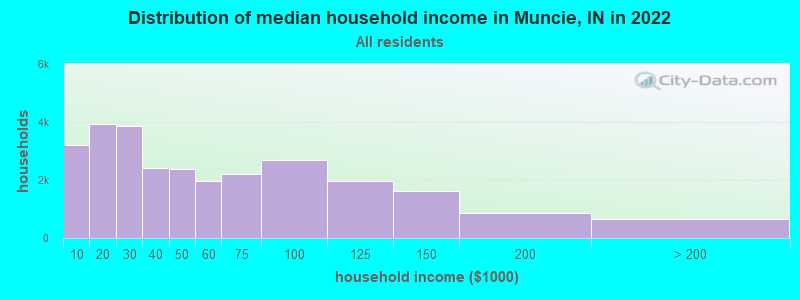
Muncie Zip Code Map| Muncie: | $40,968 |
| IN: | $66,785 |
Estimated per capita income in 2022: $25,226 (it was $15,814 in 2000)
Muncie city income, earnings, and wages data
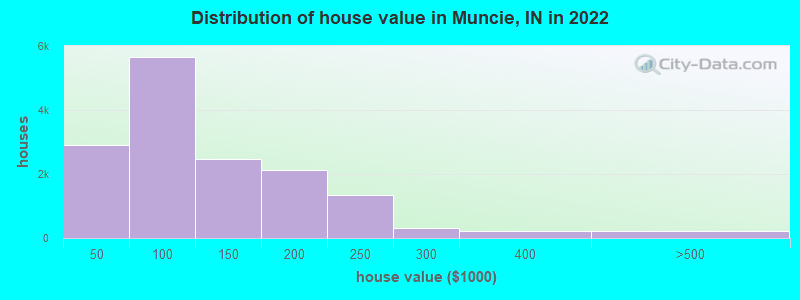
Estimated median house or condo value in 2022: $93,900 (it was $57,100 in 2000)
| Muncie: | $93,900 |
| IN: | $208,700 |
Mean prices in 2022: all housing units: $134,022; detached houses: $135,413; townhouses or other attached units: $148,349; in 2-unit structures: $151,156; in 3-to-4-unit structures: $174,884; in 5-or-more-unit structures: $204,964; mobile homes: $37,571
Median gross rent in 2022: $864.
(27.7% for White Non-Hispanic residents, 37.0% for Black residents, 29.5% for Hispanic or Latino residents, 38.5% for other race residents, 42.4% for two or more races residents)
Detailed information about poverty and poor residents in Muncie, IN


Compare current foreclosures in Muncie, IN:
| Photo | Address | Area | Beds / Baths | Price | Details |
|---|---|---|---|---|---|

|
#1
County Rd 300 S
Muncie, IN 47302
|
1,365 sq. feet
|
1 baths 3 beds |
$189,000
|
show details |

|
#2
E Cr 800s
Muncie, IN 47302
|
1,648 sq. feet
|
1 baths 3 beds |
$249,900
|
show details |

|
#3
W 10th St
Muncie, IN 47302
|
1,608 sq. feet
|
1 baths 2 beds |
$91,500
|
show details |

|
#4
W Wind Hill Dr
Muncie, IN 47304
|
2,278 sq. feet
|
3 baths 3 beds |
show details | |

|
#5
W 10th St
Muncie, IN 47302
|
1,972 sq. feet
|
2 baths 3 beds |
show details | |

|
#6
S Eaton Ave
Muncie, IN 47302
|
728 sq. feet
|
1 baths 2 beds |
show details | |

|
#7
E Robert St
Muncie, IN 47303
|
1,160 sq. feet
|
2 baths 3 beds |
show details | |

|
#8
W River Rd
Muncie, IN 47304
|
1,312 sq. feet
|
1 baths 3 beds |
show details | |

|
#9
S Victoria Dr
Muncie, IN 47302
|
1,025 sq. feet
|
1 baths 3 beds |
show details | |

|
#10
N Mulberry St
Muncie, IN 47305
|
1,020 sq. feet
|
1 baths 2 beds |
show details |
| Photo | Address | Area | Beds / Baths | Price | Details |
|---|---|---|---|---|---|

|
#11
W Bethel Ave
Muncie, IN 47304
|
1,792 sq. feet
|
1 baths 3 beds |
show details | |

|
#12
N Truitt Rd
Muncie, IN 47303
|
1,573 sq. feet
|
1 baths 2 beds |
show details | |

|
#13
N Bittersweet Ln
Muncie, IN 47304
|
984 sq. feet
|
1 baths 3 beds |
show details | |

|
#14
S Kathy Dr
Muncie, IN 47302
|
1,963 sq. feet
|
2 baths 3 beds |
show details | |

|
#15
N Janney Ave
Muncie, IN 47304
|
1,222 sq. feet
|
2 baths 3 beds |
show details | |

|
#16
S County Road 200 W
Muncie, IN 47302
|
2,600 sq. feet
|
3 baths 3 beds |
show details | |

|
#17
N Manngrove Ln
Muncie, IN 47303
|
960 sq. feet
|
2 baths 3 beds |
show details | |

|
#18
N Saybrook Ln
Muncie, IN 47304
|
1,644 sq. feet
|
2 baths 2 beds |
show details | |

|
#19
W Skyway Dr
Muncie, IN 47303
|
1,548 sq. feet
|
1 baths 3 beds |
show details | |

|
#20
N Little John Ln
Muncie, IN 47303
|
1,352 sq. feet
|
2 baths 3 beds |
show details |
| Photo | Address | Area | Beds / Baths | Price | Details |
|---|---|---|---|---|---|

|
#21
E Indiana Ave
Muncie, IN 47303
|
1,200 sq. feet
|
1 baths 4 beds |
show details | |

|
#22
E Cooper Rd
Muncie, IN 47303
|
1,744 sq. feet
|
2 baths 3 beds |
show details | |

|
#23
N Cherry Wood Ln
Muncie, IN 47304
|
2,757 sq. feet
|
3 baths 4 beds |
show details | |

|
#24
W Jackson St
Muncie, IN 47304
|
2,182 sq. feet
|
1 baths 3 beds |
show details | |

|
#25
S Ebright St
Muncie, IN 47302
|
1,174 sq. feet
|
1 baths 2 beds |
show details | |

|
#26
N Moore Rd
Muncie, IN 47304
|
3,260 sq. feet
|
2 baths 3 beds |
show details | |

|
#27
W Cade Cir
Muncie, IN 47304
|
1,400 sq. feet
|
1 baths 3 beds |
show details | |

|
#28
N Greenbriar Rd
Muncie, IN 47304
|
2,658 sq. feet
|
2 baths 3 beds |
show details | |

|
#29
S Walling Ave
Muncie, IN 47302
|
1,354 sq. feet
|
1 baths 3 beds |
show details | |

|
#30
S Fullhart Dr
Muncie, IN 47302
|
1,010 sq. feet
|
1 baths 2 beds |
show details |
| Photo | Address | Area | Beds / Baths | Price | Details |
|---|---|---|---|---|---|

|
#31
N Tillotson Ave
Muncie, IN 47304
|
1,772 sq. feet
|
3 baths 3 beds |
show details | |

|
#32
N Wheeling Ave
Muncie, IN 47304
|
2,256 sq. feet
|
2 baths 2 beds |
show details | |

|
#33
E 5th St
Muncie, IN 47302
|
864 sq. feet
|
1 baths 2 beds |
show details | |

|
#34
N County Road 700 W
Muncie, IN 47304
|
7,248 sq. feet
|
5 baths 5 beds |
show details | |

|
#35
S Hackley St
Muncie, IN 47302
|
1,000 sq. feet
|
1 baths 2 beds |
show details | |

|
#36
E Jackson St
Muncie, IN 47305
|
2,374 sq. feet
|
1 baths 4 beds |
show details | |

|
#37
S Gilman Ave
Muncie, IN 47302
|
840 sq. feet
|
1 baths 2 beds |
show details | |

|
#38
N Brindale Dr
Muncie, IN 47304
|
1,852 sq. feet
|
2 baths 3 beds |
show details | |

|
#39
S Shipley St
Muncie, IN 47302
|
1,226 sq. feet
|
1 baths 3 beds |
show details | |

|
#40
S Chippewa Ln
Muncie, IN 47302
|
1,008 sq. feet
|
1 baths 3 beds |
show details |
| Photo | Address | Area | Beds / Baths | Price | Details |
|---|---|---|---|---|---|

|
#41
N Ball Ave
Muncie, IN 47304
|
1,948 sq. feet
|
1 baths 2 beds |
show details | |

|
#42
W Coventry Dr
Muncie, IN 47304
|
2,153 sq. feet
|
3 baths 4 beds |
show details | |

|
#43
W Weber Dr
Muncie, IN 47303
|
876 sq. feet
|
1 baths 2 beds |
show details | |

|
#44
N Bittersweet Ln
Muncie, IN 47304
|
1,752 sq. feet
|
1 baths 3 beds |
show details | |

|
#45
W Surrey Dr
Muncie, IN 47304
|
1,540 sq. feet
|
2 baths 3 beds |
show details | |

|
#46
W Riggin Rd
Muncie, IN 47304
|
2,008 sq. feet
|
2 baths 3 beds |
show details | |

|
#47
S Ebright St
Muncie, IN 47302
|
994 sq. feet
|
1 baths 3 beds |
show details | |

|
#48
W Sun Valley Pkwy
Muncie, IN 47303
|
1,711 sq. feet
|
2 baths 3 beds |
show details | |

|
#49
N Redding Rd
Muncie, IN 47304
|
1,925 sq. feet
|
3 baths 3 beds |
show details | |

|
Check over 1 million property listings on Foreclosure.com!
|
browse all offers | |||


- 51,00178.3%White alone
- 4,6267.1%Black alone
- 4,6107.1%Two or more races
- 2,4893.8%Hispanic
- 1,4062.2%Asian alone
- 2790.4%Other race alone
- 400.06%American Indian alone
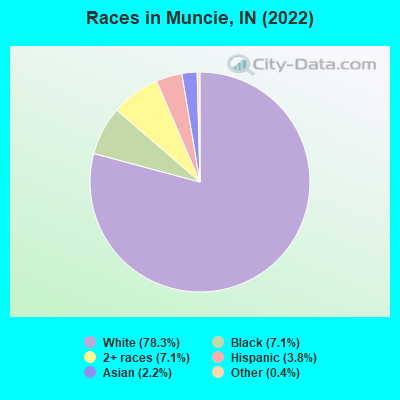
Races in Muncie detailed stats: ancestries, foreign born residents, place of birth
According to our research of Indiana and other state lists, there were 208 registered sex offenders living in Muncie, Indiana as of July 02, 2024.
The ratio of all residents to sex offenders in Muncie is 337 to 1.
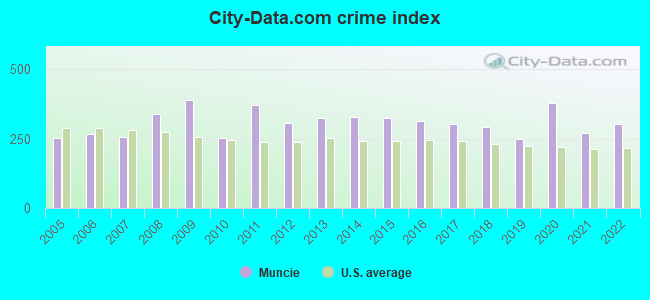
The City-Data.com crime index weighs serious crimes and violent crimes more heavily. Higher means more crime, U.S. average is 246.1. It adjusts for the number of visitors and daily workers commuting into cities.
- means the value is smaller than the state average.- means the value is about the same as the state average.
- means the value is bigger than the state average.
- means the value is much bigger than the state average.
Crime rate in Muncie detailed stats: murders, rapes, robberies, assaults, burglaries, thefts, arson
Full-time law enforcement employees in 2021, including police officers: 102 (94 officers - 87 male; 7 female).
| Officers per 1,000 residents here: | 1.40 |
| Indiana average: | 2.16 |
 Recent articles from our blog. Our writers, many of them Ph.D. graduates or candidates, create easy-to-read articles on a wide variety of topics.

 | Someone please talk to me about Muncie. (22 replies) |
| Muncie vs New Castle for retirement? (7 replies) |
| Ranking Indy's mid sized satellite cities: Terre Haute, Lafayette, Kokomo, Marion, Muncie, Anderson, Richmond (49 replies) |
| Considering a move to the Warsaw area in Indiana (13 replies) |
| Living in north suburbs and commute to Muncie? (21 replies) |
| Muncie "Munsee" (15 replies) |
Latest news from Muncie, IN collected exclusively by city-data.com from local newspapers, TV, and radio stations
Ancestries: German (14.6%), American (12.0%), English (9.0%), Irish (8.1%), European (4.7%), Italian (1.6%).
Current Local Time: EST time zone
Incorporated in 1865
Elevation: 952 feet
Land area: 24.2 square miles.
Population density: 2,691 people per square mile (average).
1,659 residents are foreign born (1.5% Asia, 0.4% Latin America).
| This city: | 2.5% |
| Indiana: | 5.6% |
Median real estate property taxes paid for housing units with mortgages in 2022: $1,172 (0.9%)
Median real estate property taxes paid for housing units with no mortgage in 2022: $708 (0.9%)
Nearest city with pop. 200,000+: Indianapolis, IN  (48.9 miles , pop. 781,870).
Nearest city with pop. 1,000,000+: Chicago, IL (165.2 miles , pop. 2,896,016).
Nearest cities:
), ), ), Latitude: 40.19 N, Longitude: 85.39 W
Daytime population change due to commuting: +9,273 (+14.2%)
Workers who live and work in this city: 21,538 (72.2%)
Area code: 765

Muncie, Indiana accommodation & food services, waste management - Economy and Business Data
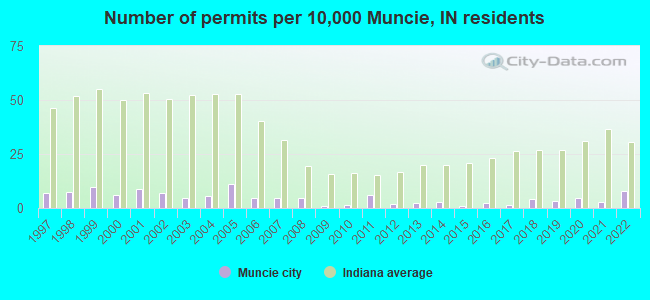
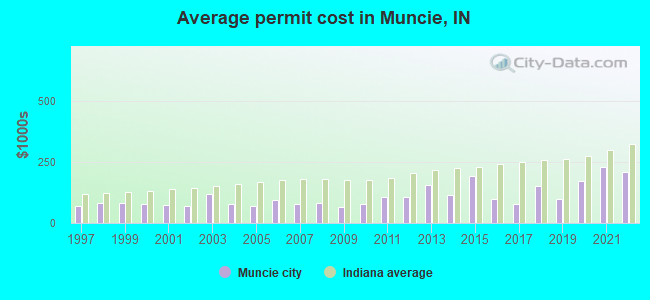
Single-family new house construction building permits:
- 2022: 53 buildings, average cost: $208,100
- 2021: 18 buildings, average cost: $230,000
- 2020: 32 buildings, average cost: $174,400
- 2019: 23 buildings, average cost: $99,400
- 2018: 28 buildings, average cost: $152,600
- 2017: 9 buildings, average cost: $79,900
- 2016: 17 buildings, average cost: $99,300
- 2015: 7 buildings, average cost: $192,800
- 2014: 18 buildings, average cost: $113,900
- 2013: 15 buildings, average cost: $157,000
- 2012: 12 buildings, average cost: $104,600
- 2011: 40 buildings, average cost: $108,200
- 2010: 10 buildings, average cost: $79,100
- 2009: 6 buildings, average cost: $65,800
- 2008: 32 buildings, average cost: $80,900
- 2007: 30 buildings, average cost: $79,300
- 2006: 32 buildings, average cost: $93,200
- 2005: 76 buildings, average cost: $69,900
- 2004: 39 buildings, average cost: $76,500
- 2003: 32 buildings, average cost: $117,600
- 2002: 48 buildings, average cost: $68,800
- 2001: 58 buildings, average cost: $74,600
- 2000: 41 buildings, average cost: $77,700
- 1999: 65 buildings, average cost: $81,700
- 1998: 49 buildings, average cost: $82,800
- 1997: 48 buildings, average cost: $68,000
| Here: | 3.3% |
| Indiana: | 2.8% |
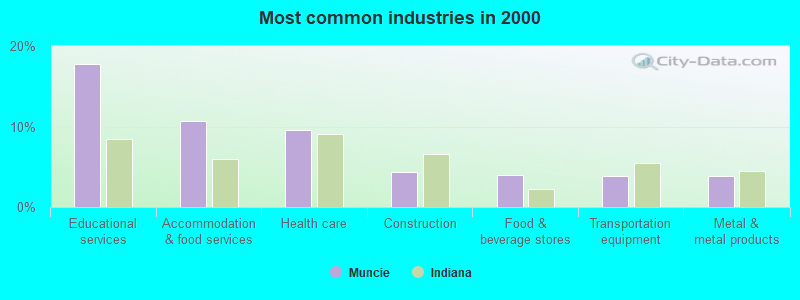
- Educational services (17.8%)
- Accommodation & food services (10.6%)
- Health care (9.6%)
- Construction (4.4%)
- Food & beverage stores (4.0%)
- Transportation equipment (3.9%)
- Metal & metal products (3.9%)
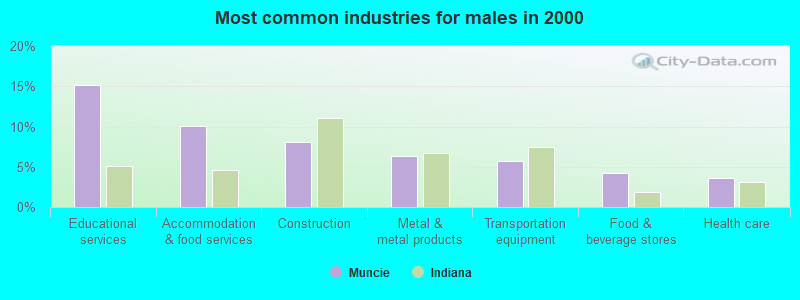
- Educational services (15.1%)
- Accommodation & food services (10.0%)
- Construction (8.0%)
- Metal & metal products (6.3%)
- Transportation equipment (5.7%)
- Food & beverage stores (4.3%)
- Health care (3.6%)
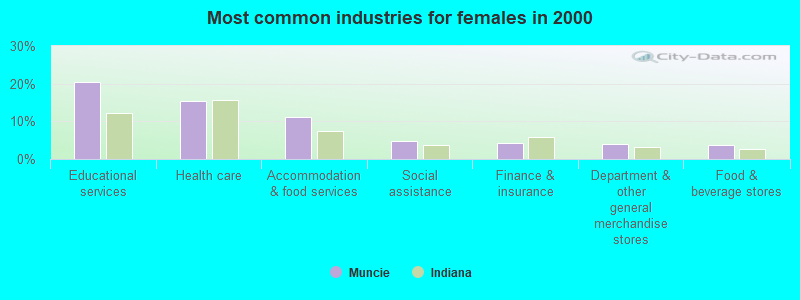
- Educational services (20.4%)
- Health care (15.5%)
- Accommodation & food services (11.2%)
- Social assistance (4.7%)
- Finance & insurance (4.3%)
- Department & other general merchandise stores (4.0%)
- Food & beverage stores (3.6%)
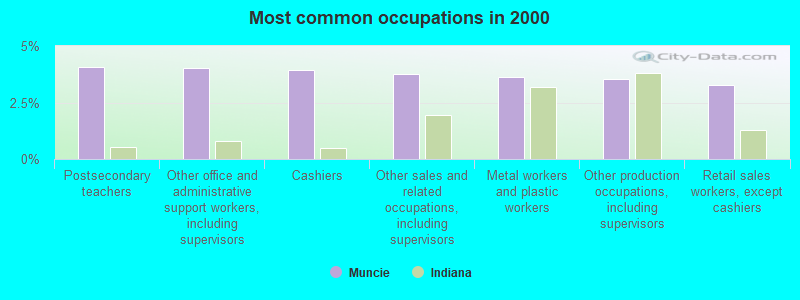
- Postsecondary teachers (4.1%)
- Other office and administrative support workers, including supervisors (4.0%)
- Cashiers (3.9%)
- Other sales and related occupations, including supervisors (3.8%)
- Metal workers and plastic workers (3.6%)
- Other production occupations, including supervisors (3.5%)
- Retail sales workers, except cashiers (3.3%)

- Metal workers and plastic workers (6.2%)
- Driver/sales workers and truck drivers (4.8%)
- Other production occupations, including supervisors (4.4%)
- Material recording, scheduling, dispatching, and distributing workers (4.2%)
- Postsecondary teachers (4.1%)
- Other sales and related occupations, including supervisors (3.8%)
- Electrical equipment mechanics and other installation, maintenance, and repair workers, including supervisors (3.8%)
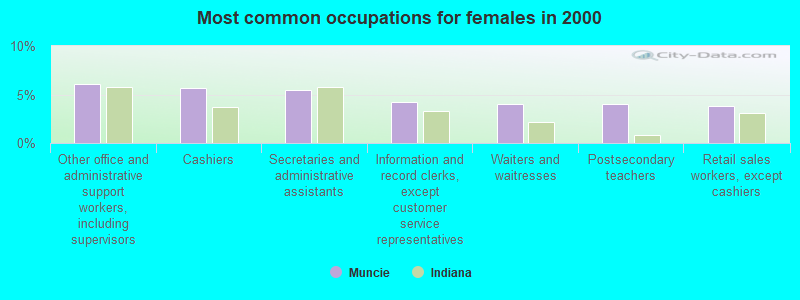
- Other office and administrative support workers, including supervisors (6.1%)
- Cashiers (5.6%)
- Secretaries and administrative assistants (5.5%)
- Information and record clerks, except customer service representatives (4.3%)
- Waiters and waitresses (4.0%)
- Postsecondary teachers (4.0%)
- Retail sales workers, except cashiers (3.8%)
Average climate in Muncie, Indiana
Based on data reported by over 4,000 weather stations


|
|

(lower is better)
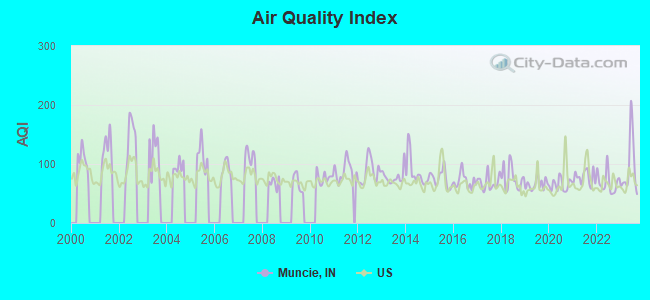
Air Quality Index (AQI) level in 2023 was 93.8. This is worse than average.
| City: | 93.8 |
| U.S.: | 72.6 |
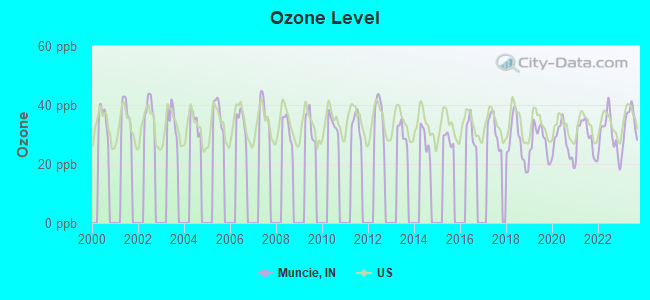
Ozone [ppb] level in 2023 was 33.4. This is about average. Closest monitor was 10.6 miles away from the city center.
| City: | 33.4 |
| U.S.: | 33.3 |
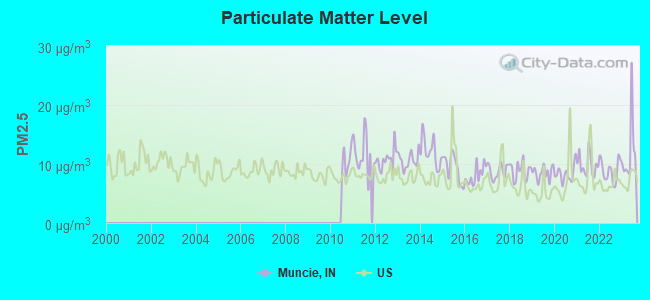
Particulate Matter (PM2.5) [µg/m3] level in 2023 was 12.0. This is significantly worse than average. Closest monitor was 0.4 miles away from the city center.
| City: | 12.0 |
| U.S.: | 8.1 |
Tornado activity:
Muncie-area historical tornado activity is slightly above Indiana state average. It is 117% greater than the overall U.S. average.
On 4/3/1974, a category F4 (max. wind speeds 207-260 mph) tornado 11.7 miles away from the Muncie city center killed one person and injured 12 people and caused between $5,000,000 and $50,000,000 in damages.
On 4/3/1974, a category F4 tornado 15.1 miles away from the city center injured 17 people and caused between $5,000,000 and $50,000,000 in damages.
Earthquake activity:
Muncie-area historical earthquake activity is significantly above Indiana state average. It is 25% greater than the overall U.S. average.On 4/18/2008 at 09:36:59, a magnitude 5.4 (5.1 MB, 4.8 MS, 5.4 MW, 5.2 MW, Class: Moderate, Intensity: VI - VII) earthquake occurred 179.9 miles away from the city center
On 7/27/1980 at 18:52:21, a magnitude 5.2 (5.1 MB, 4.7 MS, 5.0 UK, 5.2 UK) earthquake occurred 157.8 miles away from the city center
On 4/18/2008 at 09:36:59, a magnitude 5.2 (5.2 MW, Depth: 8.9 mi) earthquake occurred 179.9 miles away from the city center
On 6/10/1987 at 23:48:54, a magnitude 5.1 (4.9 MB, 4.4 MS, 4.6 MS, 5.1 LG) earthquake occurred 163.6 miles away from the city center
On 7/12/1986 at 08:19:37, a magnitude 4.5 (4.5 MB, Class: Light, Intensity: IV - V) earthquake occurred 58.6 miles away from Muncie center
On 6/18/2002 at 17:37:15, a magnitude 5.0 (4.3 MB, 4.6 MW, 5.0 LG) earthquake occurred 199.4 miles away from Muncie center
Magnitude types: regional Lg-wave magnitude (LG), body-wave magnitude (MB), surface-wave magnitude (MS), moment magnitude (MW)
Natural disasters:
The number of natural disasters in Delaware County (15) is near the US average (15).Major Disasters (Presidential) Declared: 10
Emergencies Declared: 4
Causes of natural disasters: Storms: 7, Floods: 6, Tornadoes: 6, Snows: 2, Winter Storms: 2, Blizzard: 1, Hurricane: 1, Ice Storm: 1, Other: 1 (Note: some incidents may be assigned to more than one category).

Main business address for: FIRST MERCHANTS CORP (NATIONAL COMMERCIAL BANKS), MUTUALFIRST FINANCIAL INC (STATE COMMERCIAL BANKS).
Hospitals in Muncie:
- CARDINAL SERVICE MGMT, INC (201 N MANNGROVE DR)
- CARDINAL SERVICE MGMT, INC (4312 W HUMMINGBIRD WAY)
- HILLCROFT SERVICES INC (423 E BERKLEY AVE)
- HILLCROFT SERVICES INC (1803 N ELM STREET)
- HILLCROFT SERVICES INC (321 S MARTIN ST)
- INDIANA UNIVERSITY HEALTH BALL MEMORIAL HOSPITAL (Voluntary non-profit - Private, provides emergency services, 2401 UNIVERSITY AVE)
- RENAISSANCE SPECIALTY HOSPITAL (3400 W COMMUNITY DRIVE)
- VOCA CORPORATION OF INDIANA (4516 W WALDEN DRIVE)
- VOCA CORPORATION OF INDIANA (228 N VINE ST)
- VOCA CORPORATION OF INDIANA (3715 W GODMAN)
Airports and heliports located in Muncie:
- Delaware County Regional Airport (MIE) (Runways: 2, Commercial Ops: 15, Air Taxi Ops: 1,017, Itinerant Ops: 15,789, Local Ops: 9,868, Military Ops: 411)
- Reese Airport (7I2) (Runways: 1, Itinerant Ops: 537, Local Ops: 4,829)
- Carroll's Airpark Airport (IN56) (Runways: 1)
- Diamond P Field Airport (02IN) (Runways: 1)
- Ball Memorial Hospital Heliport (IN74)
College/University in Muncie:
Other colleges/universities with over 2000 students near Muncie:
- Anderson University (about 16 miles; Anderson, IN; Full-time enrollment: 2,378)
- Taylor University (about 20 miles; Upland, IN; FT enrollment: 2,272)
- Indiana Wesleyan University (about 27 miles; Marion, IN; FT enrollment: 13,681)
- Indiana University-East (about 35 miles; Richmond, IN; FT enrollment: 2,867)
- Indiana University-Kokomo (about 44 miles; Kokomo, IN; FT enrollment: 2,500)
- ITT Technical Institute-Indianapolis (about 48 miles; Indianapolis, IN; FT enrollment: 4,765)
- Butler University (about 49 miles; Indianapolis, IN; FT enrollment: 4,388)
Public high schools in Muncie:
- MUNCIE CENTRAL HIGH SCHOOL (Students: 1,146, Location: 801 N WALNUT ST, Grades: 9-12)
- DELTA HIGH SCHOOL (Students: 921, Location: 3400 E SR 28, Grades: 9-12)
- DELTA MIDDLE SCHOOL (Students: 670, Location: 9800 N CR 200 E, Grades: 6-9)
- BURRIS LABORATORY SCHOOL (Students: 514, Location: 2000 UNIVERSITY AVE, Grades: KG-12)
- COWAN HIGH SCHOOL (Students: 318, Location: 9401 S NOTTINGHAM, Grades: 7-12)
- IN ACA FOR SCI MATH & HUMANITIES (Students: 295, Location: WAGONER HALLS BALL ST UNIV, Grades: 11-12)
- YOUTH OPPORTUNITY CENTER (Students: 131, Location: 3700 W KILGORE AVE, Grades: 3-12)
- MUNCIE AREA CAREER CENTER (Location: 2500 N ELGIN, Grades: 11-12)
Private high school in Muncie:
- HERITAGE HALL CHRISTIAN SCHOOL (Students: 175, Location: 6401 W RIVER RD, Grades: PK-12)
Biggest public elementary/middle schools in Muncie:
- NORTHSIDE MIDDLE SCHOOL (Students: 833, Location: 2400 W BETHEL AVE, Grades: 6-8)
- ROYERTON ELEMENTARY SCHOOL (Students: 534, Location: 1401 E ROYERTON RD, Grades: KG-5)
- SUTTON ELEMENTARY SCHOOL (Students: 500, Location: 3100 E MEMORIAL DR, Grades: KG-5)
- GRISSOM ELEMENTARY SCHOOL (Students: 465, Location: 3201 S MACEDONIA AVE, Grades: KG-5)
- SOUTH VIEW ELEMENTARY SCHOOL (Students: 464, Location: 2100 S FRANKLIN, Grades: KG-5)
- MITCHELL ELEMENTARY SCHOOL (Students: 404, Location: 2809 W PURDUE AVE, Grades: KG-5)
- STORER ELEMENTARY SCHOOL (Students: 380, Location: 3211 MANSFIELD DR, Grades: KG-5)
- COWAN ELEMENTARY SCHOOL (Students: 369, Location: 1000 W CR 600 S, Grades: KG-6)
- WEST VIEW ELEMENTARY SCHOOL (Students: 311, Location: 3401 W GILBERT ST, Grades: KG-5)
- LONGFELLOW ELEMENTARY SCHOOL (Students: 304, Location: 1900 E CENTENNIAL, Grades: KG-5)
Private elementary/middle schools in Muncie:
Library in Muncie:
User-submitted facts and corrections:
- Add to High Schools: Burris Laboratory School (K-12) Add to rivers: White River (by far the largest, most significant river) Add to city Parks: Prairie Creek (the largest, most used city park)
- Muncie also has the zip code 47306
- A notable citizen of Muncie was Allen Frazier Leavell, Muncie Central. He played for the Houston Rockets for 10 years. added by lenee
- Downtown Muncie official website: http://www.munciedowntown.com
Points of interest:
Notable locations in Muncie: Southway Plaza (A), John B And June M Scheumann Stadium (B), Muncie Fire Department (C), Renaissance Specialty Hospital of Central Indiana (D), Meridian Services (E). Display/hide their locations on the map
Shopping Centers: Northwest Plaza Shopping Center (1), Muncie Mall (2), Northwest Plaza Shopping Center (3). Display/hide their locations on the map
Main business address in Muncie include: FIRST MERCHANTS CORP (A), MUTUALFIRST FINANCIAL INC (B). Display/hide their locations on the map
Churches in Muncie include: Saint Pauls Church (A), Temple Church (B), Westside Church (C). Display/hide their locations on the map
Cemeteries: Beech Grove Cemetery (1), Elm Ridge Memorial Park (2). Display/hide their locations on the map
Lake: Phillips Lake (A). Display/hide its location on the map
Streams, rivers, and creeks: Truitt Ditch (A), Hamilton Ditch (B), Muncie Creek (C). Display/hide their locations on the map
Parks in Muncie include: Rose Park (1), Thomas Park (2), Guthrie Park (3), Westside Park (4), Cowing Park (5), McCullouch Park (6), McCulloch Park (7), Tuhey Park (8), Riverview Park (9). Display/hide their locations on the map
Tourist attractions: Academy of Model Aeronautics - Offices- Museum Offices (5151 East Memorial Drive) (1), Ball State University - Museum of Art (2000 West University Avenue) (2), Delaware County Historical Society (Museums; 120 East Washington Street) (3), Ball State University (Museums; 2000 West University Avenue) (4), Muncie Children's Museum (Cultural Attractions- Events- & Facilities; 515 South High Street) (5), Minnetrista Cultural Center - General Offices (Cultural Attractions- Events- & Facilities; 1200 North Minnetrista Parkway) (6), Sultan's Castle Amusmt (Amusement & Theme Parks; 3501 North Granville Avenue) (7), Escapades Family Fun Center (Amusement & Theme Parks; 4241 West Williamsburg Boulevard) (8), Video Services (Amusement & Theme Parks; 1520 South High Street) (9). Display/hide their approximate locations on the map
Hotels: Ball State University (2000 West University Avenue) (1), Bestway Inn (4000 North Broadway Avenue) (2), Days Inn Muncie (3509 North Everbrook Lane) (3), Radisson Hotel Roberts (420 South High Street) (4), Lees Inn & Suites Muncie (3302 North Everbrook Lane) (5), Fairfield Inn of Muncie (4011 West Bethel Avenue) (6), Best Western Muncie (3011 West Bethel Avenue) (7), Amerihost Inn - Muncie (3011 W Bethel Ave) (8), Charlie's Bar & Grill (3400 South Madison Street) (9). Display/hide their approximate locations on the map
Courts: Delaware County Offices - Juvenile Court (3600 West Kilgore Avenue) (1), Delaware County Offices - Court- Court Administrator (100 West Washington Street) (2), Delaware County Offices - Court- Circuit Court V- Judge Lennington W (100 West Washington Street) (3), Delaware County Offices - Community Corrections- Court Substance Abuse Program-Dcc (115 South Walnut Street) (4), Delaware County Offices - Court- Circuit Court Iv (100 West Washington Street) (5), Delaware County Offices - Court- Circuit Court I (100 West Washington Street) (6), Muncie City - City Court (300 North High Street) (7), Delaware County Offices - Title Iv-D Support Court (100 West Main Street Rm 103) (8), Delaware County Offices - Court- Circuit Court Ii- Judge Dailey Richa (100 West Washington Street) (9). Display/hide their approximate locations on the map
Birthplace of: Maurice Douglass - Football player, Matt Painter - Basketball player-coach, Jack Beeson - Composer, Doug Wead - Writer, Frank Thomas (American football) - College football player, Adam Lind - Baseball player, Mary Jane Croft - Actress, Mike DeBord - Football coach, Ray Boltz - Singer-songwriter, Benjamin Victor Cohen - Politician.
Drinking water stations with addresses in Muncie and their reported violations in the past:
PRAIRIE CREEK WEST CAMPGROUND (Population served: 308, Groundwater):Past monitoring violations:PRAIRIE CREEK PARK BEACH AREA (Population served: 308, Groundwater):
- One regular monitoring violation
Past monitoring violations:DELAWARE ACRES MHC (Population served: 305, Groundwater):
- One routine major monitoring violation
- One regular monitoring violation
Past health violations:SHAWNEE HEIGHTS BAPTIST CHURCH (Population served: 247, Groundwater):
- MCL, Monthly (TCR) - In JUN-2006, Contaminant: Coliform. Follow-up actions: St Public Notif requested (JUN-14-2006), St Boil Water Order (JUN-14-2006), St Violation/Reminder Notice (JUN-14-2006), St Public Notif received (MAY-24-2007), St Compliance achieved (OCT-26-2009)
Past monitoring violations:COUNTRY ACRES MOBILE HOME PARK (Population served: 150, Groundwater):
- 6 routine major monitoring violations
Past monitoring violations:RIVERVIEW UNITED BAPTIST (Population served: 91, Groundwater):
- Lead Consumer Notice - In JAN-01-2014, Contaminant: Lead and Copper Rule. Follow-up actions: St Violation/Reminder Notice (APR-08-2014)
- Follow-up Or Routine LCR Tap M/R - In OCT-01-2012, Contaminant: Lead and Copper Rule. Follow-up actions: St Public Notif requested (DEC-18-2012), St Violation/Reminder Notice (DEC-18-2012), St Public Notif received (FEB-26-2013), St Violation/Reminder Notice (FEB-28-2013)
- Follow-up Or Routine LCR Tap M/R - In OCT-01-2011, Contaminant: Lead and Copper Rule. Follow-up actions: St Public Notif requested (DEC-08-2011), St Violation/Reminder Notice (DEC-08-2011), St Public Notif received (JAN-18-2012), St Violation/Reminder Notice (FEB-28-2013), St Compliance achieved (NOV-21-2013)
- Initial, Follow-up, or Routine Source Water M/R - In JAN-01-2001, Contaminant: Lead and Copper Rule. Follow-up actions: St Violation/Reminder Notice (APR-20-2001), St Other (JUL-27-2001), St Formal NOV issued (JAN-04-2002), St AO (w/penalty) issued (NOV-25-2002), St Compliance achieved (2 times from NOV-21-2006 to SEP-06-2007)
Past monitoring violations:PRAIRIE CREEK GARAGE AREA (Population served: 38, Groundwater):
- One routine major monitoring violation
Past monitoring violations:SILER ADDITION WAY (Population served: 33, Groundwater):
- One routine major monitoring violation
Past monitoring violations:
- 6 routine major monitoring violations
- One regular monitoring violation
Drinking water stations with addresses in Muncie that have no violations reported:
- PLEASANT GROVE UNITED METHODIST CHURCH (Population served: 40, Primary Water Source Type: Groundwater)
| This city: | 2.2 people |
| Indiana: | 2.5 people |
| This city: | 50.2% |
| Whole state: | 66.9% |
| This city: | 8.1% |
| Whole state: | 6.9% |
Likely homosexual households (counted as self-reported same-sex unmarried-partner households)
- Lesbian couples: 0.4% of all households
- Gay men: 0.3% of all households
People in group quarters in Muncie in 2010:
- 6,798 people in college/university student housing
- 744 people in nursing facilities/skilled-nursing facilities
- 297 people in local jails and other municipal confinement facilities
- 192 people in emergency and transitional shelters (with sleeping facilities) for people experiencing homelessness
- 173 people in group homes intended for adults
- 157 people in residential treatment centers for juveniles (non-correctional)
- 60 people in correctional facilities intended for juveniles
- 56 people in other noninstitutional facilities
- 20 people in residential treatment centers for adults
- 7 people in mental (psychiatric) hospitals and psychiatric units in other hospitals
- 2 people in in-patient hospice facilities
- 2 people in workers' group living quarters and job corps centers
People in group quarters in Muncie in 2000:
- 5,043 people in college dormitories (includes college quarters off campus)
- 574 people in nursing homes
- 169 people in local jails and other confinement facilities (including police lockups)
- 158 people in homes for abused, dependent, and neglected children
- 109 people in short-term care, detention or diagnostic centers for delinquent children
- 104 people in other noninstitutional group quarters
- 26 people in mental (psychiatric) hospitals or wards
- 14 people in homes for the mentally retarded
- 4 people in religious group quarters
Banks with branches in Muncie (2011 data):
- First Merchants Bank National Association: 9 branches. Info updated 2012/02/13: Bank assets: $4,154.9 mil, Deposits: $3,154.7 mil, local headquarters, positive income, Commercial Lending Specialization, 89 total offices, Holding Company: First Merchants Corporation
- MutualBank: 7 branches. Info updated 2012/01/19: Bank assets: $1,424.6 mil, Deposits: $1,167.2 mil, local headquarters, positive income, Mortgage Lending Specialization, 32 total offices
- Old National Bank: Muncie Southside Branch, Medical Pavilion Branch, West Jackson Street Branch, Mcgalliard Road Branch, Muncie Branch, Morrison Road Branch. Info updated 2011/08/01: Bank assets: $8,467.9 mil, Deposits: $6,653.1 mil, headquarters in Evansville, IN, positive income, 195 total offices, Holding Company: Old National Bancorp
- STAR Financial Bank: Broadway Branch, Jackson Street Branch, Muncie South Branch, High Street Branch, Everbrook/Mcgalliard Branch. Info updated 2006/11/03: Bank assets: $1,622.5 mil, Deposits: $1,346.4 mil, headquarters in Fort Wayne, IN, positive income, Commercial Lending Specialization, 48 total offices, Holding Company: Star Financial Group, Inc.
- JPMorgan Chase Bank, National Association: Tillotson Square Branch, Southway Plaza Branch, Northwest Plaza Shopping Center Bran, Lyndenbrook Place Branch, Muncie Main Branch. Info updated 2011/11/10: Bank assets: $1,811,678.0 mil, Deposits: $1,190,738.0 mil, headquarters in Columbus, OH, positive income, International Specialization, 5577 total offices, Holding Company: Jpmorgan Chase & Co.
- Flagstar Bank, FSB: Muncie Branch at 4801 West Clara Lane, branch established on 2001/09/26. Info updated 2011/07/21: Bank assets: $13,623.5 mil, Deposits: $7,802.8 mil, headquarters in Troy, MI, negative income in the last year, Mortgage Lending Specialization, 135 total offices
- Woodforest National Bank: Muncie In Walmart Branch at 1501 East 29th Street, branch established on 2008/09/22. Info updated 2011/05/10: Bank assets: $3,488.9 mil, Deposits: $3,097.6 mil, headquarters in Houston, TX, positive income, Commercial Lending Specialization, 766 total offices, Holding Company: Woodforest Financial Group Employee Stock Ownership Plan (With 401(K) Provisions)
For population 15 years and over in Muncie:
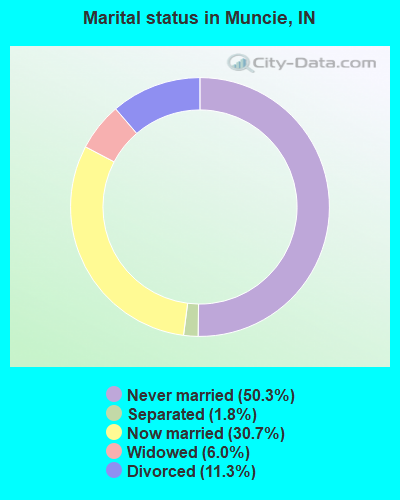
- Never married: 50.3%
- Now married: 30.7%
- Separated: 1.8%
- Widowed: 6.0%
- Divorced: 11.3%
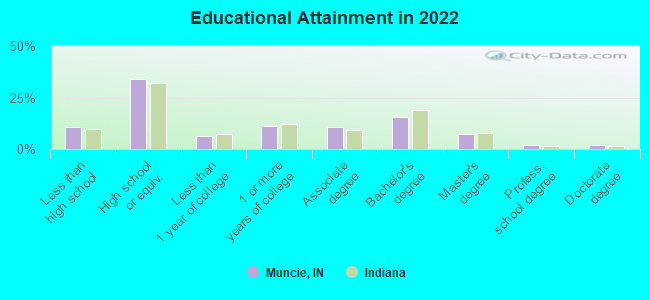
For population 25 years and over in Muncie:
- High school or higher: 89.4%
- Bachelor's degree or higher: 27.0%
- Graduate or professional degree: 11.2%
- Unemployed: 9.7%
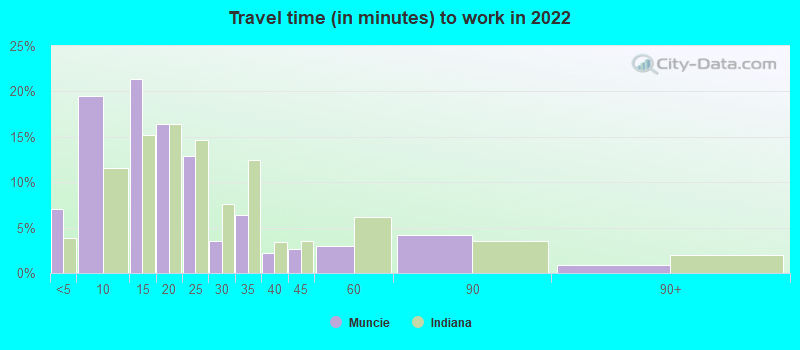
- Mean travel time to work (commute): 16.9 minutes
| Here: | 10.5 |
| Indiana average: | 11.3 |
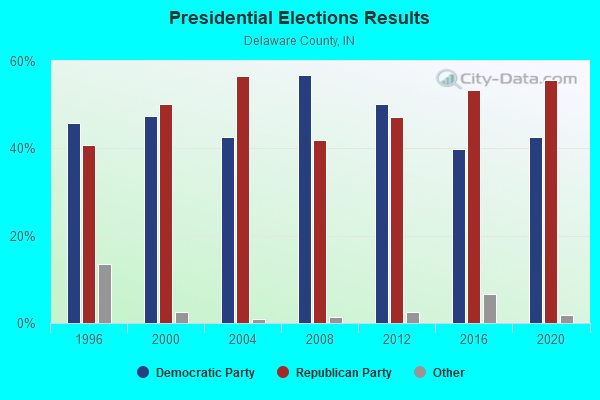
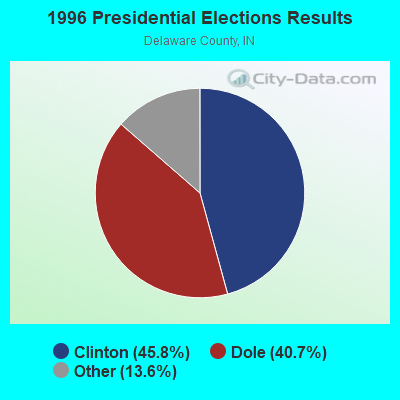
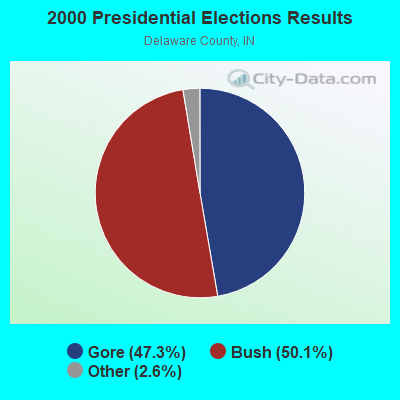
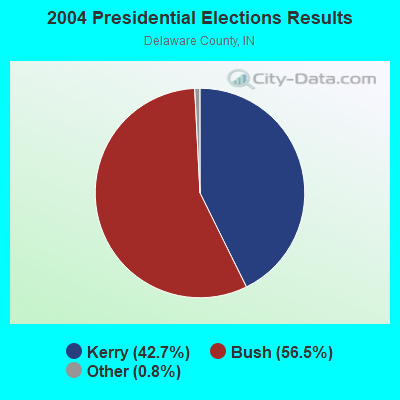
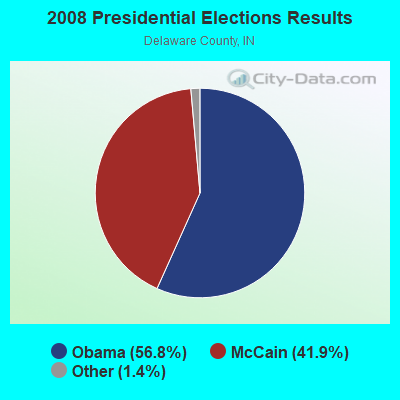
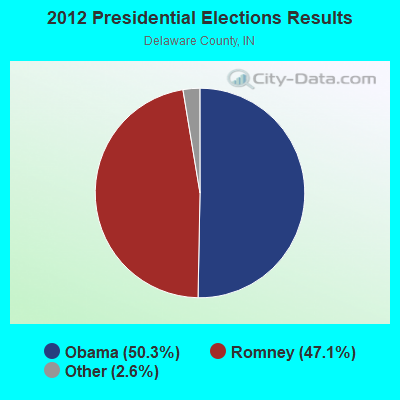
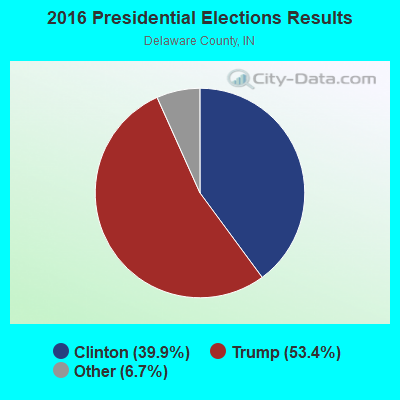
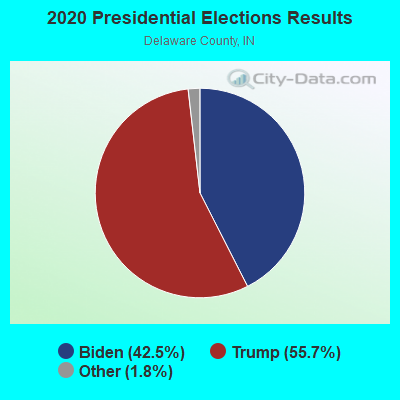
Graphs represent county-level data. Detailed 2008 Election Results
Religion statistics for Muncie, IN (based on Delaware County data)
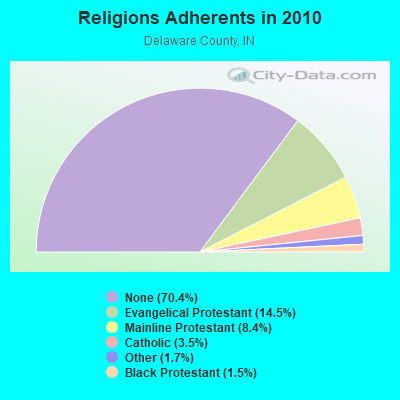
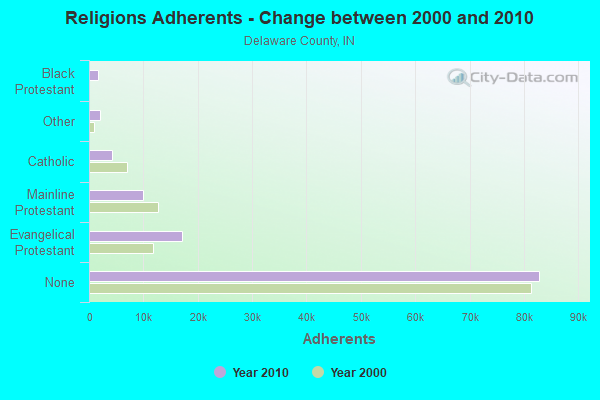
| Religion | Adherents | Congregations |
|---|---|---|
| Evangelical Protestant | 17,042 | 98 |
| Mainline Protestant | 9,876 | 40 |
| Catholic | 4,171 | 3 |
| Other | 1,992 | 7 |
| Black Protestant | 1,741 | 9 |
| None | 82,849 | - |
Food Environment Statistics:
| This county: | 1.30 / 10,000 pop. |
| Indiana: | 1.73 / 10,000 pop. |
| This county: | 0.17 / 10,000 pop. |
| Indiana: | 0.21 / 10,000 pop. |
| Delaware County: | 0.52 / 10,000 pop. |
| Indiana: | 0.50 / 10,000 pop. |
| Here: | 4.52 / 10,000 pop. |
| State: | 3.57 / 10,000 pop. |
| Delaware County: | 6.77 / 10,000 pop. |
| Indiana: | 6.78 / 10,000 pop. |
| Here: | 10.0% |
| State: | 9.2% |
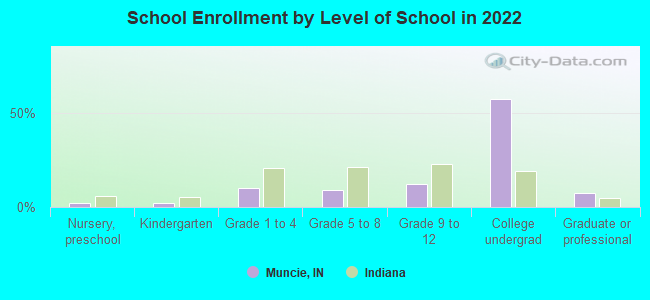
| Here: | 31.3% |
| Indiana: | 29.0% |
| This county: | 11.9% |
| State: | 14.3% |
Health and Nutrition:
| This city: | 50.8% |
| State: | 49.3% |
| Muncie: | 49.6% |
| Indiana: | 46.2% |
| This city: | 28.3 |
| Indiana: | 28.7 |
| Muncie: | 19.9% |
| Indiana: | 21.3% |
| Muncie: | 11.2% |
| Indiana: | 10.6% |
| Muncie: | 6.9 |
| State: | 6.8 |
| Here: | 31.2% |
| Indiana: | 33.9% |
| Here: | 58.6% |
| Indiana: | 56.1% |
| Muncie: | 80.1% |
| State: | 78.7% |
More about Health and Nutrition of Muncie, IN Residents
| Local government employment and payroll (March 2022) | |||||
| Function | Full-time employees | Monthly full-time payroll | Average yearly full-time wage | Part-time employees | Monthly part-time payroll |
|---|---|---|---|---|---|
| Firefighters | 102 | $614,827 | $72,333 | 0 | $0 |
| Police Protection - Officers | 96 | $542,628 | $67,829 | 0 | $0 |
| Transit | 62 | $271,744 | $52,596 | 4 | $4,686 |
| Sewerage | 60 | $255,686 | $51,137 | 0 | $0 |
| Other Government Administration | 40 | $121,035 | $36,311 | 4 | $4,617 |
| Solid Waste Management | 37 | $149,916 | $48,621 | 4 | $6,452 |
| Other and Unallocable | 23 | $93,664 | $48,868 | 0 | $0 |
| Streets and Highways | 21 | $69,148 | $39,513 | 2 | $2,033 |
| Police - Other | 18 | $52,999 | $35,333 | 1 | $55 |
| Parks and Recreation | 16 | $57,483 | $43,112 | 12 | $16,295 |
| Water Supply | 14 | $63,752 | $54,645 | 0 | $0 |
| Fire - Other | 13 | $62,551 | $57,739 | 1 | $52 |
| Financial Administration | 6 | $25,360 | $50,720 | 0 | $0 |
| Housing and Community Development (Local) | 5 | $19,300 | $46,320 | 0 | $0 |
| Health | 5 | $30,861 | $74,066 | 20 | $18,049 |
| Judicial and Legal | 0 | $0 | 8 | $5,572 | |
| Totals for Government | 518 | $2,430,954 | $56,316 | 56 | $57,811 |
Muncie government finances - Expenditure in 2021 (per resident):
- Construction - Sewerage: $6,649,000 ($102.17)
General - Other: $120,000 ($1.84)
- Current Operations - General - Other: $27,388,000 ($420.86)
Sewerage: $11,444,000 ($175.86)
Police Protection: $10,487,000 ($161.15)
Local Fire Protection: $9,725,000 ($149.44)
Transit Utilities: $7,492,000 ($115.13)
Solid Waste Management: $5,702,000 ($87.62)
Financial Administration: $3,807,000 ($58.50)
Regular Highways: $3,268,000 ($50.22)
Health - Other: $3,080,000 ($47.33)
Parks and Recreation: $2,690,000 ($41.34)
Housing and Community Development: $2,110,000 ($32.42)
Judicial and Legal Services: $721,000 ($11.08)
General Public Buildings: $696,000 ($10.70)
Central Staff Services: $586,000 ($9.00)
Miscellaneous Commercial Activities - Other: $460,000 ($7.07)
Parking Facilities: $118,000 ($1.81)
Elementary and Secondary Education: $33,000 ($0.51)
Electric Utilities: $25,000 ($0.38)
- General - Interest on Debt: $8,003,000 ($122.98)
- Other Capital Outlay - Police Protection: $915,000 ($14.06)
Local Fire Protection: $414,000 ($6.36)
Parks and Recreation: $395,000 ($6.07)
Sewerage: $62,000 ($0.95)
General Public Building: $12,000 ($0.18)
General - Other: $4,000 ($0.06)
- Total Salaries and Wages: $3,384,000 ($52.00)
Muncie government finances - Revenue in 2021 (per resident):
- Charges - Sewerage: $36,616,000 ($562.67)
Other: $2,791,000 ($42.89)
Parks and Recreation: $939,000 ($14.43)
Miscellaneous Commercial Activities: $132,000 ($2.03)
Parking Facilities: $17,000 ($0.26)
- Federal Intergovernmental - Transit Utilities: $4,235,000 ($65.08)
- Local Intergovernmental - Highways: $1,694,000 ($26.03)
Other: $716,000 ($11.00)
- Miscellaneous - Fines and Forfeits: $1,011,000 ($15.54)
General Revenue - Other: $426,000 ($6.55)
Interest Earnings: $139,000 ($2.14)
Rents: $103,000 ($1.58)
Donations From Private Sources: $63,000 ($0.97)
Sale of Property: $2,000 ($0.03)
- Revenue - Transit Utilities: $158,000 ($2.43)
- State Intergovernmental - Other: $11,755,000 ($180.63)
Sewerage: $7,682,000 ($118.05)
Highways: $2,732,000 ($41.98)
Transit Utilities: $1,482,000 ($22.77)
General Local Government Support: $291,000 ($4.47)
- Tax - Property: $22,838,000 ($350.94)
Other: $821,000 ($12.62)
Public Utilities Sales: $290,000 ($4.46)
Other License: $198,000 ($3.04)
Occupation and Business License - Other: $109,000 ($1.67)
Muncie government finances - Debt in 2021 (per resident):
- Long Term Debt - Beginning Outstanding - Unspecified Public Purpose: $200,052,000 ($3074.13)
Outstanding Unspecified Public Purpose: $200,052,000 ($3074.13)
- Short Term Debt Outstanding - Beginning: $1,374,000 ($21.11)
Muncie government finances - Cash and Securities in 2021 (per resident):
- Bond Funds - Cash and Securities: $1,682,000 ($25.85)
- Other Funds - Cash and Securities: $54,230,000 ($833.33)
- Sinking Funds - Cash and Securities: $11,926,000 ($183.26)
| Businesses in Muncie, IN | ||||
| Name | Count | Name | Count | |
|---|---|---|---|---|
| ALDI | 2 | LensCrafters | 1 | |
| AT&T | 1 | Little Caesars Pizza | 1 | |
| Advance Auto Parts | 3 | Long John Silver's | 1 | |
| Aeropostale | 1 | Lowe's | 1 | |
| American Eagle Outfitters | 1 | Macy's | 1 | |
| Applebee's | 1 | Marriott | 1 | |
| Arby's | 3 | MasterBrand Cabinets | 8 | |
| AutoZone | 2 | Maurices | 1 | |
| Baskin-Robbins | 1 | McDonald's | 4 | |
| Bath & Body Works | 1 | Meijer | 1 | |
| Best Western | 1 | Menards | 1 | |
| Blockbuster | 1 | Motherhood Maternity | 1 | |
| Buffalo Wild Wings | 1 | New Balance | 1 | |
| Burger King | 3 | Nike | 3 | |
| CVS | 4 | Olive Garden | 1 | |
| Carson Pirie Scott | 1 | Outback | 1 | |
| Casual Male XL | 1 | Outback Steakhouse | 1 | |
| Catherines | 1 | Pac Sun | 1 | |
| Charlotte Russe | 1 | Panera Bread | 1 | |
| Chevrolet | 1 | Papa John's Pizza | 2 | |
| Chick-Fil-A | 1 | Payless | 2 | |
| Chuck E. Cheese's | 1 | Penske | 1 | |
| Comfort Inn | 1 | PetSmart | 1 | |
| Dairy Queen | 3 | Pizza Hut | 3 | |
| Days Inn | 1 | Plato's Closet | 1 | |
| Deb | 1 | Qdoba Mexican Grill | 1 | |
| Decora Cabinetry | 2 | Quiznos | 1 | |
| Discount Tire | 1 | RadioShack | 3 | |
| Domino's Pizza | 1 | Red Lobster | 1 | |
| Dressbarn | 1 | Ruby Tuesday | 1 | |
| FedEx | 13 | Rue21 | 1 | |
| Finish Line | 1 | SAS Shoes | 2 | |
| Foot Locker | 1 | Sears | 3 | |
| Ford | 1 | Shoe Carnival | 1 | |
| GNC | 2 | Spencer Gifts | 1 | |
| GameStop | 2 | Sprint Nextel | 1 | |
| Gap | 1 | Staples | 1 | |
| Goodwill | 1 | Starbucks | 3 | |
| H&R Block | 4 | Steak 'n Shake | 1 | |
| Haworth | 1 | Subway | 9 | |
| Hilton | 1 | Super 8 | 1 | |
| Hobby Lobby | 1 | T-Mobile | 6 | |
| Holiday Inn | 1 | T.J.Maxx | 1 | |
| Honda | 1 | Taco Bell | 3 | |
| Hot Topic | 1 | Target | 1 | |
| Hyundai | 1 | Toyota | 1 | |
| IHOP | 1 | Toys"R"Us | 1 | |
| JCPenney | 1 | U-Haul | 3 | |
| Jamba Juice | 1 | UPS | 21 | |
| Jimmy John's | 2 | Vans | 2 | |
| Jones New York | 4 | Verizon Wireless | 2 | |
| Journeys | 1 | Victoria's Secret | 1 | |
| KFC | 3 | Volkswagen | 1 | |
| Kincaid | 1 | Walgreens | 4 | |
| Kmart | 1 | Walmart | 2 | |
| Kohl's | 1 | Wendy's | 3 | |
| La-Z-Boy | 1 | Wet Seal | 1 | |
| Lane Bryant | 1 | YMCA | 4 | |
| Lane Furniture | 1 | |||
Strongest AM radio stations in Muncie:
- WXFN (1340 AM; 1 kW; MUNCIE, IN; Owner: MUNCIE SABRECOM, INC.)
- WIBC (1070 AM; 50 kW; INDIANAPOLIS, IN; Owner: EMMIS RADIO LICENSE CORPORATION)
- WOWO (1190 AM; 50 kW; FORT WAYNE, IN; Owner: PATHFINDER COMMUNICATIONS CORPORATION)
- WLW (700 AM; 50 kW; CINCINNATI, OH; Owner: JACOR BROADCASTING CORPORATION)
- WLHN (990 AM; 0 kW; MUNCIE, IN; Owner: ELECTRONIC APPLICATIONS RADIO SERVICE)
- WSAI (1530 AM; 50 kW; CINCINNATI, OH; Owner: JACOR BROADCASTING CORPORATION)
- WTVN (610 AM; 50 kW; COLUMBUS, OH; Owner: CITICASTERS LICENSES, L.P.)
- WHAS (840 AM; 50 kW; LOUISVILLE, KY; Owner: CLEAR CHANNEL BROADCASTING LICENSES, INC.)
- WHBU (1240 AM; 1 kW; ANDERSON, IN; Owner: INDIANA SABRECOM, INC.)
- WNDE (1260 AM; 5 kW; INDIANAPOLIS, IN; Owner: CAPSTAR TX LIMITED PARTNERSHIP)
- WIOU (1350 AM; 5 kW; KOKOMO, IN; Owner: MID-AMERICA RADIO GROUP, INC.)
- WLS (890 AM; 50 kW; CHICAGO, IL; Owner: WLS, INC.)
- WSCR (670 AM; 50 kW; CHICAGO, IL; Owner: INFINITY BROADCASTING OPERATIONS, INC.)
Strongest FM radio stations in Muncie:
- WLBC-FM (104.1 FM; MUNCIE, IN; Owner: MUNCIE SABRECOM, INC.)
- WERK (104.9 FM; MUNCIE, IN; Owner: INDIANA SABRECOM, INC.)
- WBST (92.1 FM; MUNCIE, IN; Owner: BALL STATE UNIVERSITY)
- W291AH (106.1 FM; MUNCIE, IN; Owner: TAYLOR UNIVERSITY BROADCASTING, INC.)
- WMDH-FM (102.5 FM; NEW CASTLE, IN; Owner: CITADEL BROADCASTING COMPANY)
- WWDS (90.5 FM; MUNCIE, IN; Owner: DELAWARE COMMUNITY SCHOOL CORP.)
- WWHI (91.3 FM; MUNCIE, IN; Owner: MUNCIE COMMUNITY SCHOOLS)
- WHTY (93.5 FM; HARTFORD CITY, IN; Owner: INDIANA SABRECOM, INC.)
- WHTI (96.7 FM; ALEXANDRIA, IN; Owner: INDIANA SABRECOM, INC.)
- WBSB (89.5 FM; ANDERSON, IN; Owner: BALL STATE UNIVERSITY)
- WGNR-FM (97.9 FM; ANDERSON, IN; Owner: THE MOODY BIBLE INSTITUTE OF CHICAGO)
- WQME (98.7 FM; ANDERSON, IN; Owner: ANDERSON UNIVERSITY, INC.)
- WNOU (93.1 FM; INDIANAPOLIS, IN; Owner: EMMIS RADIO LICENSE CORPORATION)
- WFMS (95.5 FM; INDIANAPOLIS, IN; Owner: WFMS LICO, INC)
- WYXB (105.7 FM; INDIANAPOLIS, IN; Owner: EMMIS RADIO LICENSE CORPORATION)
- WZPL (99.5 FM; GREENFIELD, IN; Owner: MYSTAR COMMUNICATIONS CORPORATION)
- WMRI (106.9 FM; MARION, IN; Owner: MID-AMERICA RADIO OF INDIANA, INC.)
- WBSH (91.1 FM; HAGERSTOWN, IN; Owner: BALL STATE UNIVERSITY)
TV broadcast stations around Muncie:
- WIPB (Channel 49; MUNCIE, IN; Owner: BALL STATE UNIVERSITY)
- WMUN-LP (Channel 26; MUNCIE, IN; Owner: FULL GOSPEL FELLOWSHIP, MUNCIE IND.)
- WNDY-TV (Channel 23; MARION, IN; Owner: UPN STATIONS GROUP INC.)
- WTTK (Channel 29; KOKOMO, IN; Owner: TRIBUNE BROADCAST HOLDINGS, INC.)
- WIWU-LP (Channel 51; MARION, IN; Owner: IWU COMMUNICATIONS, INC.)
- National Bridge Inventory (NBI) Statistics
- 120Number of bridges
- 1,089ft / 332mTotal length
- $17,030,000Total costs
- 602,573Total average daily traffic
- 53,047Total average daily truck traffic
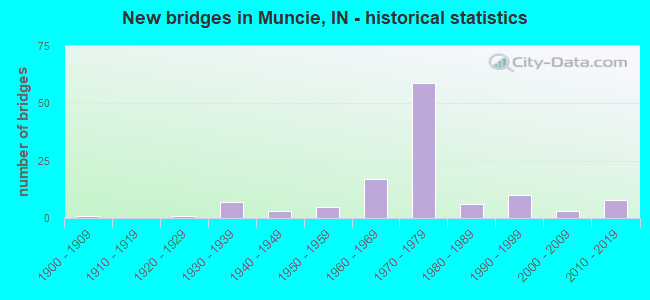
- New bridges - historical statistics
- 11900-1909
- 11920-1929
- 71930-1939
- 31940-1949
- 51950-1959
- 171960-1969
- 591970-1979
- 61980-1989
- 101990-1999
- 32000-2009
- 82010-2019
FCC Registered Antenna Towers: 422 (See the full list of FCC Registered Antenna Towers)
FCC Registered Commercial Land Mobile Towers: 4 (See the full list of FCC Registered Commercial Land Mobile Towers in Muncie, IN)
FCC Registered Private Land Mobile Towers: 4 (See the full list of FCC Registered Private Land Mobile Towers)
FCC Registered Broadcast Land Mobile Towers: 62 (See the full list of FCC Registered Broadcast Land Mobile Towers)
FCC Registered Microwave Towers: 52 (See the full list of FCC Registered Microwave Towers in this town)
FCC Registered Paging Towers: 12 (See the full list of FCC Registered Paging Towers)
FCC Registered Maritime Coast & Aviation Ground Towers: 5 (See the full list of FCC Registered Maritime Coast & Aviation Ground Towers)
FCC Registered Amateur Radio Licenses: 435 (See the full list of FCC Registered Amateur Radio Licenses in Muncie)
FAA Registered Aircraft Manufacturers and Dealers: 3 (See the full list of FAA Registered Manufacturers and Dealers in Muncie)
FAA Registered Aircraft: 57 (See the full list of FAA Registered Aircraft)
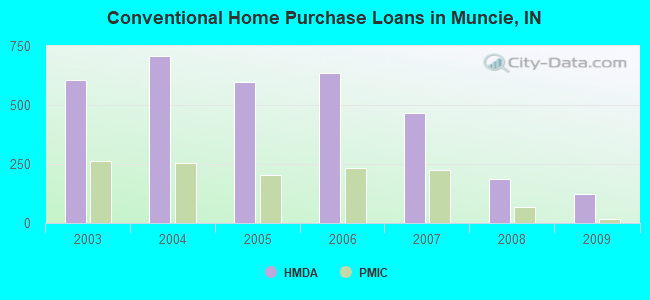
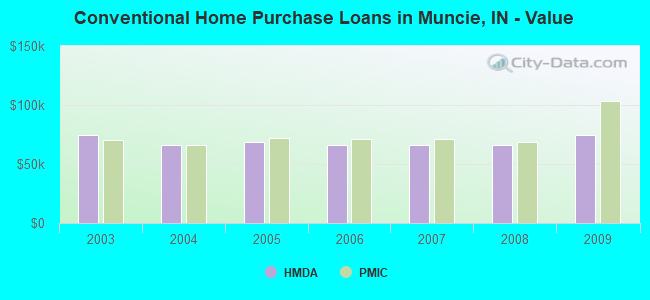
| Home Mortgage Disclosure Act Aggregated Statistics For Year 2009 (Based on 15 full and 6 partial tracts) | ||||||||||||||
| A) FHA, FSA/RHS & VA Home Purchase Loans | B) Conventional Home Purchase Loans | C) Refinancings | D) Home Improvement Loans | E) Loans on Dwellings For 5+ Families | F) Non-occupant Loans on < 5 Family Dwellings (A B C & D) | G) Loans On Manufactured Home Dwelling (A B C & D) | ||||||||
|---|---|---|---|---|---|---|---|---|---|---|---|---|---|---|
| Number | Average Value | Number | Average Value | Number | Average Value | Number | Average Value | Number | Average Value | Number | Average Value | Number | Average Value | |
| LOANS ORIGINATED | 169 | $77,090 | 123 | $74,993 | 398 | $80,395 | 43 | $24,067 | 5 | $1,234,800 | 69 | $52,643 | 6 | $51,985 |
| APPLICATIONS APPROVED, NOT ACCEPTED | 6 | $78,702 | 8 | $148,086 | 48 | $67,831 | 9 | $29,011 | 0 | $0 | 6 | $71,728 | 1 | $18,140 |
| APPLICATIONS DENIED | 31 | $72,129 | 32 | $44,101 | 220 | $79,535 | 47 | $15,409 | 1 | $60,000 | 19 | $45,768 | 11 | $43,635 |
| APPLICATIONS WITHDRAWN | 12 | $80,879 | 9 | $67,966 | 148 | $80,610 | 3 | $29,370 | 0 | $0 | 19 | $67,589 | 2 | $70,825 |
| FILES CLOSED FOR INCOMPLETENESS | 3 | $64,327 | 2 | $44,310 | 27 | $100,470 | 0 | $0 | 0 | $0 | 0 | $0 | 0 | $0 |
Detailed mortgage data for all 22 tracts in Muncie, IN
| Private Mortgage Insurance Companies Aggregated Statistics For Year 2009 (Based on 9 full and 5 partial tracts) | ||||||
| A) Conventional Home Purchase Loans | B) Refinancings | C) Non-occupant Loans on < 5 Family Dwellings (A & B) | ||||
|---|---|---|---|---|---|---|
| Number | Average Value | Number | Average Value | Number | Average Value | |
| LOANS ORIGINATED | 16 | $103,290 | 12 | $109,160 | 0 | $0 |
| APPLICATIONS APPROVED, NOT ACCEPTED | 11 | $68,620 | 12 | $77,541 | 2 | $42,980 |
| APPLICATIONS DENIED | 5 | $96,572 | 8 | $102,729 | 0 | $0 |
| APPLICATIONS WITHDRAWN | 3 | $77,000 | 4 | $117,962 | 0 | $0 |
| FILES CLOSED FOR INCOMPLETENESS | 2 | $79,080 | 0 | $0 | 0 | $0 |
2002 - 2017 National Fire Incident Reporting System (NFIRS) incidents
- Fire incident types reported to NFIRS in Muncie, IN
- 2,68145.2%Outside Fires
- 2,09735.4%Structure Fires
- 76412.9%Mobile Property/Vehicle Fires
- 3866.5%Other
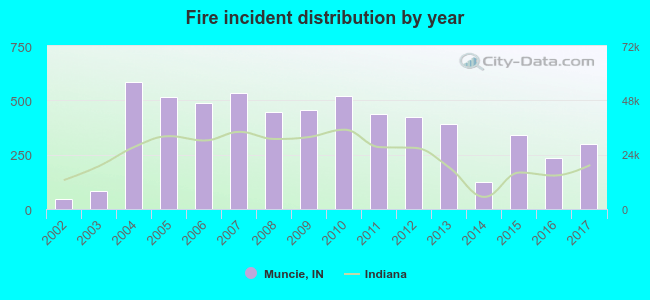 Based on the data from the years 2002 - 2017 the average number of fire incidents per year is 370. The highest number of reported fire incidents - 586 took place in 2004, and the least - 48 in 2002. The data has a rising trend.
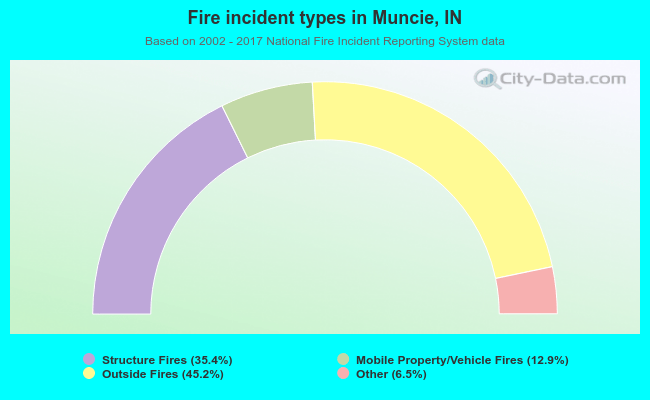 When looking into fire subcategories, the most reports belonged to: Outside Fires (45.2%), and Structure Fires (35.4%).
Fire-safe hotels and motels in Muncie, Indiana:
- America's Best Value Inn, 3400 S Madison St, Muncie, Indiana 47302 , Phone: (765) 288-1911, Fax: (765) 282-9458
- The Roberts Hotel, 420 S High St, Muncie, Indiana 47305 , Phone: (800) 213-9323, Fax: (765) 747-0067
- Days In-muncie/ball State, 3509 N Everbrook Ln, Muncie, Indiana 47304 , Phone: (765) 288-2311, Fax: (765) 288-2311
- Super 8 Motel, 3601 W Fox RDG Ln, Muncie, Indiana 47304 , Phone: (765) 286-4333, Fax: (765) 286-4333
- Baymont Inn, 3400 N Chadam Ln, Muncie, Indiana 47304 , Phone: (765) 284-4200, Fax: (765) 284-4200
- Hampton Inn And Suites, 4220 W Bethel Ave, Muncie, Indiana 47304 , Phone: (765) 288-8500, Fax: (765) 288-8505
- Comfort Inn & Suites, 3400 N Marleon Dr, Muncie, Indiana 47304 , Phone: (765) 587-0294, Fax: (765) 587-0298
- Courtyard Muncie at Horizon Convention Center, 601 S High St, Muncie, Indiana 47305 , Phone: (765) 287-8550, Fax: (765) 287-8560
| Most common first names in Muncie, IN among deceased individuals | ||
| Name | Count | Lived (average) |
|---|---|---|
| Mary | 829 | 79.4 years |
| William | 721 | 72.8 years |
| Robert | 660 | 70.6 years |
| John | 612 | 73.5 years |
| James | 585 | 71.0 years |
| Charles | 584 | 73.0 years |
| George | 338 | 75.0 years |
| Helen | 287 | 80.3 years |
| Dorothy | 257 | 77.7 years |
| Ruth | 250 | 80.2 years |
| Most common last names in Muncie, IN among deceased individuals | ||
| Last name | Count | Lived (average) |
|---|---|---|
| Smith | 411 | 74.0 years |
| Jones | 262 | 74.9 years |
| Miller | 259 | 76.0 years |
| Brown | 247 | 72.8 years |
| Davis | 244 | 74.3 years |
| Johnson | 227 | 73.5 years |
| Williams | 207 | 74.5 years |
| Wilson | 140 | 74.4 years |
| Moore | 130 | 77.0 years |
| Clark | 127 | 77.1 years |
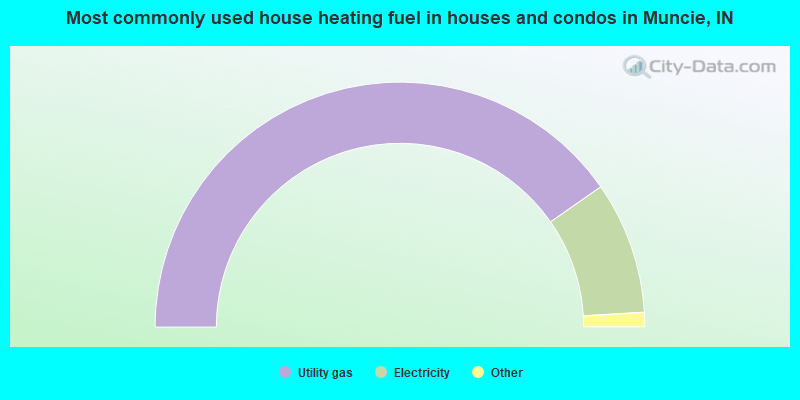
- 80.6%Utility gas
- 17.5%Electricity
- 1.2%Bottled, tank, or LP gas
- 0.6%Fuel oil, kerosene, etc.
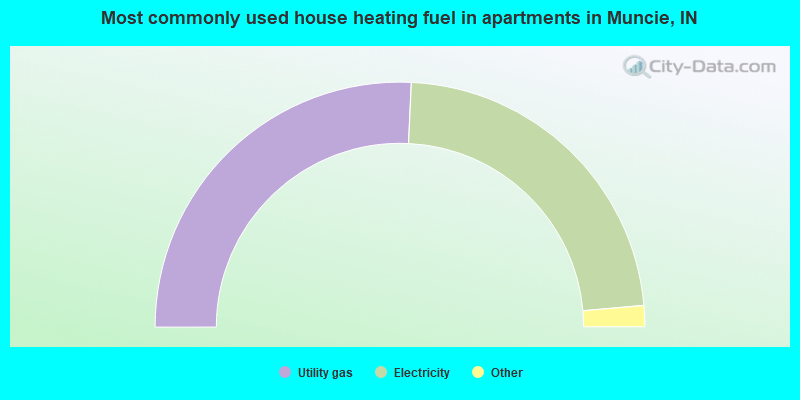
- 51.5%Utility gas
- 45.7%Electricity
- 1.9%Bottled, tank, or LP gas
- 0.4%No fuel used
- 0.2%Wood
- 0.1%Fuel oil, kerosene, etc.
- 0.1%Other fuel
Muncie compared to Indiana state average:
- Median household income below state average.
- Median house value below state average.
- Hispanic race population percentage below state average.
- Median age significantly below state average.
- Foreign-born population percentage below state average.
- Renting percentage above state average.
- Length of stay since moving in below state average.
- Number of college students above state average.
Muncie on our top lists:
- #2 on the list of "Top 101 cities with largest percentage of females in occupations: installation, maintenance, and repair occupations (population 50,000+)"
- #13 on the list of "Top 101 cities with the highest percentage of English-only speaking households, population 50,000+"
- #14 on the list of "Top 101 cities with the largest wind speed differences during a year (population 50,000+)"
- #19 on the list of "Top 101 cities with largest percentage of females in occupations: food preparation and serving related occupations (population 50,000+)"
- #23 on the list of "Top 101 cities with largest percentage of males in occupations: healthcare support occupations (population 50,000+)"
- #24 on the list of "Top 101 cities with the largest city-data.com crime index decrease from 2011 to 2012 (population 50,000+)"
- #24 on the list of "Top 100 cities with highest percentage of college students (pop. 50,000+)"
- #30 on the list of "Top 101 cities with largest percentage of males in occupations: food preparation and serving related occupations (population 50,000+)"
- #35 on the list of "Top 101 larger cities with the largest decrease or smallest increase in household income from 2000 (population 50,000+)"
- #41 on the list of "Top 101 cities with largest percentage of males in industries: educational services (population 50,000+)"
- #44 on the list of "Top 101 cities with largest percentage population decreases in the 1990s) (population 50,000+)"
- #48 on the list of "Top 101 cities with the most people born in the same U.S. state as the city (population 50,000+)"
- #48 on the list of "Top 100 cities with strongest arts, entertainment, recreation, accommodation and food services industries (pop. 50,000+)"
- #50 on the list of "Top 101 cities with the most users submitting photos to our site per 10,000 residents (population 50,000+)"
- #53 on the list of "Top 101 cities with largest percentage of females in industries: retail trade (population 50,000+)"
- #54 on the list of "Top 101 cities with largest percentage of males in occupations: education, training, and library occupations (population 50,000+)"
- #54 on the list of "Top 101 cities with largest percentage of females in industries: accommodation and food services (population 50,000+)"
- #56 on the list of "Top 101 cities with the highest number of arson incidents per 100,000 residents, excludes tourist destinations and others with a lot of outsiders visiting based on city industries data (population 50,000+)"
- #56 on the list of "Top 101 cities with the highest average snowfall in a year (population 50,000+)"
- #59 on the list of "Top 101 cities with the lowest cost per building permit (population 50,000+)"

|
|
Total of 172 patent applications in 2008-2024.