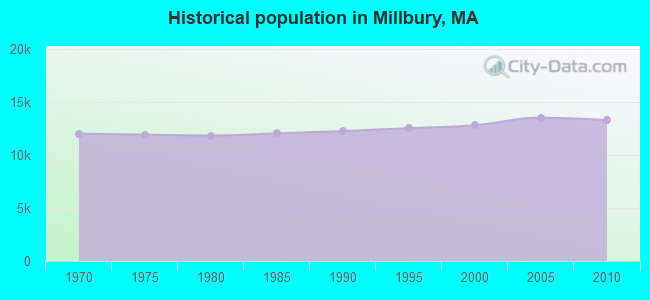
Millbury, Massachusetts

Submit your own pictures of this town and show them to the world
- OSM Map
- General Map
- Google Map
- MSN Map
Population change since 2000: +3.7%
 |
| Males: 6,383 | |
| Females: 6,878 |
| Median resident age: | 42.0 years |
| Massachusetts median age: | 39.2 years |
Zip codes: 01527.
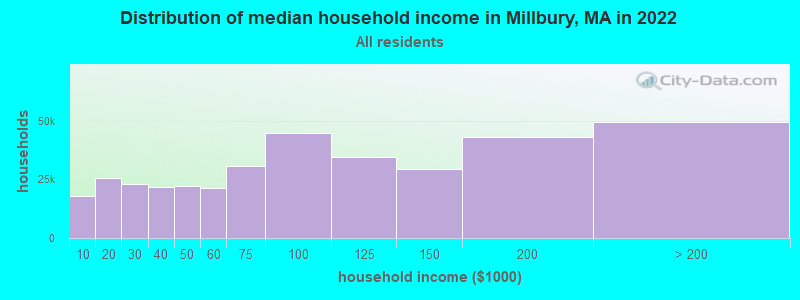
| Millbury: | $92,638 |
| MA: | $94,488 |
Estimated per capita income in 2022: $45,880 (it was $23,531 in 2000)
Millbury town income, earnings, and wages data
Estimated median house or condo value in 2022: $395,457 (it was $143,200 in 2000)
| Millbury: | $395,457 |
| MA: | $534,700 |
Mean prices in 2022: all housing units: $419,164; detached houses: $447,621; townhouses or other attached units: $343,592; in 2-unit structures: $323,295; in 3-to-4-unit structures: $332,295; in 5-or-more-unit structures: $232,758; mobile homes: $113,885
Detailed information about poverty and poor residents in Millbury, MA


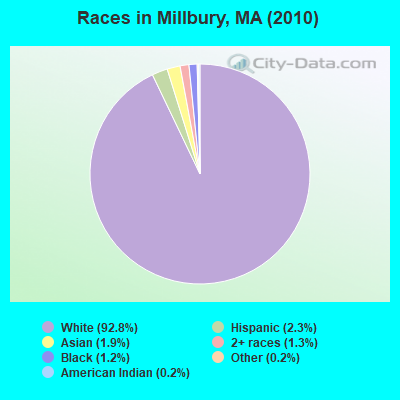
- 12,30992.8%White alone
- 3062.3%Hispanic
- 2481.9%Asian alone
- 1781.3%Two or more races
- 1651.2%Black alone
- 200.2%American Indian alone
- 270.2%Other race alone
- 80.06%Native Hawaiian and Other
Pacific Islander alone
Races in Millbury detailed stats: ancestries, foreign born residents, place of birth
According to our research of Massachusetts and other state lists, there were 10 registered sex offenders living in Millbury, Massachusetts as of May 08, 2024.
The ratio of all residents to sex offenders in Millbury is 1,326 to 1.
The ratio of registered sex offenders to all residents in this city is near the state average.
Type |
2009 |
2010 |
2011 |
2012 |
2013 |
2014 |
2015 |
2016 |
2017 |
2018 |
2019 |
2020 |
2021 |
2022 |
|---|---|---|---|---|---|---|---|---|---|---|---|---|---|---|
| Murders (per 100,000) | 1 (7.3) | 0 (0.0) | 0 (0.0) | 0 (0.0) | 0 (0.0) | 0 (0.0) | 0 (0.0) | 0 (0.0) | 0 (0.0) | 0 (0.0) | 0 (0.0) | 0 (0.0) | 0 (0.0) | 1 (7.1) |
| Rapes (per 100,000) | 5 (36.6) | 7 (52.8) | 1 (7.5) | 6 (44.7) | 7 (52.4) | 4 (29.7) | 5 (37.0) | 4 (29.6) | 6 (44.0) | 1 (7.2) | 2 (14.5) | 3 (21.5) | 1 (7.1) | 2 (14.3) |
| Robberies (per 100,000) | 0 (0.0) | 2 (15.1) | 2 (15.0) | 2 (14.9) | 5 (37.4) | 2 (14.8) | 1 (7.4) | 1 (7.4) | 1 (7.3) | 1 (7.2) | 1 (7.2) | 0 (0.0) | 3 (21.2) | 2 (14.3) |
| Assaults (per 100,000) | 27 (197.8) | 27 (203.6) | 23 (172.4) | 32 (238.4) | 26 (194.7) | 21 (155.9) | 17 (125.8) | 17 (125.6) | 15 (110.1) | 17 (123.2) | 21 (151.8) | 17 (121.9) | 15 (105.9) | 18 (128.5) |
| Burglaries (per 100,000) | 73 (534.7) | 54 (407.2) | 51 (382.3) | 55 (409.7) | 58 (434.3) | 53 (393.4) | 43 (318.2) | 33 (243.9) | 19 (139.4) | 22 (159.4) | 13 (94.0) | 8 (57.4) | 15 (105.9) | 14 (99.9) |
| Thefts (per 100,000) | 324 (2,373) | 237 (1,787) | 241 (1,806) | 233 (1,736) | 206 (1,542) | 225 (1,670) | 171 (1,265) | 177 (1,308) | 137 (1,005) | 124 (898.4) | 115 (831.1) | 76 (544.8) | 76 (536.7) | 117 (835.2) |
| Auto thefts (per 100,000) | 16 (117.2) | 5 (37.7) | 18 (134.9) | 10 (74.5) | 11 (82.4) | 12 (89.1) | 13 (96.2) | 14 (103.5) | 10 (73.4) | 9 (65.2) | 11 (79.5) | 6 (43.0) | 7 (49.4) | 9 (64.2) |
| Arson (per 100,000) | 3 (22.0) | 2 (15.1) | 3 (22.5) | 1 (7.4) | 4 (30.0) | 5 (37.1) | 1 (7.4) | 0 (0.0) | 2 (14.7) | 1 (7.2) | 1 (7.2) | 0 (0.0) | 0 (0.0) | 0 (0.0) |
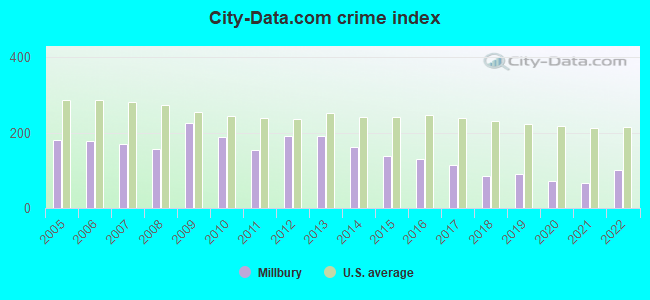
| City-Data.com crime index | 225.2 | 190.5 | 154.8 | 192.0 | 190.8 | 160.8 | 137.6 | 128.7 | 115.3 | 84.9 | 90.3 | 70.8 | 66.0 | 101.2 |
The City-Data.com crime index weighs serious crimes and violent crimes more heavily. Higher means more crime, U.S. average is 246.1. It adjusts for the number of visitors and daily workers commuting into cities.
Crime rate in Millbury detailed stats: murders, rapes, robberies, assaults, burglaries, thefts, arson
Full-time law enforcement employees in 2021, including police officers: 26 (21 officers - 18 male; 3 female).
| Officers per 1,000 residents here: | 1.48 |
| Massachusetts average: | 2.53 |
 Recent articles from our blog. Our writers, many of them Ph.D. graduates or candidates, create easy-to-read articles on a wide variety of topics.


 | 2021 Real Estate Observations (1729 replies) |
| One1 job in Hartford 1 in Cambridge - Best town to live (51 replies) |
| Worcester MA move considerations questions (63 replies) |
| Worcester to Providence Commute (10 replies) |
| How many movie theaters will be left? (21 replies) |
| Springfield to Boston rail (229 replies) |
Latest news from Millbury, MA collected exclusively by city-data.com from local newspapers, TV, and radio stations
Ancestries: Irish (22.3%), French (21.7%), Italian (13.2%), English (12.2%), French Canadian (11.0%), Polish (9.2%).
Current Local Time: EST time zone
Incorporated in 1813
Elevation: 417 feet
Land area: 15.7 square miles.
Population density: 843 people per square mile (low).
380 residents are foreign born (1.2% Europe, 0.7% Asia, 0.5% Latin America, 0.3% North America).
| This town: | 3.0% |
| Massachusetts: | 12.2% |
| Millbury town: | 1.2% ($1,790) |
| Massachusetts: | 1.3% ($2,336) |
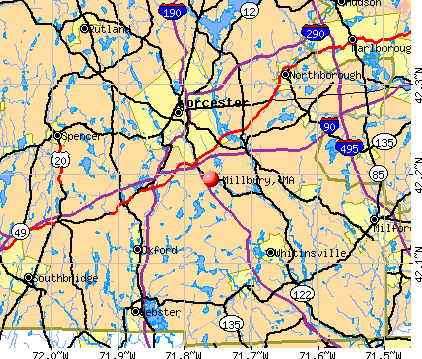
Nearest city with pop. 50,000+: Worcester, MA  (5.5 miles , pop. 172,648).
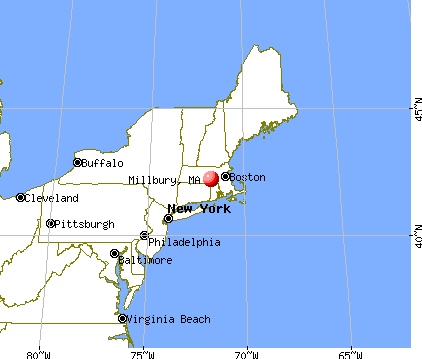
Nearest city with pop. 200,000+: Boston, MA (35.6 miles , pop. 589,141).
Nearest city with pop. 1,000,000+: Bronx, NY (143.7 miles , pop. 1,332,650).
Nearest cities:
), ), Latitude: 42.20 N, Longitude: 71.76 W
Area codes: 508, 774

Millbury, Massachusetts accommodation & food services, waste management - Economy and Business Data
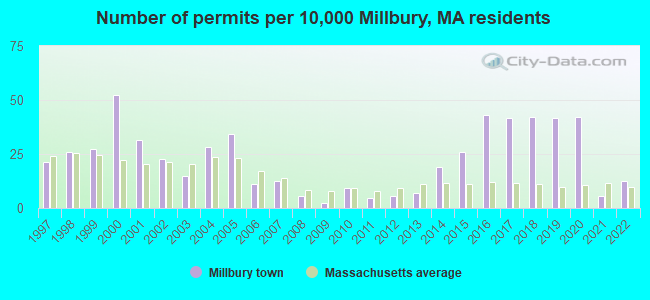
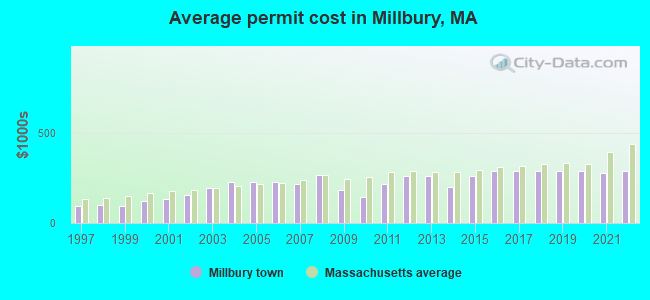
Single-family new house construction building permits:
- 2022: 16 buildings, average cost: $286,500
- 2021: 7 buildings, average cost: $278,600
- 2020: 54 buildings, average cost: $287,600
- 2019: 53 buildings, average cost: $287,600
- 2018: 54 buildings, average cost: $287,600
- 2017: 53 buildings, average cost: $287,600
- 2016: 55 buildings, average cost: $287,600
- 2015: 33 buildings, average cost: $260,300
- 2014: 24 buildings, average cost: $197,800
- 2013: 9 buildings, average cost: $261,900
- 2012: 7 buildings, average cost: $262,100
- 2011: 6 buildings, average cost: $213,000
- 2010: 12 buildings, average cost: $144,000
- 2009: 3 buildings, average cost: $183,300
- 2008: 7 buildings, average cost: $265,100
- 2007: 16 buildings, average cost: $216,000
- 2006: 14 buildings, average cost: $227,800
- 2005: 44 buildings, average cost: $224,700
- 2004: 36 buildings, average cost: $227,400
- 2003: 19 buildings, average cost: $192,800
- 2002: 29 buildings, average cost: $156,500
- 2001: 40 buildings, average cost: $134,500
- 2000: 67 buildings, average cost: $122,100
- 1999: 35 buildings, average cost: $96,300
- 1998: 33 buildings, average cost: $99,500
- 1997: 27 buildings, average cost: $93,300
| Here: | 3.1% |
| Massachusetts: | 3.5% |
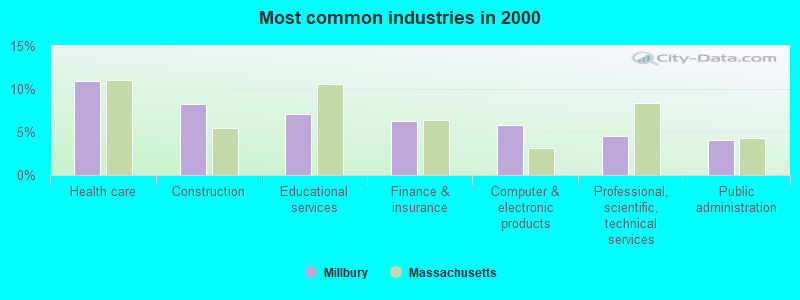
- Health care (11.0%)
- Construction (8.3%)
- Educational services (7.0%)
- Finance & insurance (6.3%)
- Computer & electronic products (5.8%)
- Professional, scientific, technical services (4.5%)
- Public administration (4.0%)
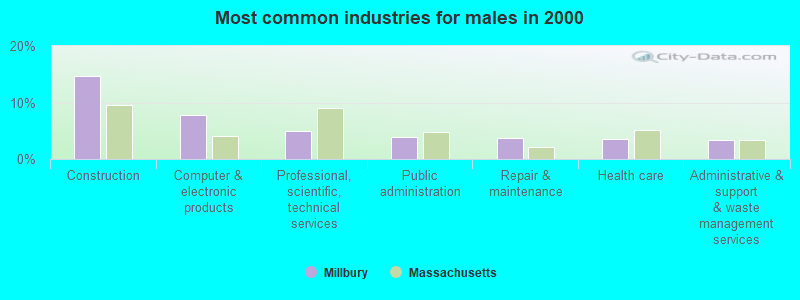
- Construction (14.6%)
- Computer & electronic products (7.8%)
- Professional, scientific, technical services (5.0%)
- Public administration (3.8%)
- Repair & maintenance (3.7%)
- Health care (3.6%)
- Administrative & support & waste management services (3.4%)
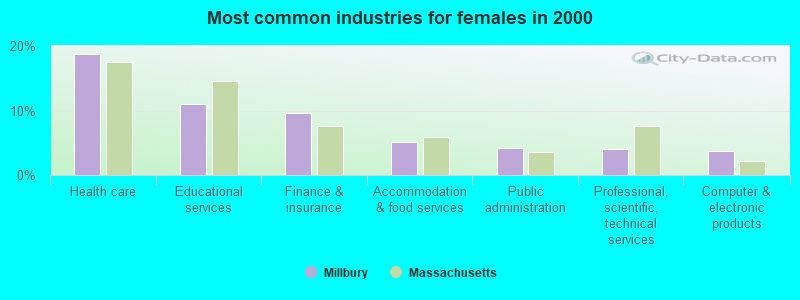
- Health care (18.8%)
- Educational services (10.9%)
- Finance & insurance (9.5%)
- Accommodation & food services (5.2%)
- Public administration (4.3%)
- Professional, scientific, technical services (4.0%)
- Computer & electronic products (3.7%)
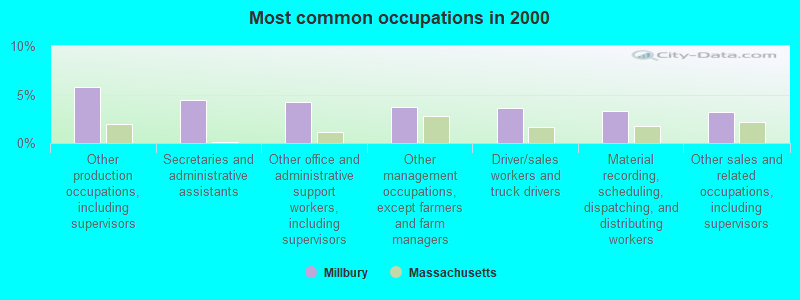
- Other production occupations, including supervisors (5.7%)
- Secretaries and administrative assistants (4.4%)
- Other office and administrative support workers, including supervisors (4.2%)
- Other management occupations, except farmers and farm managers (3.7%)
- Driver/sales workers and truck drivers (3.6%)
- Material recording, scheduling, dispatching, and distributing workers (3.3%)
- Other sales and related occupations, including supervisors (3.2%)
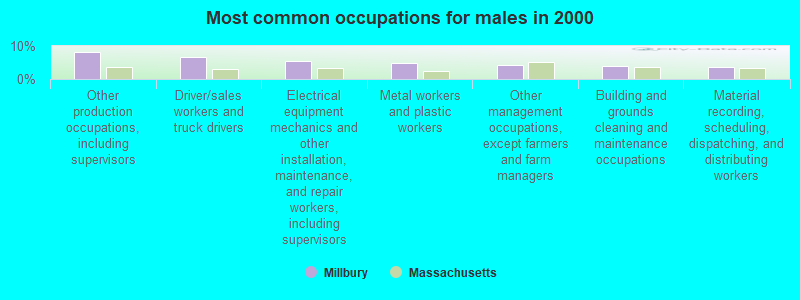
- Other production occupations, including supervisors (8.3%)
- Driver/sales workers and truck drivers (6.8%)
- Electrical equipment mechanics and other installation, maintenance, and repair workers, including supervisors (5.4%)
- Metal workers and plastic workers (5.0%)
- Other management occupations, except farmers and farm managers (4.2%)
- Building and grounds cleaning and maintenance occupations (3.9%)
- Material recording, scheduling, dispatching, and distributing workers (3.7%)

- Secretaries and administrative assistants (8.2%)
- Other office and administrative support workers, including supervisors (7.2%)
- Registered nurses (4.6%)
- Bookkeeping, accounting, and auditing clerks (3.8%)
- Preschool, kindergarten, elementary, and middle school teachers (3.7%)
- Information and record clerks, except customer service representatives (3.6%)
- Other management occupations, except farmers and farm managers (3.1%)
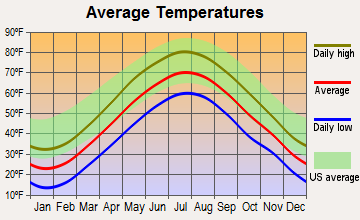
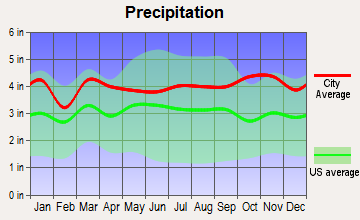
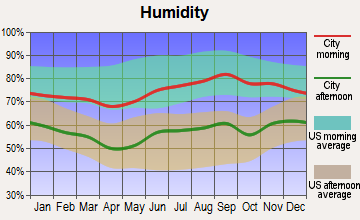
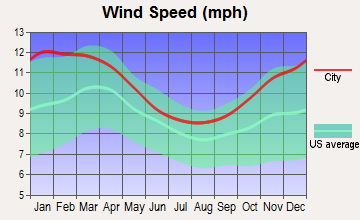
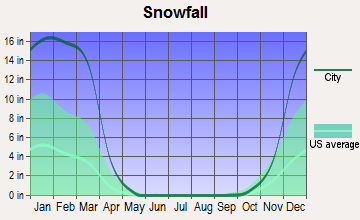
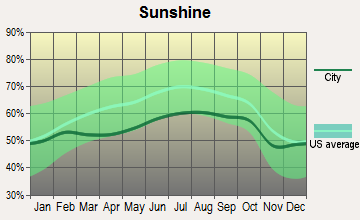
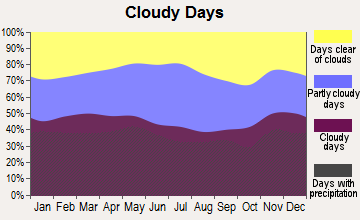
Average climate in Millbury, Massachusetts
Based on data reported by over 4,000 weather stations
(lower is better)
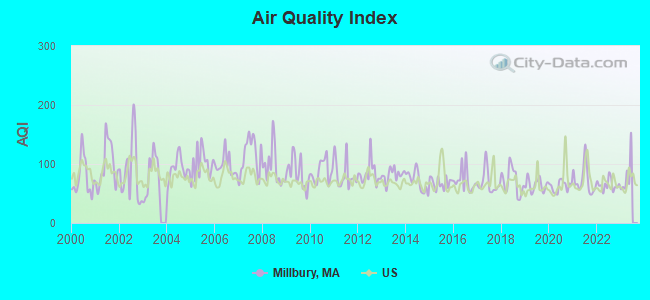
Air Quality Index (AQI) level in 2022 was 64.6. This is about average.
| City: | 64.6 |
| U.S.: | 72.6 |
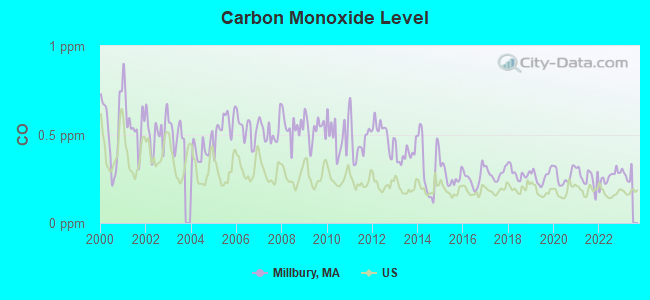
Carbon Monoxide (CO) [ppm] level in 2022 was 0.259. This is about average. Closest monitor was 4.7 miles away from the city center.
| City: | 0.259 |
| U.S.: | 0.251 |
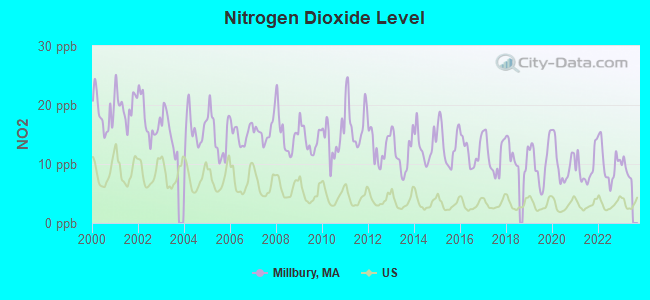
Nitrogen Dioxide (NO2) [ppb] level in 2022 was 10.1. This is significantly worse than average. Closest monitor was 4.7 miles away from the city center.
| City: | 10.1 |
| U.S.: | 5.1 |
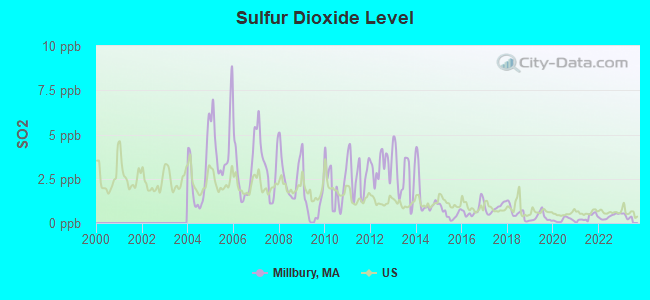
Sulfur Dioxide (SO2) [ppb] level in 2022 was 0.370. This is significantly better than average. Closest monitor was 4.7 miles away from the city center.
| City: | 0.370 |
| U.S.: | 1.515 |
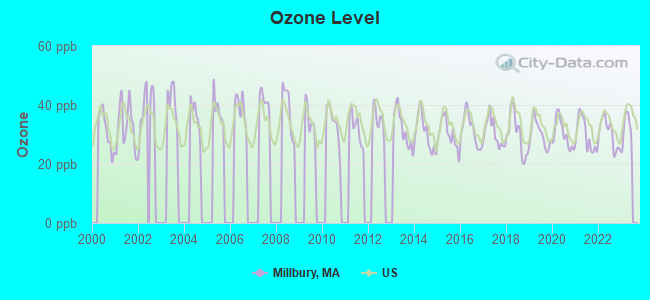
Ozone [ppb] level in 2022 was 30.3. This is about average. Closest monitor was 4.7 miles away from the city center.
| City: | 30.3 |
| U.S.: | 33.3 |
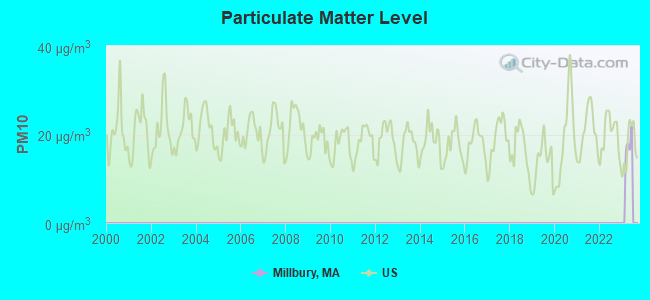
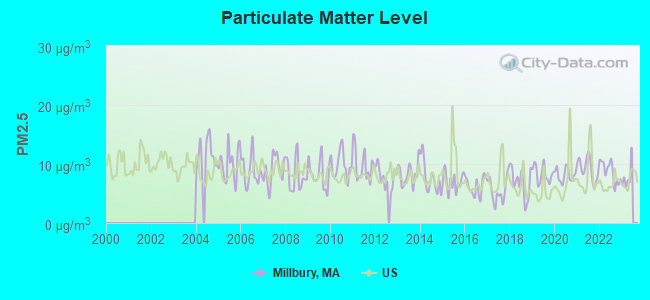
Particulate Matter (PM2.5) [µg/m3] level in 2022 was 8.71. This is about average. Closest monitor was 4.8 miles away from the city center.
| City: | 8.71 |
| U.S.: | 8.11 |
Tornado activity:
Millbury-area historical tornado activity is slightly above Massachusetts state average. It is 23% smaller than the overall U.S. average.
On 6/9/1953, a category F4 (max. wind speeds 207-260 mph) tornado 14.4 miles away from the Millbury town center killed 90 people and injured 1228 people and caused between $50,000,000 and $500,000,000 in damages.
On 6/9/1953, a category F3 (max. wind speeds 158-206 mph) tornado 1.8 miles away from the town center injured 17 people and caused between $500,000 and $5,000,000 in damages.
Earthquake activity:
Millbury-area historical earthquake activity is significantly above Massachusetts state average. It is 72% smaller than the overall U.S. average.On 10/7/1983 at 10:18:46, a magnitude 5.3 (5.1 MB, 5.3 LG, 5.1 ML, Class: Moderate, Intensity: VI - VII) earthquake occurred 178.2 miles away from the city center
On 4/20/2002 at 10:50:47, a magnitude 5.3 (5.3 ML, Depth: 3.0 mi) earthquake occurred 187.4 miles away from Millbury center
On 4/20/2002 at 10:50:47, a magnitude 5.2 (5.2 MB, 4.2 MS, 5.2 MW, 5.0 MW) earthquake occurred 186.5 miles away from the city center
On 1/19/1982 at 00:14:42, a magnitude 4.7 (4.5 MB, 4.7 MD, 4.5 LG, Class: Light, Intensity: IV - V) earthquake occurred 90.6 miles away from the city center
On 10/16/2012 at 23:12:25, a magnitude 4.7 (4.7 ML, Depth: 10.0 mi) earthquake occurred 112.0 miles away from the city center
On 8/22/1992 at 12:20:32, a magnitude 4.8 (4.8 MB, 3.8 MS, 4.7 LG, Depth: 6.2 mi) earthquake occurred 226.8 miles away from the city center
Magnitude types: regional Lg-wave magnitude (LG), body-wave magnitude (MB), duration magnitude (MD), local magnitude (ML), surface-wave magnitude (MS), moment magnitude (MW)
Natural disasters:
The number of natural disasters in Worcester County (27) is a lot greater than the US average (15).Major Disasters (Presidential) Declared: 15
Emergencies Declared: 12
Causes of natural disasters: Floods: 9, Storms: 8, Hurricanes: 6, Snowstorms: 5, Winter Storms: 4, Blizzards: 2, Snows: 2, Fire: 1, Heavy Rain: 1, Snowfall: 1, Tornado: 1, Wind: 1 (Note: some incidents may be assigned to more than one category).

Hospitals and medical centers in Millbury:
Heliports located in Millbury:
Amtrak stations near Millbury:
- 5 miles: WORCESTER (WORCHESTER, 45 SHREWSBURY ST.) . Services: ticket office, fully wheelchair accessible, enclosed waiting area, public restrooms, public payphones, vending machines, free short-term parking, free long-term parking, call for taxi service, public transit connection.
- 19 miles: FRAMINGHAM (443 WAVERLY ST.) . Services: public payphones, snack bar, paid short-term parking, taxi stand, public transit connection.
Colleges/universities with over 2000 students nearest to Millbury:
- College of the Holy Cross (about 4 miles; Worcester, MA; Full-time enrollment: 3,125)
- Clark University (about 5 miles; Worcester, MA; FT enrollment: 3,687)
- Worcester Polytechnic Institute (about 6 miles; Worcester, MA; FT enrollment: 3,930)
- Worcester State University (about 7 miles; Worcester, MA; FT enrollment: 5,426)
- Assumption College (about 8 miles; Worcester, MA; FT enrollment: 2,580)
- Quinsigamond Community College (about 9 miles; Worcester, MA; FT enrollment: 5,877)
- Framingham State University (about 19 miles; Framingham, MA; FT enrollment: 5,743)
Public high school in Millbury:
- MILLBURY JUNIOR/SENIOR HIGH (Students: 927, Location: 12 MARTIN STREET, Grades: 7-12)
Private high school in Millbury:
Public elementary/middle schools in Millbury:
- ELMWOOD STREET (Students: 601, Location: 40 ELMWOOD STREET, Grades: PK-3)
- RAYMOND E. SHAW ELEMENTARY (Students: 424, Location: 58 ELMWOOD STREET, Grades: 4-6)
Private elementary/middle school in Millbury:
Points of interest:
Notable locations in Millbury: Hawk Hill Orchards (A), Stowe Farm Orchard (B), Clear View Country Club (C), Millbury Fire Department Station 2 (D), Millbury Fire Department Station 3 (E), Millbury Fire Department Station 5 (F), Millbury Fire Department Station 1 Headquarters (G), Millbury Town Hall (H), Millbury Public Library (I). Display/hide their locations on the map
Churches in Millbury include: Saint Brigid Church (A), Milbury Federated Church (B), Hosanna Christian Fellowship Church (C), Grace Baptist Church (D), First Congregational Church (E), Assumption Church (F). Display/hide their locations on the map
Cemeteries: Dwinell Cemetery (1), Saint Brigade Cemetery (2), Central Cemetery (3). Display/hide their locations on the map
Lakes and reservoirs: Shiner Hole (A), Hathaway Pond (B), Woolshop Pond (C), Ramshorn Pond (D), Mayo Pond (E), Howe Reservoirs (F), Howe Pond (G), Dorothy Pond (H). Display/hide their locations on the map
Streams, rivers, and creeks: Dorothy Brook (A), Broad Meadow Brook (B), Singletary Brook (C). Display/hide their locations on the map
Birthplace of: Wilton S. Farnsworth - Sportswriter and editor, George A. Sheridan - Politician, George E. White - Politician.
Drinking water stations with addresses in Millbury that have no violations reported:
- AQUARION WATER COMPANY MILLBURY (Population served: 8,436, Primary Water Source Type: Purch surface water)
- AQUARION WATER COMPANY OXFORD (Population served: 6,195, Primary Water Source Type: Groundwater)
| This town: | 2.5 people |
| Massachusetts: | 2.5 people |
| This town: | 67.7% |
| Whole state: | 63.0% |
| This town: | 7.8% |
| Whole state: | 7.0% |
Likely homosexual households (counted as self-reported same-sex unmarried-partner households)
- Lesbian couples: 0.5% of all households
- Gay men: 0.3% of all households
| This town: | 6.3% |
| Whole state: | 9.3% |
| This town: | 3.2% |
| Whole state: | 4.4% |
People in group quarters in Millbury in 2010:
- 126 people in nursing facilities/skilled-nursing facilities
- 15 people in emergency and transitional shelters (with sleeping facilities) for people experiencing homelessness
- 10 people in residential treatment centers for adults
- 2 people in other noninstitutional facilities
People in group quarters in Millbury in 2000:
- 319 people in nursing homes
- 7 people in religious group quarters
- 7 people in other nonhousehold living situations
- 6 people in homes for the physically handicapped
Banks with branches in Millbury (2011 data):
- Millbury Savings Bank: at 109 Elm Street, branch established on 1854/04/10; West Branch at Route 146 And Boria Lane (S.E. Corner), branch established on 1981/11/19. Info updated 2008/03/03: Bank assets: $205.5 mil, Deposits: $162.4 mil, local headquarters, positive income, Mortgage Lending Specialization, 3 total offices
- Fidelity Co-operative Bank: Millbury Branch at 97 Elm Street, branch established on 1976/11/01. Info updated 2006/10/24: Bank assets: $517.5 mil, Deposits: $398.9 mil, headquarters in Fitchburg, MA, positive income, Commercial Lending Specialization, 8 total offices, Holding Company: Fidelity Mutual Holding Company
- Millbury National Bank: at 18 Main Street, branch established on 1933/11/15. Info updated 2006/11/03: Bank assets: $71.7 mil, Deposits: $63.1 mil, local headquarters, positive income, Commercial Lending Specialization, 2 total offices
For population 15 years and over in Millbury:
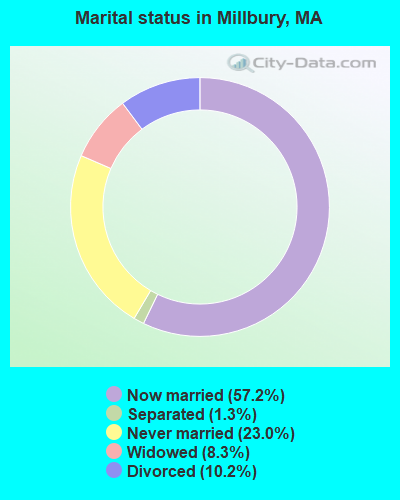
- Never married: 23.0%
- Now married: 57.2%
- Separated: 1.3%
- Widowed: 8.3%
- Divorced: 10.2%
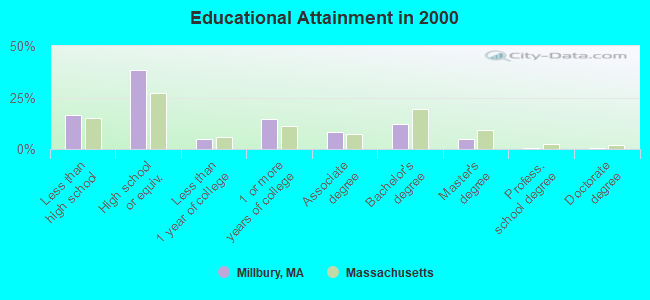
For population 25 years and over in Millbury:
- High school or higher: 83.7%
- Bachelor's degree or higher: 17.8%
- Graduate or professional degree: 5.8%
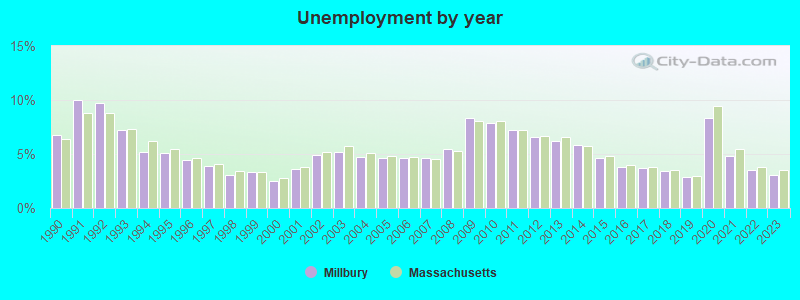
- Unemployed: 2.7%
- Mean travel time to work (commute): 24.1 minutes
| Here: | 10.5 |
| Massachusetts average: | 13.1 |
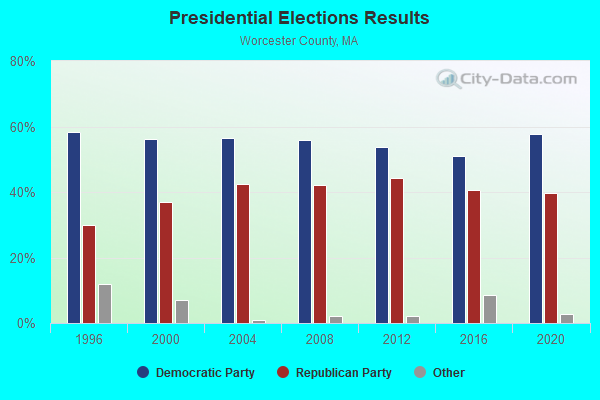
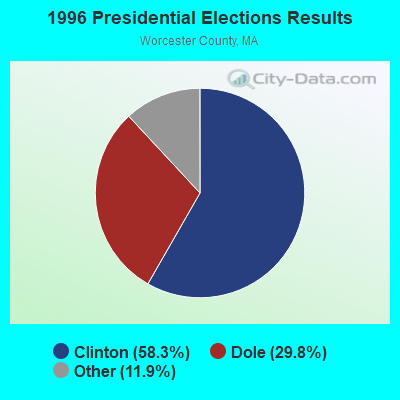
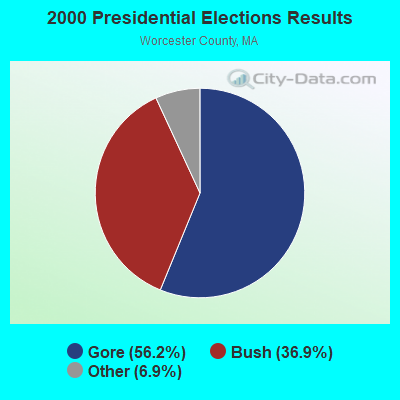
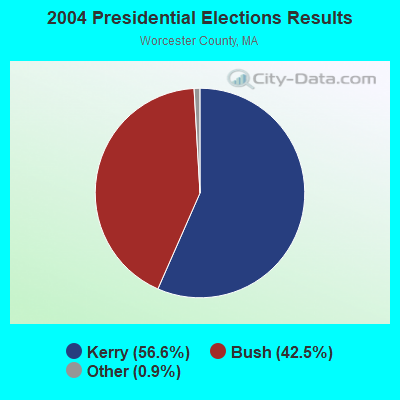

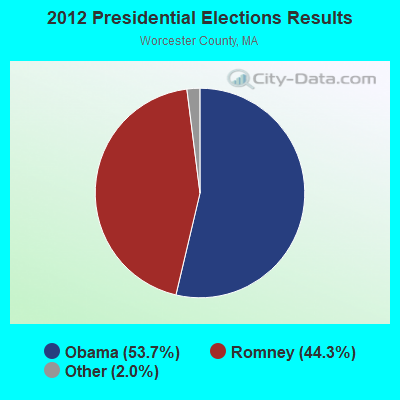
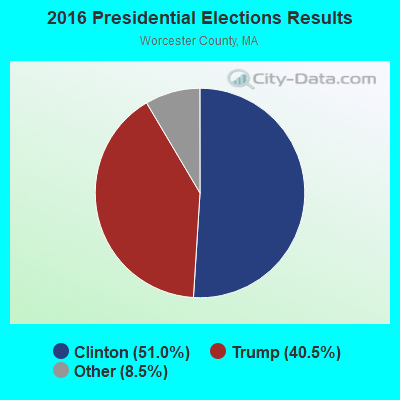
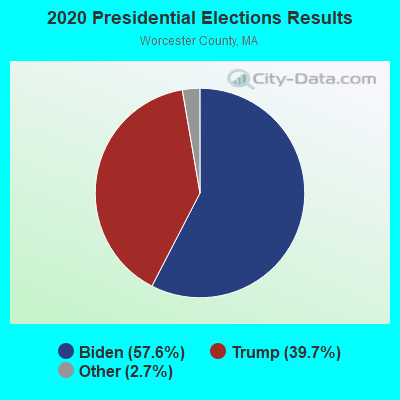
Graphs represent county-level data. Detailed 2008 Election Results
Religion statistics for Millbury, MA (based on Worcester County data)
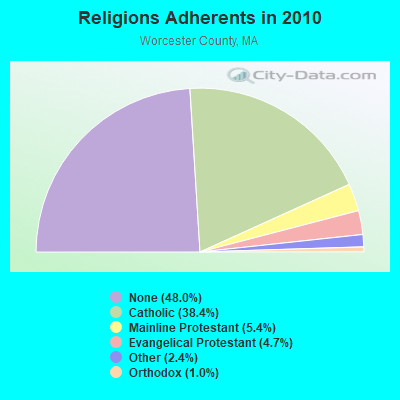
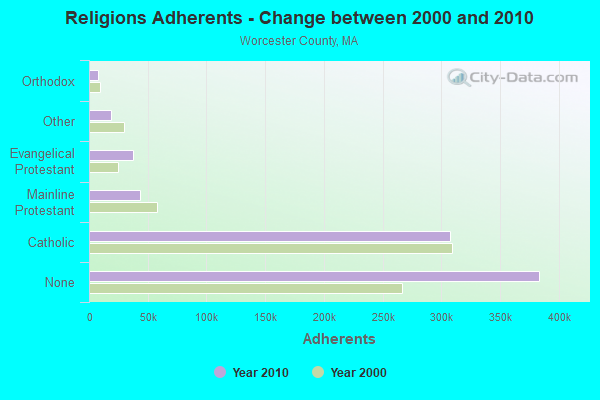
| Religion | Adherents | Congregations |
|---|---|---|
| Catholic | 306,925 | 118 |
| Mainline Protestant | 43,326 | 171 |
| Evangelical Protestant | 37,511 | 203 |
| Other | 18,931 | 69 |
| Orthodox | 7,935 | 15 |
| Black Protestant | 497 | 6 |
| None | 383,427 | - |
Food Environment Statistics:
| Worcester County: | 1.73 / 10,000 pop. |
| Massachusetts: | 1.98 / 10,000 pop. |
| Here: | 0.05 / 10,000 pop. |
| Massachusetts: | 0.05 / 10,000 pop. |
| Here: | 1.79 / 10,000 pop. |
| Massachusetts: | 2.22 / 10,000 pop. |
| Worcester County: | 2.22 / 10,000 pop. |
| State: | 1.77 / 10,000 pop. |
| This county: | 7.27 / 10,000 pop. |
| Massachusetts: | 8.76 / 10,000 pop. |
| This county: | 8.0% |
| Massachusetts: | 8.1% |
| Worcester County: | 24.0% |
| State: | 22.5% |
| Worcester County: | 16.6% |
| Massachusetts: | 16.5% |
4.71% of this county's 2021 resident taxpayers lived in other counties in 2020 ($76,229 average adjusted gross income)
| Here: | 4.71% |
| Massachusetts average: | 6.35% |
0.02% of residents moved from foreign countries ($100 average AGI)
Worcester County: 0.02% Massachusetts average: 0.01%
Top counties from which taxpayers relocated into this county between 2020 and 2021:
| from Middlesex County, MA | |
| from Norfolk County, MA | |
| from Suffolk County, MA |
4.84% of this county's 2020 resident taxpayers moved to other counties in 2021 ($87,252 average adjusted gross income)
| Here: | 4.84% |
| Massachusetts average: | 7.18% |
0.03% of residents moved to foreign countries ($199 average AGI)
Worcester County: 0.03% Massachusetts average: 0.02%
Top counties to which taxpayers relocated from this county between 2020 and 2021:
| to Middlesex County, MA | |
| to Norfolk County, MA | |
| to Suffolk County, MA |
| Businesses in Millbury, MA | ||||
| Name | Count | Name | Count | |
|---|---|---|---|---|
| AT&T | 1 | Motherhood Maternity | 1 | |
| American Eagle Outfitters | 1 | New Balance | 1 | |
| Ann Taylor | 1 | Old Navy | 1 | |
| Applebee's | 1 | Payless | 1 | |
| Barnes & Noble | 1 | PetSmart | 1 | |
| CVS | 1 | Pier 1 Imports | 1 | |
| Chico's | 1 | Qdoba Mexican Grill | 1 | |
| Cold Stone Creamery | 1 | Quiznos | 1 | |
| Coldwater Creek | 1 | Red Robin | 1 | |
| Curves | 1 | Rite Aid | 1 | |
| Dunkin Donuts | 1 | Sprint Nextel | 1 | |
| Famous Footwear | 1 | Staples | 1 | |
| FedEx | 4 | Subway | 1 | |
| GNC | 1 | T-Mobile | 1 | |
| GameStop | 1 | T.G.I. Driday's | 1 | |
| Gap | 1 | Target | 1 | |
| JoS. A. Bank | 1 | Toys"R"Us | 1 | |
| Justice | 1 | True Value | 1 | |
| Kohl's | 1 | UPS | 2 | |
| Lane Bryant | 1 | Verizon Wireless | 1 | |
| Marshalls | 1 | |||
Strongest AM radio stations in Millbury:
- WCRN (830 AM; 50 kW; WORCESTER, MA; Owner: CARTER BROADCASTING CORPORATION)
- WORC (1310 AM; 5 kW; WORCESTER, MA; Owner: CHOWDER BROADCAST GROUP LLC)
- WALE (990 AM; 50 kW; GREENVILLE, RI; Owner: NORTH AMERICAN BROADCASTING CO., INC.)
- WKOX (1200 AM; 50 kW; FRAMINGHAM, MA; Owner: CAPSTAR TX LIMITED PARTNERSHIP)
- WVNE (760 AM; daytime; 25 kW; LEICESTER, MA; Owner: BLOUNT MASSCOM, INC.)
- WBIX (1060 AM; 40 kW; NATICK, MA; Owner: LANGER BROADCASTING CORPORATION)
- WAMG (890 AM; 25 kW; DEDHAM, MA; Owner: MEGA COMMUNICATIONS OF DEDHAM LICENSEE, LLC)
- WEEI (850 AM; 50 kW; BOSTON, MA; Owner: ENTERCOM BOSTON LICENSE, LLC)
- WTAG (580 AM; 5 kW; WORCESTER, MA; Owner: CAPSTAR TX LIMITED PARTNERSHIP)
- WRKO (680 AM; 50 kW; BOSTON, MA; Owner: ENTERCOM BOSTON LICENSE, LLC)
- WVEI (1440 AM; 5 kW; WORCESTER, MA; Owner: ENTERCOM BOSTON LICENSE, LLC)
- WWZN (1510 AM; 50 kW; BOSTON, MA; Owner: ROSE CITY RADIO CORPORATION)
- WNNZ (640 AM; 50 kW; WESTFIELD, MA; Owner: CLEAR CHANNEL BROADCASTING LICENSES, INC.)
Strongest FM radio stations in Millbury:
- WAAF (107.3 FM; WORCESTER, MA; Owner: ENTERCOM BOSTON LICENSE, LLC)
- WICN (90.5 FM; WORCESTER, MA; Owner: WICN PUBLIC RADIO, INC)
- WSRS (96.1 FM; WORCESTER, MA; Owner: CAPSTAR TX LIMITED PARTNERSHIP)
- WCUW (91.3 FM; WORCESTER, MA; Owner: WUW, INC.)
- WYCM (90.1 FM; CHARLTON, MA; Owner: BAY PATH VOCATIONAL HIGH SCHOOL)
- WBMX (98.5 FM; BOSTON, MA; Owner: INFINITY RADIO OPERATIONS INC.)
- WJMN (94.5 FM; BOSTON, MA; Owner: AMFM RADIO LICENSES, L.L.C.)
- WCRB (102.5 FM; WALTHAM, MA; Owner: CHARLES RIVER BROADCASTING WCRB LICE)
- WTKK (96.9 FM; BOSTON, MA; Owner: GREATER BOSTON RADIO, INC.)
- WROR-FM (105.7 FM; FRAMINGHAM, MA; Owner: GREATER BOSTON RADIO, INC.)
- WBOS (92.9 FM; BROOKLINE, MA; Owner: GREATER BOSTON RADIO, INC.)
- WBPR (91.9 FM; WORCESTER, MA; Owner: UNIVERSITY OF MASSACHUSETTS)
- WGBH (89.7 FM; BOSTON, MA; Owner: WGBH EDUCATIONAL FOUNDATION)
- WWFX (100.1 FM; SOUTHBRIDGE, MA; Owner: CITADEL BROADCASTING COMPANY)
- WBUR-FM (90.9 FM; BOSTON, MA; Owner: TRUSTEES OF BOSTON UNIVERSITY)
- WXLO (104.5 FM; FITCHBURG, MA; Owner: CITADEL BROADCASTING COMPANY)
- WORC-FM (98.9 FM; WEBSTER, MA; Owner: CITADEL BROADCASTING COMPANY)
- WODS (103.3 FM; BOSTON, MA; Owner: INFINITY BROADCASTING OPERATIONS, INC.)
- WXKS-FM (107.9 FM; MEDFORD, MA; Owner: AMFM RADIO LICENSES, L.L.C.)
- WMJX (106.7 FM; BOSTON, MA; Owner: GREATER BOSTON RADIO, INC.)
TV broadcast stations around Millbury:
- WUNI (Channel 27; WORCESTER, MA; Owner: ENTRAVISION HOLDINGS, LLC)
- WUTF (Channel 66; MARLBOROUGH, MA; Owner: TELEFUTURA BOSTON LLC)
- WCRN-LP (Channel 34; LEICESTER, MA; Owner: CARTER BROADCASTING CORPORATION)
- WCVB-TV (Channel 5; BOSTON, MA; Owner: WCVB HEARST-ARGYLE TV, INC.)
- WGBH-TV (Channel 2; BOSTON, MA; Owner: WGBH EDUCATIONAL FOUNDATION)
- WYDN (Channel 48; WORCESTER, MA; Owner: EDUCATIONAL PUBLIC TV CORPORATION)
- WMFP (Channel 62; LAWRENCE, MA; Owner: WSAH LICENSE, INC.)
- WHDH-TV (Channel 7; BOSTON, MA; Owner: WHDH-TV)
- WBZ-TV (Channel 4; BOSTON, MA; Owner: VIACOM INC.)
- WGBX-TV (Channel 44; BOSTON, MA; Owner: WGBH EDUCATIONAL FOUNDATION)
- WSBK-TV (Channel 38; BOSTON, MA; Owner: VIACOM INC.)
- WLVI-TV (Channel 56; CAMBRIDGE, MA; Owner: WLVI, INC.)
- WFXT (Channel 25; BOSTON, MA; Owner: FOX TELEVISION STATIONS INC.)
- WPXQ (Channel 69; BLOCK ISLAND, RI; Owner: OCEAN STATE TELEVISION, L.L.C.)
- W40BO (Channel 40; BOSTON, MA; Owner: PAXSON COMMUNICATIONS LPTV, INC.)
- WNAC-TV (Channel 64; PROVIDENCE, RI; Owner: WNAC, LLC)
- WPRI-TV (Channel 12; PROVIDENCE, RI; Owner: TVL BROADCASTING OF RHODE ISLAND, LLC)
- WBPX (Channel 68; BOSTON, MA; Owner: PAXSON BOSTON-68 LICENSE, INC.)
- WLNE-TV (Channel 6; NEW BEDFORD, MA; Owner: FREEDOM BROADCASTING OF SOUTHERN NEW ENGLAND, INC.)
- WJAR (Channel 10; PROVIDENCE, RI; Owner: OUTLET BROADCASTING, INC.)
- WWDP (Channel 46; NORWELL, MA; Owner: NORWELL TELEVISION, LLC)
- WSBE-TV (Channel 36; PROVIDENCE, RI; Owner: RHODE ISLAND PUBLIC TELECOM. AUTHORITY)
- WTMU-LP (Channel 32; BOSTON, MA; Owner: ZGS BOSTON, INC.)
- WCEA-LP (Channel 58; BOSTON, MA; Owner: CHANNEL 19 TV CORPORATION)
- WRIW-LP (Channel 50; PROVIDENCE, RI; Owner: ZGS PROVIDENCE, INC.)
- National Bridge Inventory (NBI) Statistics
- 43Number of bridges
- 922ft / 281mTotal length
- $187,582,000Total costs
- 1,106,483Total average daily traffic
- 121,577Total average daily truck traffic
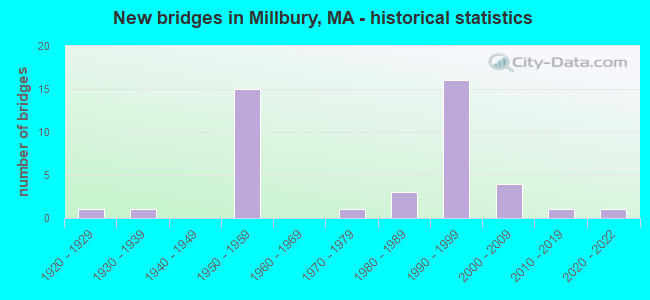
- New bridges - historical statistics
- 11920-1929
- 11930-1939
- 151950-1959
- 11970-1979
- 31980-1989
- 161990-1999
- 42000-2009
- 12010-2019
- 12020-2022
FCC Registered Antenna Towers:
8 (See the full list of FCC Registered Antenna Towers in Millbury)FCC Registered Broadcast Land Mobile Towers:
9 (See the full list of FCC Registered Broadcast Land Mobile Towers in Millbury, MA)FCC Registered Microwave Towers:
3- BOS1119, 428 Greenwood Street, Millbury (Lat: 42.194278 Lon: -71.787583), Type: Pole, Structure height: 48.8 m, Call Sign: WQFJ740, Licensee ID: L01728370,
Assigned Frequencies: 10795.0 MHz, 10975.0 MHz, 23175.0 MHz, 23075.0 MHz, Grant Date: 08/01/2006, Expiration Date: 08/01/2016, Cancellation Date: 09/09/2013, Certifier: Joseph M Sandri Jr., Registrant: Fibertower Network Services, Corp., Debtor-In-Possession, 1875 Eye Street, Nw, 5th Floor, Room 505, Washington, DC 20006, Phone: (202) 223-1028, Email:
- BS54XC983, 428 Greenwood Street (Lat: 42.194333 Lon: -71.787556), Type: Pole, Structure height: 44.2 m, Overall height: 45.7 m, Call Sign: WQPU437,
Assigned Frequencies: 19575.0 MHz, 19575.0 MHz, 19575.0 MHz, 19575.0 MHz, Grant Date: 08/16/2012, Expiration Date: 08/16/2022, Cancellation Date: 08/10/2022, Certifier: David Werblow, Registrant: Dla Piper LLP, 500 8th Street, Nw, Washington, DC 20004, Phone: (202) 799-4216, Fax: (202) 799-5616, Email:
- STATION, Grafton St (Lat: 42.192306 Lon: -71.742833), Structure height: 9.1 m, Call Sign: KEO37,
Assigned Frequencies: 6635.00 MHz, Grant Date: 05/28/2009, Expiration Date: 06/30/2019, Cancellation Date: 08/31/2017, Registrant: Utilities Telecom Council, 1901 Pennsylvania Ave. Nw, Suite 500, Washington, DC 20006, Phone: (202) 833-6803, Fax: (202) 833-6803, Email:
FCC Registered Paging Towers:
1- 2.04 Mi Nnw Of Millbury City Center (Lat: 42.221750 Lon: -71.773667), Call Sign: KNKJ927, Licensee ID: L01422065,
Assigned Frequencies: 931.862 MHz, Grant Date: 05/05/2009, Expiration Date: 04/01/2019, Cancellation Date: 01/28/2014, Certifier: Shawn E Endsley, Registrant: Usa Mobility Wireless, Inc., 3000 Technology Dr. #400, Plano, TX 75074, Phone: (972) 801-0000, Fax: (972) 801-1699, Email:
FCC Registered Amateur Radio Licenses:
47 (See the full list of FCC Registered Amateur Radio Licenses in Millbury)FAA Registered Aircraft:
8 (See the full list of FAA Registered Aircraft in Millbury)2002 - 2018 National Fire Incident Reporting System (NFIRS) incidents
- Fire incident types reported to NFIRS in Millbury, MA
- 60458.4%Structure Fires
- 24723.9%Outside Fires
- 17817.2%Mobile Property/Vehicle Fires
- 50.5%Other
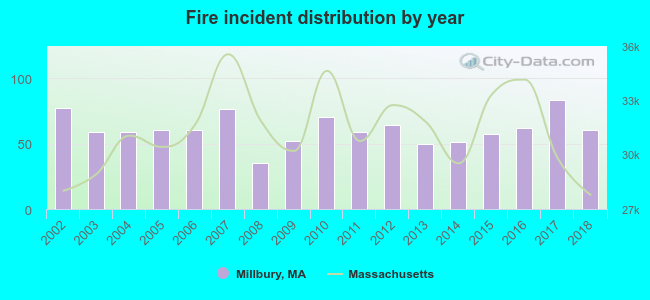 Based on the data from the years 2002 - 2018 the average number of fires per year is 61. The highest number of reported fire incidents - 83 took place in 2017, and the least - 35 in 2008. The data has a decreasing trend.
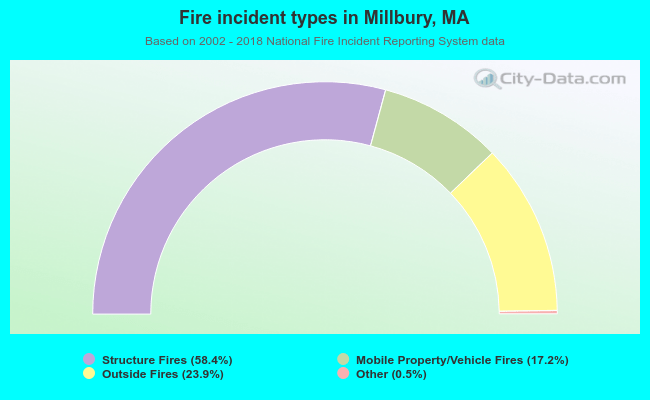 When looking into fire subcategories, the most incidents belonged to: Structure Fires (58.4%), and Outside Fires (23.9%).
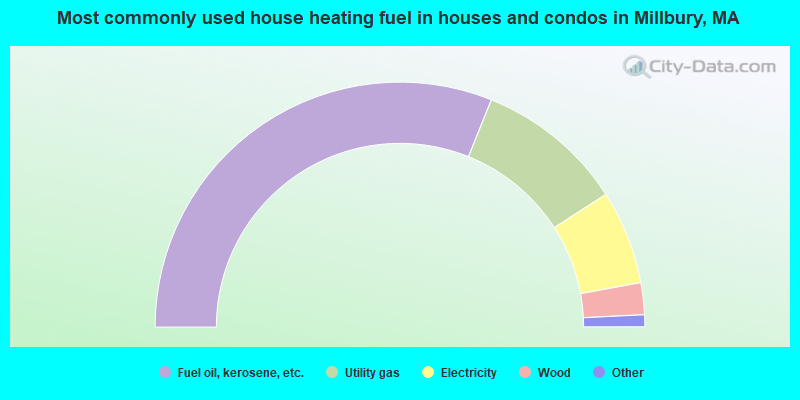
- 62.2%Fuel oil, kerosene, etc.
- 19.6%Utility gas
- 12.4%Electricity
- 4.2%Wood
- 0.8%Coal or coke
- 0.7%Bottled, tank, or LP gas
- 0.2%Other fuel
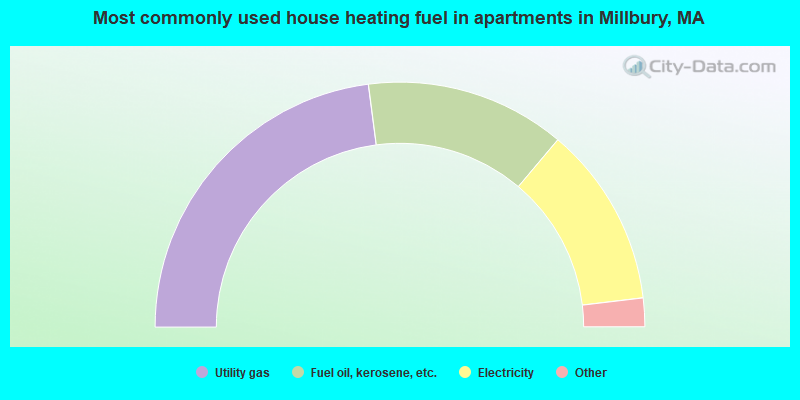
- 45.9%Utility gas
- 26.4%Fuel oil, kerosene, etc.
- 23.9%Electricity
- 2.1%Bottled, tank, or LP gas
- 1.1%Other fuel
- 0.6%Solar energy
Millbury compared to Massachusetts state average:
- Unemployed percentage significantly below state average.
- Black race population percentage significantly below state average.
- Hispanic race population percentage significantly below state average.
- Foreign-born population percentage significantly below state average.
- Length of stay since moving in significantly above state average.
- Number of rooms per house significantly below state average.
- House age significantly below state average.
- Percentage of population with a bachelor's degree or higher below state average.
Millbury on our top lists:
- #7 on the list of "Top 101 cities with largest percentage of females in industries: fuel dealers (population 5,000+)"
- #34 on the list of "Top 101 cities with largest percentage of males in occupations: secretaries and administrative assistants (population 5,000+)"
- #40 on the list of "Top 101 cities with largest percentage of males in industries: vending machine operators (population 5,000+)"
- #49 on the list of "Top 101 cities with largest percentage of females in industries: u. s. postal service (population 5,000+)"
- #53 on the list of "Top 101 cities with largest percentage of females in industries: publishing, and motion picture and sound recording industries (population 5,000+)"
- #63 on the list of "Top 101 cities with largest percentage of males in industries: computer and electronic products (population 5,000+)"
- #64 on the list of "Top 101 cities with largest percentage of males in occupations: nursing, psychiatric, and home health aides (population 5,000+)"
- #70 on the list of "Top 101 cities with largest percentage of males in industries: u. s. postal service (population 5,000+)"
- #71 on the list of "Top 101 cities with largest percentage of males in industries: building material and garden equipment and supplies dealers (population 5,000+)"
- #79 on the list of "Top 101 cities with largest percentage of females in occupations: other healthcare support occupations (population 5,000+)"
- #81 on the list of "Top 101 cities with largest percentage of females in industries: leather and allied products (population 5,000+)"
- #83 on the list of "Top 101 cities with largest percentage of females in occupations: other protective service workers including supervisors (population 5,000+)"
- #85 on the list of "Top 101 cities with largest percentage of males in industries: publishing, and motion picture and sound recording industries (population 5,000+)"
- #90 on the list of "Top 101 cities with largest percentage of females in industries: miscellaneous durable goods merchant wholesalers (population 5,000+)"
- #93 on the list of "Top 101 cities with largest percentage of males in industries: alcoholic beverages merchant wholesalers (population 5,000+)"
- #95 on the list of "Top 101 cities with largest percentage of males in industries: nonmetallic mineral products (population 5,000+)"
- #95 on the list of "Top 101 cities with largest percentage of females in industries: personal and laundry services (population 5,000+)"
- #97 on the list of "Top 101 cities with largest percentage of females in industries: computer and electronic products (population 5,000+)"
- #101 on the list of "Top 101 cities with largest percentage of males in occupations: woodworkers (population 5,000+)"
- #39 (01527) on the list of "Top 101 zip codes with the largest percentage of Lithuanian first ancestries (pop 5,000+)"
- #4 on the list of "Top 101 counties with the highest carbon monoxide air pollution readings in 2012 (ppm)"
- #5 on the list of "Top 101 counties with the most Catholic congregations"
- #12 on the list of "Top 101 counties with the highest surface withdrawal of fresh water for public supply"
- #16 on the list of "Top 101 counties with the highest total withdrawal of fresh water for public supply"
- #23 on the list of "Top 101 counties with the highest Sulfur Oxides Annual air pollution readings in 2012 (µg/m3)"

|
|
Total of 162 patent applications in 2008-2024.