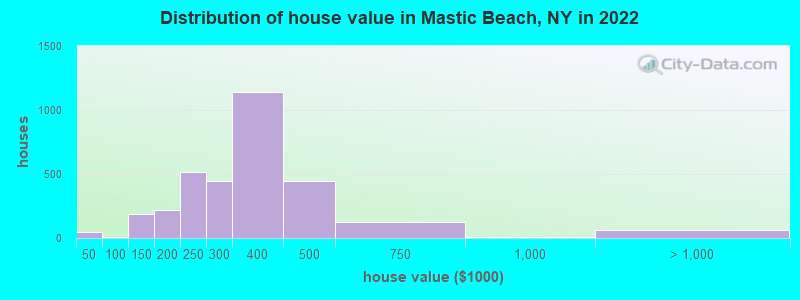
Estimated median house or condo value in 2022: $338,227 (it was $98,800 in 2000)
Mastic Beach:
$338,227
NY:
$400,400
Mean prices in 2022:all housing units: $302,831; detached houses: $302,206; townhouses or other attached units: $301,732; in 5-or-more-unit structures: $514,304
Median gross rent in 2022: $2,152.
March 2022 cost of living index in Mastic Beach: 149.2 (very high, U.S. average is 100)
Percentage of residents living in poverty in 2022: 16.4%
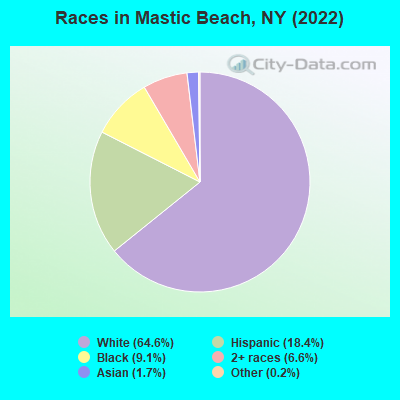
(12.4% for White Non-Hispanic residents, 20.1% for Black residents, 14.6% for Hispanic or Latino residents, 3.3% for other race residents, 50.3% for two or more races residents)
Latest news from Mastic Beach, NY collected exclusively by city-data.com from local newspapers, TV, and radio stations
Ancestries: Italian (23.9%), Irish (10.1%), American (10.0%), German (6.5%), African (5.7%), Greek (2.1%).
Current Local Time: EST time zone
Elevation: 9 feet
Land area: 4.23 square miles.
Population density: 3,515 people per square mile (average).
1,761 residents are foreign born (4.8% Latin America, 2.4% Europe, 2.3% Asia, 1.5% Africa).
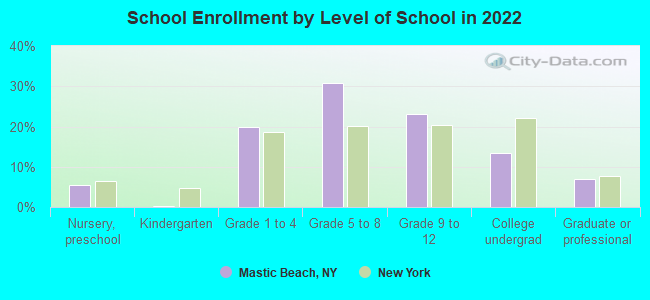
This place:
10.9%
New York:
22.6%
Median real estate property taxes paid for housing units with mortgages in 2022: $7,989 (2.3%) Median real estate property taxes paid for housing units with no mortgage in 2022: $5,914 (2.0%)
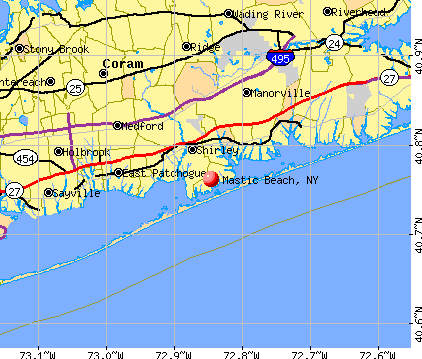
Nearest city with pop. 50,000+: Brentwood, NY (20.9 miles , pop. 53,917).
Nearest city with pop. 200,000+: North Hempstead, NY (43.0 miles , pop. 222,611).
Nearest city with pop. 1,000,000+: Queens, NY (51.1 miles , pop. 2,229,379).
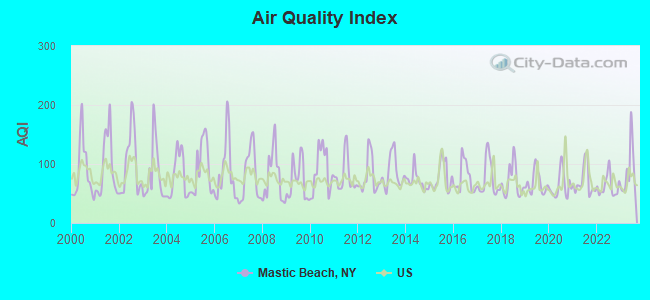
Air Quality Index (AQI) level in 2023 was 87.8. This is worse than average.
City:
87.8
U.S.:
72.6
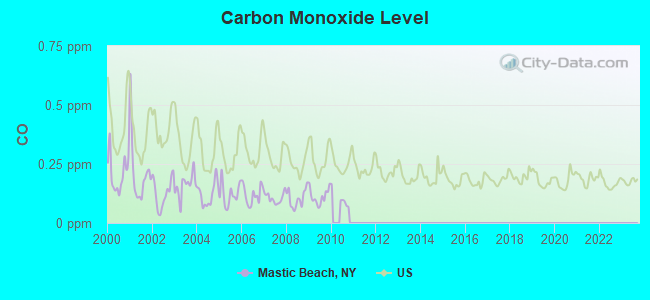
Carbon Monoxide (CO) [ppm] level in 2009 was 0.112. This is significantly better than average.Closest monitor was 12.0 miles away from the city center.
City:
0.112
U.S.:
0.251
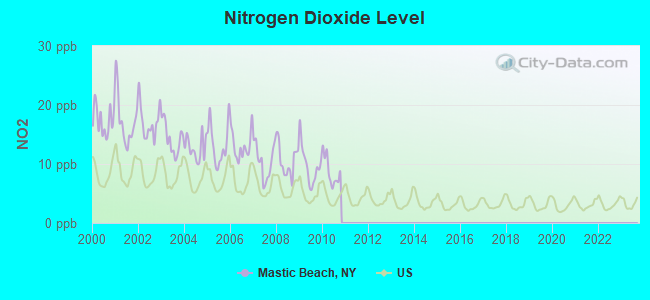
Nitrogen Dioxide (NO2) [ppb] level in 2010 was 8.78. This is significantly worse than average.Closest monitor was 12.0 miles away from the city center.
City:
8.78
U.S.:
5.11
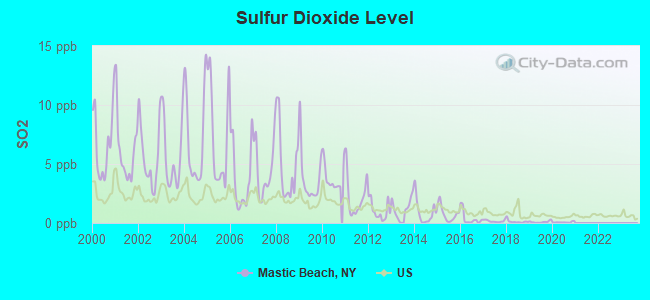
Sulfur Dioxide (SO2) [ppb] level in 2020 was 0.0629. This is significantly better than average.Closest monitor was 12.0 miles away from the city center.
City:
0.0629
U.S.:
1.5147
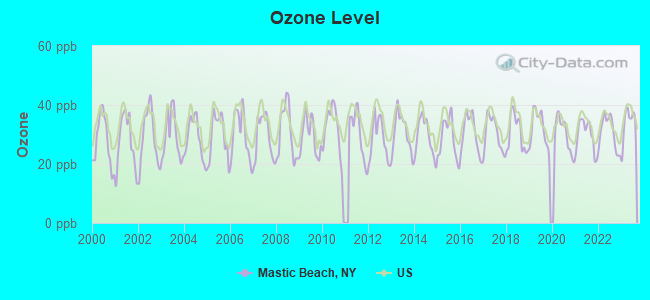
Ozone [ppb] level in 2023 was 33.9. This is about average.Closest monitor was 12.0 miles away from the city center.
City:
33.9
U.S.:
33.3
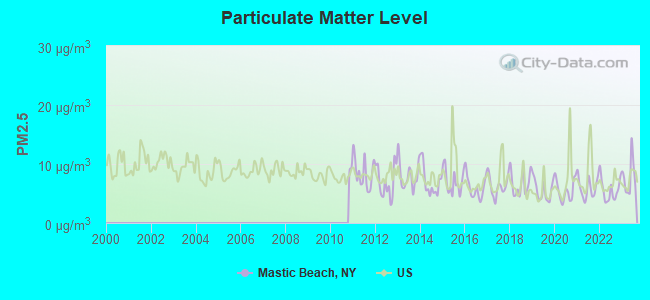
Particulate Matter (PM2.5) [µg/m3] level in 2023 was 7.79. This is about average.There were 0 monitors within city limits.
City:
7.79
U.S.:
8.11
Tornado activity:
Mastic Beach-area historical tornado activity is slightly below New York state average. It is 67% smaller than the overall U.S. average.
On 7/10/1989, a category F4 (max. wind speeds 207-260 mph) tornado 38.8 miles away from the Mastic Beach place center injured 40 peopleand causedbetween $50,000,000 and $500,000,000 in damages.
On 7/10/1989, a category F2 (max. wind speeds 113-157 mph) tornado 5.3 miles away from the place center injured one person.
Earthquake activity:
Mastic Beach-area historical earthquake activity is significantly above New York state average. It is 72% smaller than the overall U.S. average.
On 10/7/1983 at 10:18:46, a magnitude 5.3 (5.1 MB, 5.3 LG, 5.1 ML, Class: Moderate, Intensity: VI - VII) earthquake occurred 233.6 miles away from Mastic Beach center On 8/23/2011 at 17:51:04, a magnitude 5.8 (5.8 MW, Depth: 3.7 mi) earthquake occurred 336.1 miles away from Mastic Beach center On 4/20/2002 at 10:50:47, a magnitude 5.3 (5.3 ML, Depth: 3.0 mi) earthquake occurred 263.0 miles away from the city center On 8/22/1992 at 12:20:32, a magnitude 4.8 (4.8 MB, 3.8 MS, 4.7 LG, Depth: 6.2 mi, Class: Light, Intensity: IV - V) earthquake occurred 176.3 miles away from Mastic Beach center On 4/20/2002 at 10:50:47, a magnitude 5.2 (5.2 MB, 4.2 MS, 5.2 MW, 5.0 MW) earthquake occurred 261.5 miles away from Mastic Beach center On 1/16/1994 at 01:49:16, a magnitude 4.6 (4.6 MB, 4.6 LG, Depth: 3.1 mi) earthquake occurred 170.3 miles away from the city center Magnitude types: regional Lg-wave magnitude (LG), body-wave magnitude (MB), local magnitude (ML), surface-wave magnitude (MS), moment magnitude (MW)
Natural disasters:
The number of natural disasters in Suffolk County (28) is a lot greater than the US average (15). Major Disasters (Presidential) Declared: 19 Emergencies Declared: 7
Causes of natural disasters: Hurricanes: 9, Floods: 7, Storms: 7, Snowstorms: 4, Winter Storms: 3, Blizzards: 2, Heavy Rain: 1, Power Outage: 1, Tropical Depression: 1, Tropical Storm: 1, Water Shortage: 1, Other: 3 (Note: some incidents may be assigned to more than one category).
Hospitals and medical centers in Mastic Beach:
FREE, INC (49 PINEWAY AVE)
Other hospitals and medical centers near Mastic Beach:
FREE, INC (Hospital, about 2 miles away; SHIRLEY, NY)
FREE, INC (Hospital, about 3 miles away; MASTIC, NY)
FREE, INC (Hospital, about 5 miles away; MASTIC, NY)
INDEPENDENT GROUP HOME LIVING PROGRAM, INC (Hospital, about 5 miles away; CENTER MORICHES, NY)
BELLHAVEN NURSING AND REHAB CENTER (Nursing Home, about 5 miles away; BROOKHAVEN, NY)
JOHN J FOLEY SKILLED NURSING FACILITY (Nursing Home, about 6 miles away; YAPHANK, NY)
CEDAR LODGE NURSING HOME (Nursing Home, about 6 miles away; CENTER MORICHES, NY)
Colleges/universities with over 2000 students nearest to Mastic Beach:
Suffolk County Community College (about 13 miles; Selden, NY; Full-time enrollment: 18,540)
Dowling College (about 17 miles; Oakdale, NY; FT enrollment: 2,598)
Stony Brook University (about 18 miles; Stony Brook, NY; FT enrollment: 22,071)
Farmingdale State College (about 31 miles; Farmingdale, NY; FT enrollment: 6,956)
Porter and Chester Institute of Stratford (about 33 miles; Stratford, CT; FT enrollment: 2,822)
University of Bridgeport (about 34 miles; Bridgeport, CT; FT enrollment: 3,708)
Housatonic Community College (about 34 miles; Bridgeport, CT; FT enrollment: 3,677)
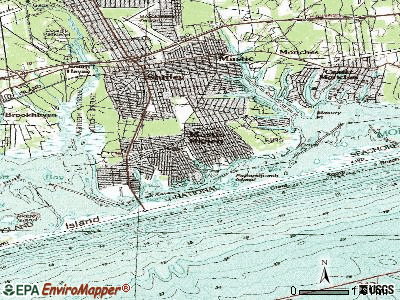
Notable locations in Mastic Beach: William Floyd Estate (A), Saint Jude's Hall (B), Mastic Beach Fire Department (C). Display/hide their locations on the map
Churches in Mastic Beach include: Saint Jude's Roman Catholic Church (A), Bayview Baptist Church (B), Saint Andrew Episcopal Church (C). Display/hide their locations on the map
Creeks: Pattersquash Creek (A), Lawrence Creek (B), Johns Neck Creek (C), Home Creek (D), Sheepen Creek (E), Unchachoque Creek (F). Display/hide their locations on the map
Tourist attraction: U S Government - Interior Dept- National Park Service- Fire Island William Floyd Es (Recreation Areas; 20 Washington Avenue).
Birthplace of: Ryan Hodgson - College basketball player (Army Black Knights).
Suffolk County has a predicted average indoor radon screening level less than 2 pCi/L (pico curies per liter) - Low Potential
Drinking water stations with addresses in Mastic Beach and their reported violations in the past:
LOGUIDICE SHOPPING CENTER (Population served: 800, Groundwater):
Past health violations:
MCL, Monthly (TCR) - Between APR-2012 and JUN-2012, Contaminant: Coliform. Follow-up actions: St Public Notif requested (APR-18-2012), St Formal NOV issued (APR-18-2012), St Compliance achieved (MAY-30-2012)
Past monitoring violations:
Monitoring of Treatment (SWTR-Unfilt/GWR) - Between APR-2012 and JUN-2012, Contaminant: GROUNDWATER RULE. Follow-up actions: St Formal NOV issued (APR-18-2012), St Public Notif requested (APR-18-2012), St Compliance achieved (MAY-30-2012)
Average household size:
This place:
3.0 people
New York:
2.6 people
Percentage of family households:
This place:
75.1%
Whole state:
63.5%
Percentage of households with unmarried partners:
This place:
10.8%
Whole state:
6.8%
Likely homosexual households (counted as self-reported same-sex unmarried-partner households)
Lesbian couples: 0.6% of all households
Gay men: 0.5% of all households
25 people in group homes intended for adults in 2010
3 people in other noninstitutional facilities in 2010
25 people in homes or halfway houses for drug/alcohol abuse in 2000
4 people in religious group quarters in 2000
Religion statistics for Mastic Beach, NY (based on Suffolk County data)
Religion
Adherents
Congregations
Catholic
879,457
75
Mainline Protestant
69,205
182
Evangelical Protestant
58,909
264
Other
50,771
124
Orthodox
10,190
10
Black Protestant
8,298
49
None
416,520
-
Source: Clifford Grammich, Kirk Hadaway, Richard Houseal, Dale E.Jones, Alexei Krindatch, Richie Stanley and Richard H.Taylor. 2012. 2010 U.S.Religion Census: Religious Congregations & Membership Study. Association of Statisticians of American Religious Bodies. Jones, Dale E., et al. 2002. Congregations and Membership in the United States 2000. Nashville, TN: Glenmary Research Center. Graphs represent county-level data
Aircraft: CESSNA 170A (Category: Land, Seats: 4, Weight: Up to 12,499 Pounds, Speed: 105 mph), Engine: CONT MOTOR C145 SERIES (145 HP) (Reciprocating) N-Number: 1714D, N1714D, N-1714D, Serial Number: 20157, Year manufactured: 1951, Airworthiness Date: 05/15/1956, Certificate Issue Date: 03/22/2017 Registrant (Individual): Michael A Bellenir, 89 Park Dr, Mastic Beach, NY 11951
Aircraft: PIPER PA-28-161 (Category: Land, Seats: 4, Weight: Up to 12,499 Pounds, Speed: 108 mph), Engine: LYCOMING 0-320 SERIES (180 HP) (Reciprocating) N-Number: 2830J, N2830J, N-2830J, Serial Number: 28-7916456, Year manufactured: 1979, Airworthiness Date: 05/03/1979, Certificate Issue Date: 07/01/2016 Registrant (Individual): Jason Reising, 76 Parkwood Dr, Mastic Beach, NY 11951
Aircraft: CESSNA 182S (Category: Land, Seats: 6, Weight: Up to 12,499 Pounds), Engine: LYCOMING IO-540 SER (300 HP) (Reciprocating) N-Number: 330JD, N330JD, N-330JD, Serial Number: 18280267, Year manufactured: 1998, Airworthiness Date: 07/28/1998, Certificate Issue Date: 01/18/2018 Registrant (Individual): Erik M Green, 176 Church Dr, Mastic Beach, NY 11951
Home Mortgage Disclosure Act Aggregated Statistics For Year 2009 (Based on 1 full tract)
A) FHA, FSA/RHS & VA Home Purchase Loans
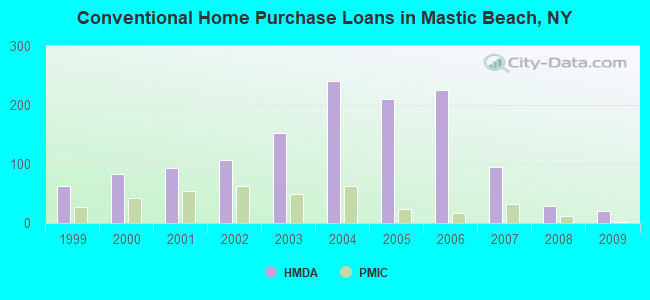
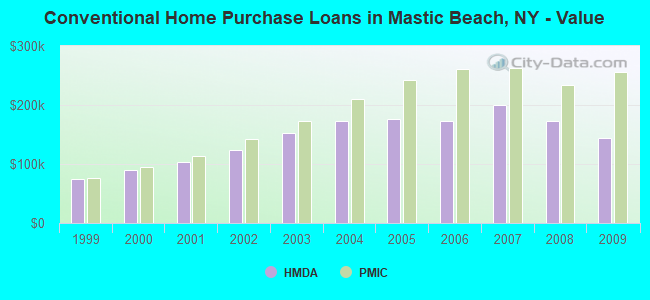
B) Conventional Home Purchase Loans
C) Refinancings
D) Home Improvement Loans
F) Non-occupant Loans on < 5 Family Dwellings (A B C & D)
Number
Average Value
Number
Average Value
Number
Average Value
Number
Average Value
Number
Average Value
LOANS ORIGINATED
33
$179,606
20
$144,200
52
$170,212
8
$54,625
5
$126,800
APPLICATIONS APPROVED, NOT ACCEPTED
6
$168,500
5
$186,200
6
$194,667
0
$0
3
$135,667
APPLICATIONS DENIED
10
$174,500
9
$150,222
52
$181,942
9
$55,444
11
$94,818
APPLICATIONS WITHDRAWN
6
$173,500
5
$148,200
34
$169,588
3
$125,333
8
$100,125
FILES CLOSED FOR INCOMPLETENESS
0
$0
1
$150,000
10
$230,400
0
$0
1
$323,000
Aggregated Statistics For Year 2008 (Based on 1 full tract)
A) FHA, FSA/RHS & VA Home Purchase Loans
B) Conventional Home Purchase Loans
C) Refinancings
D) Home Improvement Loans
F) Non-occupant Loans on < 5 Family Dwellings (A B C & D)
G) Loans On Manufactured Home Dwelling (A B C & D)
Number
Average Value
Number
Average Value
Number
Average Value
Number
Average Value
Number
Average Value
Number
Average Value
LOANS ORIGINATED
15
$224,600
29
$173,345
64
$184,766
25
$77,160
12
$160,167
0
$0
APPLICATIONS APPROVED, NOT ACCEPTED
1
$278,000
11
$192,182
19
$209,368
4
$61,000
8
$171,250
1
$138,000
APPLICATIONS DENIED
6
$216,833
20
$197,700
84
$232,321
18
$57,167
14
$195,357
0
$0
APPLICATIONS WITHDRAWN
7
$243,714
7
$155,571
54
$217,500
1
$80,000
4
$145,500
0
$0
FILES CLOSED FOR INCOMPLETENESS
2
$240,000
6
$112,833
9
$252,333
1
$10,000
3
$211,667
0
$0
Aggregated Statistics For Year 2007 (Based on 1 full tract)
A) FHA, FSA/RHS & VA Home Purchase Loans
B) Conventional Home Purchase Loans
C) Refinancings
D) Home Improvement Loans
F) Non-occupant Loans on < 5 Family Dwellings (A B C & D)
G) Loans On Manufactured Home Dwelling (A B C & D)
Number
Average Value
Number
Average Value
Number
Average Value
Number
Average Value
Number
Average Value
Number
Average Value
LOANS ORIGINATED
12
$227,917
95
$200,674
176
$200,511
33
$71,848
24
$194,917
0
$0
APPLICATIONS APPROVED, NOT ACCEPTED
0
$0
32
$161,750
44
$216,545
11
$82,818
10
$214,800
0
$0
APPLICATIONS DENIED
0
$0
63
$208,905
199
$228,337
47
$109,085
26
$232,808
1
$140,000
APPLICATIONS WITHDRAWN
2
$137,000
34
$188,676
71
$225,113
3
$35,000
6
$187,333
0
$0
FILES CLOSED FOR INCOMPLETENESS
0
$0
5
$241,000
23
$238,522
4
$86,500
4
$211,750
0
$0
Aggregated Statistics For Year 2006 (Based on 1 full tract)
A) FHA, FSA/RHS & VA Home Purchase Loans
B) Conventional Home Purchase Loans
C) Refinancings
D) Home Improvement Loans
F) Non-occupant Loans on < 5 Family Dwellings (A B C & D)
G) Loans On Manufactured Home Dwelling (A B C & D)
Number
Average Value
Number
Average Value
Number
Average Value
Number
Average Value
Number
Average Value
Number
Average Value
LOANS ORIGINATED
8
$265,000
226
$172,726
281
$186,132
51
$92,490
32
$206,188
0
$0
APPLICATIONS APPROVED, NOT ACCEPTED
0
$0
32
$183,125
73
$200,822
12
$87,750
9
$182,667
0
$0
APPLICATIONS DENIED
1
$240,000
98
$192,316
213
$214,333
42
$102,381
32
$192,688
1
$3,000
APPLICATIONS WITHDRAWN
2
$193,500
61
$175,918
145
$187,697
7
$136,714
16
$174,688
1
$306,000
FILES CLOSED FOR INCOMPLETENESS
0
$0
10
$194,300
40
$236,525
2
$137,500
5
$205,000
0
$0
Aggregated Statistics For Year 2005 (Based on 1 full tract)
A) FHA, FSA/RHS & VA Home Purchase Loans
B) Conventional Home Purchase Loans
C) Refinancings
D) Home Improvement Loans
E) Loans on Dwellings For 5+ Families
F) Non-occupant Loans on < 5 Family Dwellings (A B C & D)
G) Loans On Manufactured Home Dwelling (A B C & D)
Number
Average Value
Number
Average Value
Number
Average Value
Number
Average Value
Number
Average Value
Number
Average Value
Number
Average Value
LOANS ORIGINATED
8
$246,875
210
$176,419
378
$181,426
47
$95,340
0
$0
65
$182,385
0
$0
APPLICATIONS APPROVED, NOT ACCEPTED
0
$0
30
$189,067
66
$185,242
10
$19,100
0
$0
8
$178,375
0
$0
APPLICATIONS DENIED
0
$0
60
$200,100
207
$192,048
69
$81,855
0
$0
15
$166,933
0
$0
APPLICATIONS WITHDRAWN
3
$201,667
59
$169,322
165
$180,721
24
$214,792
1
$224,000
15
$156,533
1
$78,000
FILES CLOSED FOR INCOMPLETENESS
1
$265,000
21
$200,952
106
$198,575
0
$0
0
$0
5
$161,600
0
$0
Aggregated Statistics For Year 2004 (Based on 1 full tract)
A) FHA, FSA/RHS & VA Home Purchase Loans
B) Conventional Home Purchase Loans
C) Refinancings
D) Home Improvement Loans
E) Loans on Dwellings For 5+ Families
F) Non-occupant Loans on < 5 Family Dwellings (A B C & D)
G) Loans On Manufactured Home Dwelling (A B C & D)
Number
Average Value
Number
Average Value
Number
Average Value
Number
Average Value
Number
Average Value
Number
Average Value
Number
Average Value
LOANS ORIGINATED
15
$205,267
241
$172,191
355
$161,101
76
$76,632
0
$0
73
$151,795
3
$32,000
APPLICATIONS APPROVED, NOT ACCEPTED
1
$172,000
42
$188,381
65
$158,200
16
$52,500
1
$182,000
13
$156,692
0
$0
APPLICATIONS DENIED
0
$0
59
$172,915
166
$168,223
50
$89,600
0
$0
17
$163,118
0
$0
APPLICATIONS WITHDRAWN
7
$194,714
37
$180,676
183
$155,426
18
$93,722
0
$0
16
$145,438
1
$232,000
FILES CLOSED FOR INCOMPLETENESS
1
$190,000
9
$201,333
95
$165,368
6
$62,833
0
$0
2
$178,500
0
$0
Aggregated Statistics For Year 2003 (Based on 1 full tract)
A) FHA, FSA/RHS & VA Home Purchase Loans
B) Conventional Home Purchase Loans
C) Refinancings
D) Home Improvement Loans
F) Non-occupant Loans on < 5 Family Dwellings (A B C & D)
Number
Average Value
Number
Average Value
Number
Average Value
Number
Average Value
Number
Average Value
LOANS ORIGINATED
39
$166,692
152
$152,684
438
$131,658
32
$46,375
62
$122,565
APPLICATIONS APPROVED, NOT ACCEPTED
9
$176,111
23
$154,261
103
$127,126
8
$30,625
12
$141,583
APPLICATIONS DENIED
12
$170,417
37
$154,162
211
$132,900
37
$35,297
18
$130,722
APPLICATIONS WITHDRAWN
13
$185,154
26
$123,462
182
$140,918
13
$60,769
10
$97,500
FILES CLOSED FOR INCOMPLETENESS
6
$169,667
10
$132,600
19
$137,684
8
$57,500
0
$0
Aggregated Statistics For Year 2002 (Based on 1 full tract)
A) FHA, FSA/RHS & VA Home Purchase Loans
B) Conventional Home Purchase Loans
C) Refinancings
D) Home Improvement Loans
F) Non-occupant Loans on < 5 Family Dwellings (A B C & D)
Number
Average Value
Number
Average Value
Number
Average Value
Number
Average Value
Number
Average Value
LOANS ORIGINATED
51
$144,294
106
$124,028
322
$107,230
31
$23,839
42
$97,786
APPLICATIONS APPROVED, NOT ACCEPTED
3
$165,667
26
$111,154
71
$104,239
17
$26,471
9
$64,444
APPLICATIONS DENIED
7
$154,714
29
$126,897
157
$100,656
38
$34,500
16
$102,625
APPLICATIONS WITHDRAWN
14
$139,000
22
$111,318
158
$110,639
32
$33,188
14
$65,214
FILES CLOSED FOR INCOMPLETENESS
1
$153,000
8
$107,875
34
$108,265
6
$43,833
1
$120,000
Aggregated Statistics For Year 2001 (Based on 1 full tract)
A) FHA, FSA/RHS & VA Home Purchase Loans
B) Conventional Home Purchase Loans
C) Refinancings
D) Home Improvement Loans
F) Non-occupant Loans on < 5 Family Dwellings (A B C & D)
Number
Average Value
Number
Average Value
Number
Average Value
Number
Average Value
Number
Average Value
LOANS ORIGINATED
56
$117,518
93
$103,161
194
$96,469
38
$37,316
24
$96,625
APPLICATIONS APPROVED, NOT ACCEPTED
2
$91,500
16
$102,312
55
$84,618
14
$35,357
12
$77,750
APPLICATIONS DENIED
10
$124,300
21
$99,619
173
$88,792
49
$22,000
16
$78,188
APPLICATIONS WITHDRAWN
12
$122,500
15
$95,333
121
$90,537
22
$57,864
7
$69,714
FILES CLOSED FOR INCOMPLETENESS
4
$101,750
2
$161,500
26
$88,423
2
$25,000
2
$84,500
Aggregated Statistics For Year 2000 (Based on 1 full tract)
A) FHA, FSA/RHS & VA Home Purchase Loans
B) Conventional Home Purchase Loans
C) Refinancings
D) Home Improvement Loans
E) Loans on Dwellings For 5+ Families
F) Non-occupant Loans on < 5 Family Dwellings (A B C & D)
Number
Average Value
Number
Average Value
Number
Average Value
Number
Average Value
Number
Average Value
Number
Average Value
LOANS ORIGINATED
43
$102,721
83
$89,277
70
$90,886
26
$23,115
1
$153,000
24
$73,292
APPLICATIONS APPROVED, NOT ACCEPTED
1
$118,000
15
$84,733
29
$68,793
15
$44,000
0
$0
5
$56,600
APPLICATIONS DENIED
7
$99,571
42
$96,167
148
$74,243
39
$30,205
0
$0
10
$69,200
APPLICATIONS WITHDRAWN
10
$91,200
21
$89,238
110
$72,182
4
$33,750
0
$0
9
$83,000
FILES CLOSED FOR INCOMPLETENESS
1
$90,000
2
$152,500
14
$95,714
2
$30,000
0
$0
3
$115,000
Aggregated Statistics For Year 1999 (Based on 1 full tract)
A) FHA, FSA/RHS & VA Home Purchase Loans
B) Conventional Home Purchase Loans
C) Refinancings
D) Home Improvement Loans
F) Non-occupant Loans on < 5 Family Dwellings (A B C & D)
Detailed PMIC statistics for the following Tracts:1595.08
2009 - 2018 National Fire Incident Reporting System (NFIRS) incidents
Based on the data from the years 2009 - 2018 the average number of fire incidents per year is 60. The highest number of fires - 193 took place in 2009, and the least - 30 in 2017. The data has a decreasing trend.
When looking into fire subcategories, the most reports belonged to: Structure Fires (35.5%), and Other (31.6%).
Fire incident types reported to NFIRS in Mastic Beach, NY
#28 on the list of "Top 101 cities with largest percentage of females in industries: transportation and warehousing (population 5,000+)"
#56 on the list of "Top 101 cities with largest percentage of females in occupations: transportation occupations (population 5,000+)"
#61 on the list of "Top 101 cities with the most people living the same house as 1 year ago (population 5,000+))"
#70 on the list of "Top 101 cities with largest percentage of males in occupations: installation, maintenance, and repair occupations (population 5,000+)"
#19 (11951) on the list of "Top 101 zip codes with the lowest 2012 average net capital gain/loss (pop 5,000+)"
#49 (11951) on the list of "Top 101 zip codes with the largest percentage of Irish first ancestries (pop 5,000+)"
#3 on the list of "Top 101 counties with the most Catholic adherents"
#6 on the list of "Top 101 counties with the lowest percentage of residents relocating from other counties between 2010 and 2011"
#7 on the list of "Top 101 counties with the lowest surface withdrawal of fresh water for public supply (pop. 50,000+)"
#9 on the list of "Top 101 counties with the lowest percentage of residents relocating to other counties in 2011"
#19 on the list of "Top 101 counties with the highest ground withdrawal of fresh water for public supply (pop. 50,000+)"


 Recent articles from our blog. Our writers, many of them Ph.D. graduates or candidates, create easy-to-read articles on a wide variety of topics.

 (20.9 miles
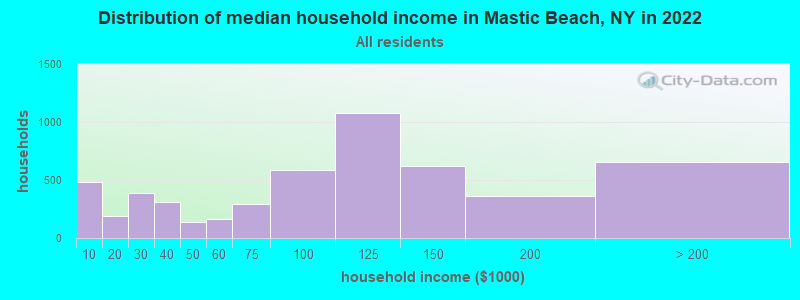


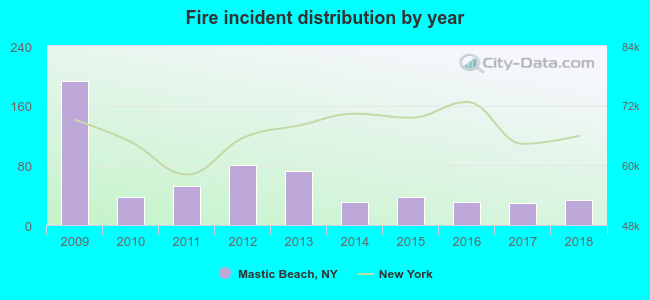 Based on the data from the years 2009 - 2018 the average number of fire incidents per year is 60. The highest number of fires - 193 took place in 2009, and the least - 30 in 2017. The data has a decreasing trend.
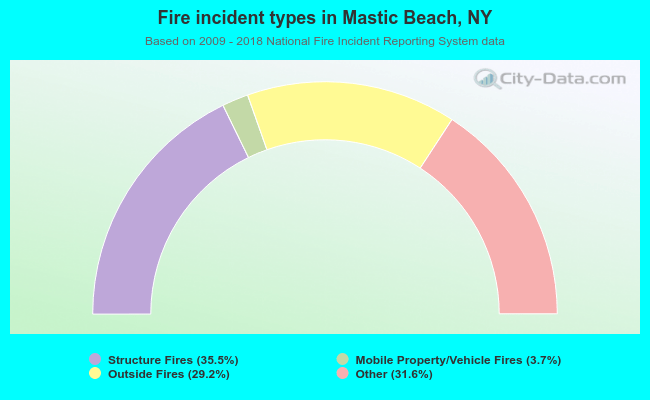 When looking into fire subcategories, the most reports belonged to: Structure Fires (35.5%), and Other (31.6%).