Los Angeles Subdivision, Texas
Submit your own pictures of this place and show them to the world
- OSM Map
- General Map
- Google Map
- MSN Map

| Males: 43 | |
| Females: 44 |
| Median resident age: | 21.5 years |
| Texas median age: | 32.3 years |
Zip code: 78580
| Los Angeles Subdivision: | $8,628 |
| TX: | $72,284 |
Estimated per capita income in 2022: $5,894 (it was $2,701 in 2000)
Estimated median house or condo value in 2022: $46,217 (it was $20,000 in 2000)
| Los Angeles Subdivision: | $46,217 |
| TX: | $275,400 |
Mean prices in 2022: all housing units: $115,327; detached houses: $121,865; townhouses or other attached units: $95,713; mobile homes: $64,029
Los Angeles Subdivision, TX residents, houses, and apartments details
Detailed information about poverty and poor residents in Los Angeles Subdivision, TX
Compare current foreclosures near Los Angeles Subdivision, TX:


- 8194.2%Hispanic
- 55.8%White alone

 Recent articles from our blog. Our writers, many of them Ph.D. graduates or candidates, create easy-to-read articles on a wide variety of topics.

 | Texas Trivia (1626 replies) |
Current Local Time: CST time zone
Land area: 0.17 square miles.
Population density: 527 people per square mile (low).

23 residents are foreign born (26.7% Latin America).
| This place: | 26.7% |
| Texas: | 13.9% |
| Los Angeles Subdivision CDP: | 1.0% ($200) |
| Texas: | 1.8% ($1,393) |
Nearest city with pop. 50,000+: Harlingen, TX  (21.7 miles , pop. 57,564).
Nearest city with pop. 200,000+: Corpus Christi, TX (89.5 miles , pop. 277,454).
Nearest city with pop. 1,000,000+: San Antonio, TX (209.3 miles , pop. 1,144,646).
Nearest cities:
), ), ), ), )Latitude: 26.49 N, Longitude: 97.79 W
Area code commonly used in this area: 956


| Here: | 6.1% |
| Texas: | 3.5% |
Average climate in Los Angeles Subdivision, Texas
Based on data reported by over 4,000 weather stations


(lower is better)

Air Quality Index (AQI) level in 2022 was 40.6. This is significantly better than average.
| City: | 40.6 |
| U.S.: | 72.6 |

Ozone [ppb] level in 2022 was 24.4. This is better than average. Closest monitor was 20.9 miles away from the city center.
| City: | 24.4 |
| U.S.: | 33.3 |
Tornado activity:
Los Angeles Subdivision-area historical tornado activity is significantly below Texas state average. It is 72% smaller than the overall U.S. average.
On 5/12/1969, a category F3 (max. wind speeds 158-206 mph) tornado 20.1 miles away from the Los Angeles Subdivision place center caused between $5000 and $50,000 in damages.
On 5/12/1969, a category F3 tornado 29.7 miles away from the place center caused between $5000 and $50,000 in damages.
Earthquake activity:
Los Angeles Subdivision-area historical earthquake activity is above Texas state average. It is 57% smaller than the overall U.S. average.On 10/20/2011 at 12:24:41, a magnitude 4.8 (4.8 MW, Depth: 3.1 mi, Class: Light, Intensity: IV - V) earthquake occurred 164.9 miles away from Los Angeles Subdivision center
On 4/9/1993 at 12:29:19, a magnitude 4.3 (4.1 MB, 4.3 LG, Depth: 3.1 mi) earthquake occurred 161.5 miles away from the city center
On 4/25/2010 at 02:10:42, a magnitude 3.9 (3.9 MB, Depth: 3.1 mi, Class: Light, Intensity: II - III) earthquake occurred 84.0 miles away from the city center
On 11/13/2017 at 11:23:01, a magnitude 3.9 (3.9 MD, Depth: 3.1 mi) earthquake occurred 96.7 miles away from Los Angeles Subdivision center
On 4/14/1995 at 00:32:56, a magnitude 5.7 (5.6 MB, 5.7 MS, 5.7 MW, Depth: 11.1 mi, Class: Moderate, Intensity: VI - VII) earthquake occurred 428.6 miles away from Los Angeles Subdivision center
On 3/24/1997 at 22:31:34, a magnitude 3.8 (3.8 LG, Depth: 3.1 mi) earthquake occurred 86.1 miles away from the city center
Magnitude types: regional Lg-wave magnitude (LG), body-wave magnitude (MB), duration magnitude (MD), surface-wave magnitude (MS), moment magnitude (MW)
Natural disasters:
The number of natural disasters in Willacy County (18) is near the US average (15).Major Disasters (Presidential) Declared: 9
Emergencies Declared: 7
Causes of natural disasters: Hurricanes: 11, Floods: 4, Storms: 3, Tornadoes: 2, Winds: 2, Fire: 1, Heavy Rain: 1, Tropical Storm: 1, Other: 1 (Note: some incidents may be assigned to more than one category).
Colleges/universities with over 2000 students nearest to Los Angeles Subdivision:
- Texas State Technical College-Harlingen (about 21 miles; Harlingen, TX; Full-time enrollment: 3,700)
- The University of Texas-Pan American (about 28 miles; Edinburg, TX; FT enrollment: 16,766)
- South Texas College (about 35 miles; McAllen, TX; FT enrollment: 19,701)
- The University of Texas at Brownsville (about 46 miles; Brownsville, TX; FT enrollment: 9,165)
- Texas A & M University-Kingsville (about 72 miles; Kingsville, TX; FT enrollment: 9,295)
- Texas A & M University-Corpus Christi (about 90 miles; Corpus Christi, TX; FT enrollment: 9,092)
- Del Mar College (about 91 miles; Corpus Christi, TX; FT enrollment: 5,213)
Points of interest:
| This place: | 3.7 people |
| Texas: | 2.7 people |
| This place: | 91.3% |
| Whole state: | 71.5% |
| This place: | 4.3% |
| Whole state: | 4.4% |
No gay or lesbian households reported
| This place: | 100.0% |
| Whole state: | 15.4% |
| This place: | 37.3% |
| Whole state: | 6.7% |
For population 15 years and over in Los Angeles Subdivision:

- Never married: 33.3%
- Now married: 45.1%
- Separated: 0.0%
- Widowed: 0.0%
- Divorced: 21.6%
For population 25 years and over in Los Angeles Subdivision:
- High school or higher: 17.6%
- Bachelor's degree or higher: 0.0%
- Graduate or professional degree: 0.0%
- Unemployed: 22.7%
- Mean travel time to work (commute): 42.4 minutes


| Here: | 18.7 |
| Texas average: | 15.6 |
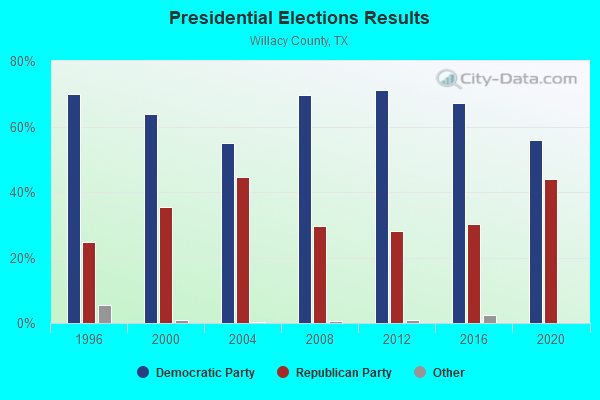
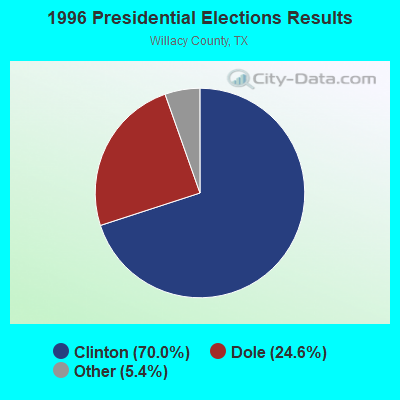
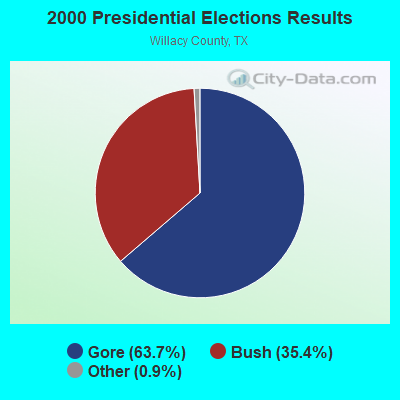
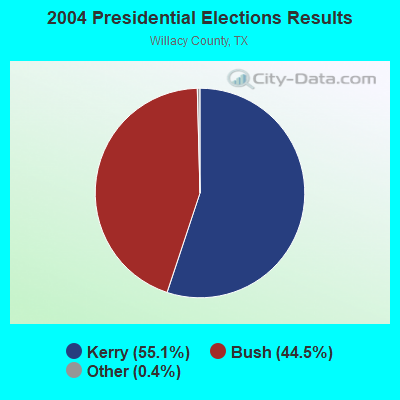
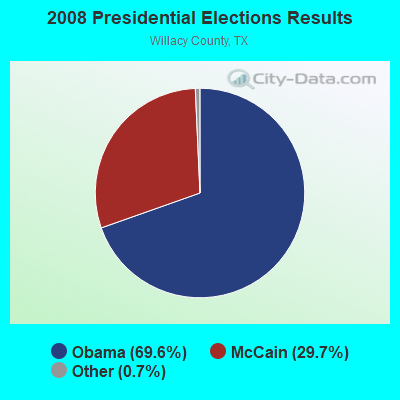
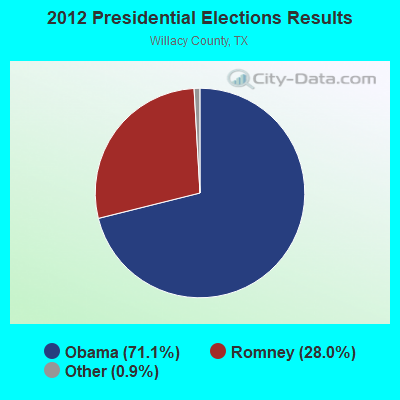
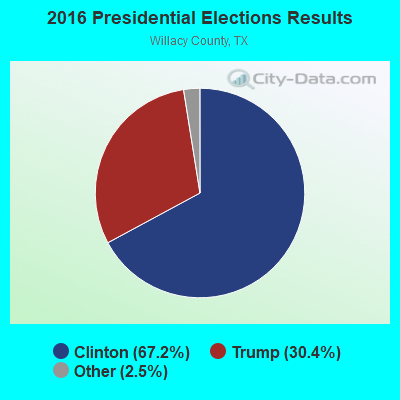
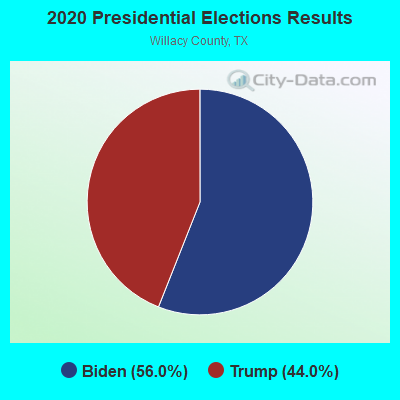
Graphs represent county-level data. Detailed 2008 Election Results
Religion statistics for Los Angeles Subdivision, TX (based on Willacy County data)
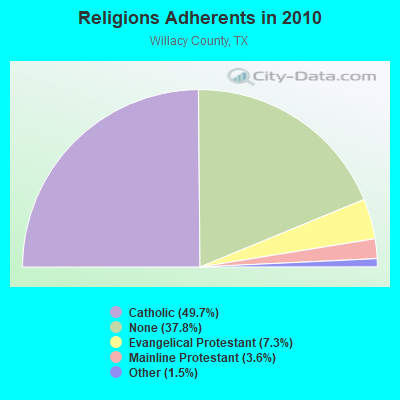
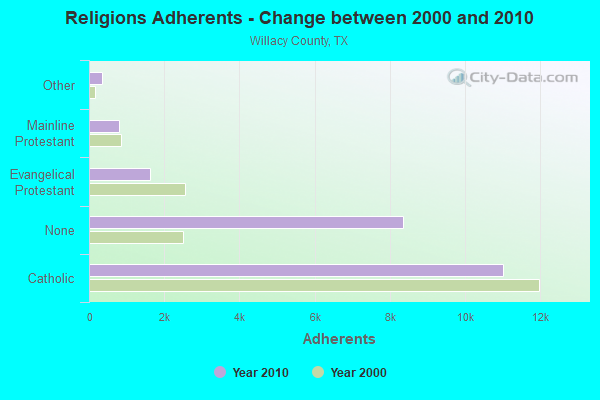
| Religion | Adherents | Congregations |
|---|---|---|
| Catholic | 11,010 | 6 |
| Evangelical Protestant | 1,614 | 22 |
| Mainline Protestant | 806 | 8 |
| Other | 337 | 2 |
| None | 8,367 | - |
Food Environment Statistics:
| This county: | 0.49 / 10,000 pop. |
| Texas: | 1.47 / 10,000 pop. |
| This county: | 0.49 / 10,000 pop. |
| State: | 1.11 / 10,000 pop. |
| Willacy County: | 4.89 / 10,000 pop. |
| State: | 3.95 / 10,000 pop. |
| This county: | 3.91 / 10,000 pop. |
| Texas: | 6.13 / 10,000 pop. |
| Here: | 8.8% |
| State: | 8.9% |
| This county: | 27.6% |
| Texas: | 26.6% |
| Willacy County: | 18.0% |
| Texas: | 15.7% |
Strongest AM radio stations in Los Angeles Subdivision:
- KGBT (1530 AM; 50 kW; HARLINGEN, TX; Owner: TICHENOR LICENSE CORPORATION)
- KSOX (1240 AM; 1 kW; RAYMONDVILLE, TX; Owner: VOICE OF VALLEY AGRICULTURE, INC.)
- KURV (710 AM; 10 kW; EDINBURG, TX; Owner: VOICE OF VALLEY AGRICULTURE, INC.)
- KUBR (1210 AM; 10 kW; SAN JUAN, TX; Owner: PAULINO BERNAL)
- KVJY (840 AM; 5 kW; PHARR, TX; Owner: RADIO UNICA OF MCALLEN LICENSE CORP.)
- KRGE (1290 AM; 5 kW; WESLACO, TX; Owner: CHRISTIAN MINISTRIES OF THE VALLEY)
- KQXX (1700 AM; 10 kW; BROWNSVILLE, TX; Owner: LA NUEVA KBOR, INC.)
- KRIO (910 AM; 5 kW; MCALLEN, TX; Owner: RIO GRANDE BIBLE INSTITUTE, INC.)
- KCTA (1030 AM; 50 kW; CORPUS CHRISTI, TX; Owner: BROADCASTING CORPORATION OF THE SOUTHWEST)
- KBOR (1600 AM; 10 kW; BROWNSVILLE, TX; Owner: LA NUEVA KBOR, INC.)
- KTKR (760 AM; 50 kW; SAN ANTONIO, TX; Owner: CCB TEXAS LICENSES, L.P.)
- KKYX (680 AM; 50 kW; SAN ANTONIO, TX; Owner: CXR HOLDINGS, INC.)
- WOAI (1200 AM; 50 kW; SAN ANTONIO, TX; Owner: CCB TEXAS LICENSES, L.P.)
Strongest FM radio stations in Los Angeles Subdivision:
- KBIC (105.7 FM; RAYMONDVILLE, TX; Owner: CHRISTIAN MINISTRIES OF THE VALLEY)
- KILM (102.1 FM; RAYMONDVILLE, TX; Owner: BMP 102.1 FM, LP)
- KVLY (107.9 FM; EDINBURG, TX; Owner: ENTRAVISION HOLDINGS, L.L.C.)
- KTEX (100.3 FM; BROWNSVILLE, TX; Owner: CAPSTAR TX LIMITED PARTNERSHIP)
- KFRQ (94.5 FM; HARLINGEN, TX; Owner: ENTRAVISION HOLDINGS, L.L.C.)
- KGBT-FM (98.5 FM; MCALLEN, TX; Owner: TICHENOR LICENSE CORPORATION ("TLC"))
- KTER (90.7 FM; RUDOLPH, TX; Owner: FAITH PLEASES GOD CHURCH CORP.)
- KBFM (104.1 FM; EDINBURG, TX; Owner: CAPSTAR TX LIMITED PARTNERSHIP)
- KVMV (96.9 FM; MCALLEN, TX; Owner: WORLD RADIO NETWORK, INC.)
- KBTQ (96.1 FM; HARLINGEN, TX; Owner: TICHENOR LICENSE CORPORATION ("TLC"))
- KKPS (99.5 FM; BROWNSVILLE, TX; Owner: ENTRAVISION HOLDINGS, L.L.C.)
- KMAZ (106.3 FM; MERCEDES, TX; Owner: LA NUEVA KBOR, INC.)
TV broadcast stations around Los Angeles Subdivision:
- KMAO-LP (Channel 50; RAYMONDVILLE, TX; Owner: ARACELIS ORTIZ)
- KRYM-LP (Channel 55; RAYMONDVILLE, TX; Owner: ALMA L. RODRIGUEZ)
- KRGV-TV (Channel 5; WESLACO, TX; Owner: MOBILE VIDEO TAPES, INC.)
- KLUJ (Channel 44; HARLINGEN, TX; Owner: COMMUNITY EDUCATIONAL TELEVISION)
- KGBT-TV (Channel 4; HARLINGEN, TX; Owner: LIBCO, INC.)
- KVEO (Channel 23; BROWNSVILLE, TX; Owner: COMCORP OF TEXAS LICENSE CORP.)
- KMBH (Channel 60; HARLINGEN, TX; Owner: RGV EDUCATIONAL BROADCASTING, INC.)
- KTLM (Channel 40; RIO GRANDE CITY, TX; Owner: SUNBELT MULTIMEDIA CO.)
- KNVO (Channel 48; Mc ALLEN, TX; Owner: ENTRAVISION HOLDINGS, LLC)
- KTIZ-LP (Channel 52; HARLINGEN, TX; Owner: ORTIZ BROADCASTING CORPORATION)
- KFTN-LP (Channel 30; La FERIA, TX; Owner: ORTIZ BROADCASTING CORPORATION)
- National Bridge Inventory (NBI) Statistics
- 1Number of bridges
- 7ft / 1.9mTotal length
- 187Total average daily traffic
- 44Total average daily truck traffic
- 300Total future (year 2033) average daily traffic

- 50.0%Bottled, tank, or LP gas
- 50.0%Electricity

- 54.5%Bottled, tank, or LP gas
- 45.5%Utility gas
Los Angeles Subdivision compared to Texas state average:
- Median household income significantly below state average.
- Median house value significantly below state average.
- Black race population percentage significantly below state average.
- Hispanic race population percentage above state average.
- Median age significantly below state average.
- Foreign-born population percentage above state average.
- Renting percentage significantly below state average.
- Length of stay since moving in significantly above state average.
- Number of rooms per house significantly below state average.
- House age significantly below state average.
- Number of college students significantly below state average.
- Percentage of population with a bachelor's degree or higher significantly below state average.