Percentage of residents living in poverty in 2022: 20.8%
(22.3% for White Non-Hispanic residents, 26.9% for Black residents, 2.4% for Hispanic or Latino residents, 16.2% for two or more races residents)
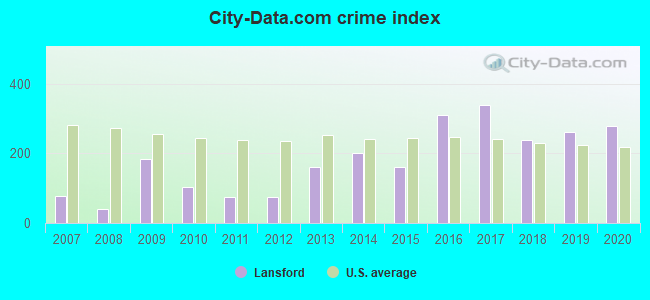
The City-Data.com crime index weighs serious crimes and violent crimes more heavily. Higher means more crime, U.S. average is 246.1. It adjusts for the number of visitors and daily workers commuting into cities.
Latest news from Lansford, PA collected exclusively by city-data.com from local newspapers, TV, and radio stations
Ancestries: German (14.4%), Irish (10.9%), Italian (8.4%), Slovak (7.4%), Pennsylvania German (3.8%), English (3.7%).
Current Local Time: EST time zone
Incorporated in 1877
Elevation: 1134 feet
Land area: 1.56 square miles.
Population density: 2,665 people per square mile (average).
115 residents are foreign born (2.3% Latin America, 0.4% Asia).
This borough:
2.8%
Pennsylvania:
7.3%
Median real estate property taxes paid for housing units with mortgages in 2022: $1,458 (1.7%) Median real estate property taxes paid for housing units with no mortgage in 2022: $983 (2.2%)
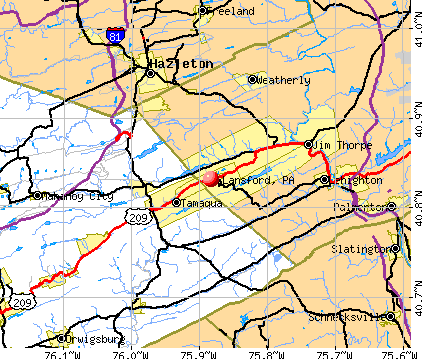
Nearest city with pop. 50,000+: Allentown, PA (26.6 miles , pop. 106,632).
Nearest city with pop. 200,000+: Philadelphia, PA (69.5 miles , pop. 1,517,550).
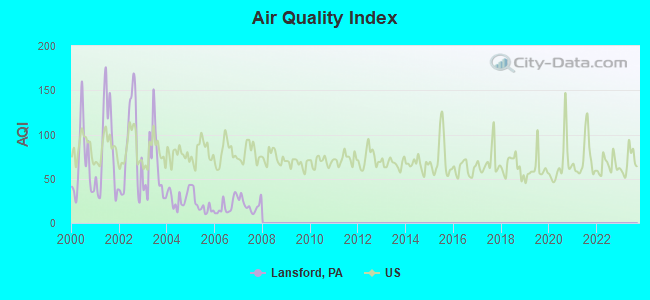
Air Quality Index (AQI) level in 2007 was 20.5. This is significantly better than average.
City:
20.5
U.S.:
72.6
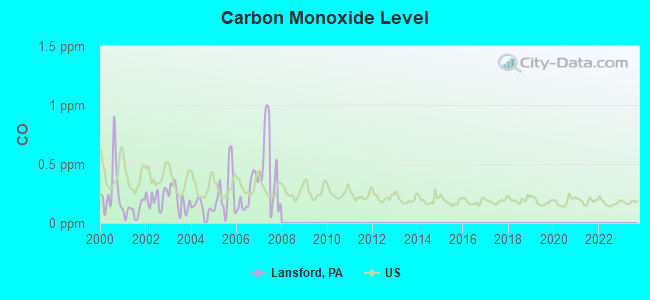
Carbon Monoxide (CO) [ppm] level in 2007 was 0.462. This is significantly worse than average.Closest monitor was 17.2 miles away from the city center.
City:
0.462
U.S.:
0.251
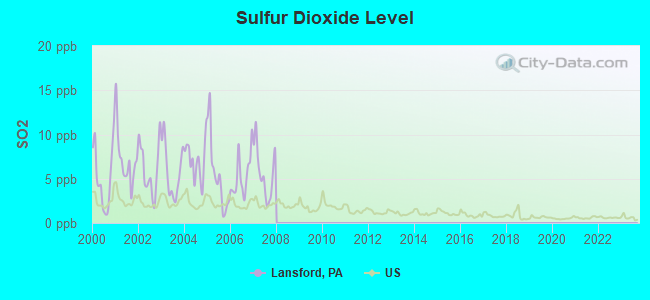
Sulfur Dioxide (SO2) [ppb] level in 2007 was 5.72. This is significantly worse than average.Closest monitor was 17.2 miles away from the city center.
City:
5.72
U.S.:
1.51
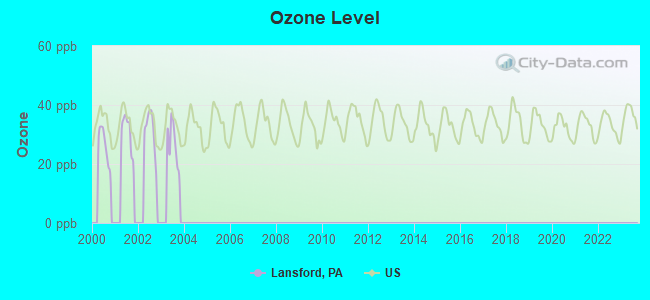
Ozone [ppb] level in 2003 was 26.9. This is better than average.Closest monitor was 22.7 miles away from the city center.
City:
26.9
U.S.:
33.3
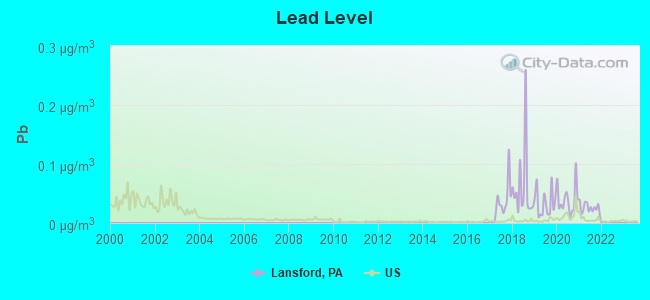
Lead (Pb) [µg/m3] level in 2021 was 0.0255. This is significantly worse than average.Closest monitor was 1.1 miles away from the city center.
City:
0.0255
U.S.:
0.0093
Tornado activity:
Lansford-area historical tornado activity is slightly above Pennsylvania state average. It is 5% smaller than the overall U.S. average.
On 7/26/1981, a category F3 (max. wind speeds 158-206 mph) tornado 16.4 miles away from the Lansford borough center injured 2 peopleand causedbetween $50,000 and $500,000 in damages.
On 5/31/1998, a category F3 tornado 24.3 miles away from the borough center injured 7 peopleand caused $1 million in damages.
Earthquake activity:
Lansford-area historical earthquake activity is significantly above Pennsylvania state average. It is 65% smaller than the overall U.S. average.
On 8/23/2011 at 17:51:04, a magnitude 5.8 (5.8 MW, Depth: 3.7 mi, Class: Moderate, Intensity: VI - VII) earthquake occurred 230.0 miles away from the city center On 1/16/1994 at 01:49:16, a magnitude 4.6 (4.6 MB, 4.6 LG, Depth: 3.1 mi, Class: Light, Intensity: IV - V) earthquake occurred 35.6 miles away from Lansford center On 10/7/1983 at 10:18:46, a magnitude 5.3 (5.1 MB, 5.3 LG, 5.1 ML) earthquake occurred 229.8 miles away from Lansford center On 1/16/1994 at 00:42:43, a magnitude 4.2 (4.2 MB, 4.0 LG, Depth: 3.1 mi) earthquake occurred 35.5 miles away from Lansford center On 9/25/1998 at 19:52:52, a magnitude 5.2 (4.8 MB, 4.3 MS, 5.2 LG, 4.5 MW, Depth: 3.1 mi) earthquake occurred 239.3 miles away from Lansford center On 4/20/2002 at 10:50:47, a magnitude 5.3 (5.3 ML, Depth: 3.0 mi) earthquake occurred 277.8 miles away from Lansford center Magnitude types: regional Lg-wave magnitude (LG), body-wave magnitude (MB), local magnitude (ML), surface-wave magnitude (MS), moment magnitude (MW)
Natural disasters:
The number of natural disasters in Carbon County (16) is near the US average (15). Major Disasters (Presidential) Declared: 11 Emergencies Declared: 5
Causes of natural disasters: Floods: 3, Hurricanes: 3, Storms: 3, Snowstorms: 2, Tropical Storms: 2, Winter Storms: 2, Blizzard: 1, Mudslide: 1, Snowfall: 1, Tropical Depression: 1, Water Shortage: 1, Other: 1 (Note: some incidents may be assigned to more than one category).
Hospitals and medical centers near Lansford:
REDCO GROUP/SUMMIT HILL,THE (Hospital, about 2 miles away; SUMMIT HILL, PA)
ST LUKE'S MINERS MEMORIAL HOSPITAL Acute Care Hospitals (about 2 miles away; COALDALE, PA)
ST LUKE'S REHABILITATION AND NURSING CENTER (Nursing Home, about 2 miles away; COALDALE, PA)
FRESENIUS MEDICAL CARE TAMAQUA (Dialysis Facility, about 5 miles away; TAMAQUA, PA)
ST LUKE'S MINERS MEM HOME CARE (Home Health Center, about 5 miles away; TAMAQUA, PA)
HOMETOWN NURSING AND REHAB CEN (Nursing Home, about 5 miles away; TAMAQUA, PA)
MAHONING VALLEY NURSING AND RE (Nursing Home, about 7 miles away; LEHIGHTON, PA)
Colleges/universities with over 2000 students nearest to Lansford:
Lehigh Carbon Community College (about 19 miles; Schnecksville, PA; Full-time enrollment: 4,391)
McCann School of Business & Technology (about 22 miles; Pottsville, PA; FT enrollment: 3,412)
Kutztown University of Pennsylvania (about 23 miles; Kutztown, PA; FT enrollment: 9,099)
Muhlenberg College (about 26 miles; Allentown, PA; FT enrollment: 2,792)
Luzerne County Community College (about 26 miles; Nanticoke, PA; FT enrollment: 4,724)
Wilkes University (about 29 miles; Wilkes-Barre, PA; FT enrollment: 3,912)
King's College (about 29 miles; Wilkes-Barre, PA; FT enrollment: 2,392)
Public high school in Lansford:
PANTHER VALLEY SHS(Students: 555, Location: 912 COAL REGION WAY, Grades: 9-12)
Public elementary/middle school in Lansford:
PANTHER VALLEY MS(Students: 361, Location: 678 PANTHER PRIDE DRIVE, Grades: 6-8)
Private elementary/middle school in Lansford:
OUR LADY OF THE ANGELS ACADEMY (Students: 130, Location: 123 E WATER ST, Grades: PK-8)
Tourist attraction: 9 Coal Mine & Museum (9 Dock Street).
Birthplace of: Mike Holovak - Football player, Richard Marcinko - Navy SEAL, Benjamin Bloom - Educationist, John M. Riebe - Aerospace engineer, Thomas Kennedy (unionist) - Labor leader, John R. Chuckran - Football coach.
Carbon County has a predicted average indoor radon screening level greater than 4 pCi/L (pico curies per liter) - Highest Potential
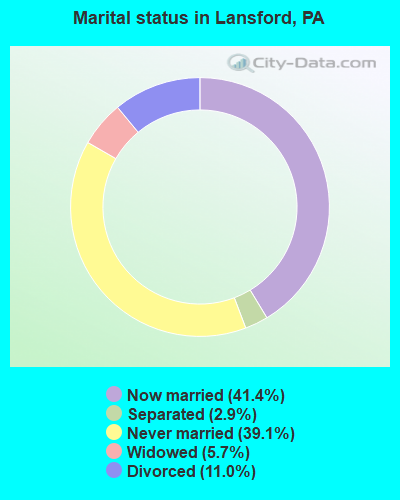
Average household size:
This borough:
2.3 people
Pennsylvania:
2.5 people
Percentage of family households:
This borough:
57.3%
Whole state:
65.0%
Percentage of households with unmarried partners:
This borough:
9.7%
Whole state:
6.6%
Likely homosexual households (counted as self-reported same-sex unmarried-partner households)
Lesbian couples: 0.5% of all households
Gay men: 0.2% of all households
26 people in nursing facilities/skilled-nursing facilities in 2010
9 people in group homes intended for adults in 2010
28 people in nursing homes in 2000
7 people in homes for the mentally retarded in 2000
Banks with branches in Lansford (2011 data):
Bank of America, National Association: Lansford Branch at 12 West Ridge Street, branch established on 1989/11/10. Info updated 2009/11/18: Bank assets: $1,451,969.3 mil, Deposits: $1,077,176.8 mil, headquarters in Charlotte, NC, positive income, 5782 total offices, Holding Company: Bank Of America Corporation
The Jim Thorpe National Bank: Lansford Branch at 430 West Patterson Street, branch established on 2005/11/17. Info updated 2009/01/30: Bank assets: $161.4 mil, Deposits: $145.0 mil, headquarters in Jim Thorpe, PA, positive income, 6 total offices, Holding Company: Jtnb Bancorp, Inc.
First Niagara Bank, National Association: Lansford Branch at 13 West Ridge Street, branch established on 1903/12/03. Info updated 2011/06/09: Bank assets: $32,750.6 mil, Deposits: $19,595.4 mil, headquarters in Buffalo, NY, positive income, Commercial Lending Specialization, 351 total offices, Holding Company: First Niagara Financial Group, Inc.
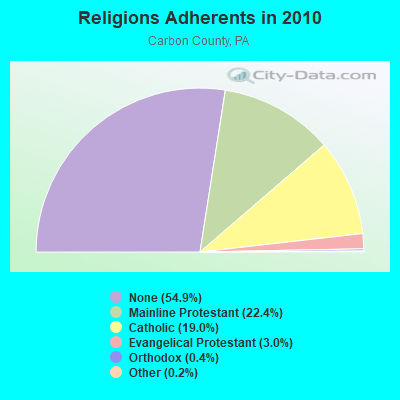
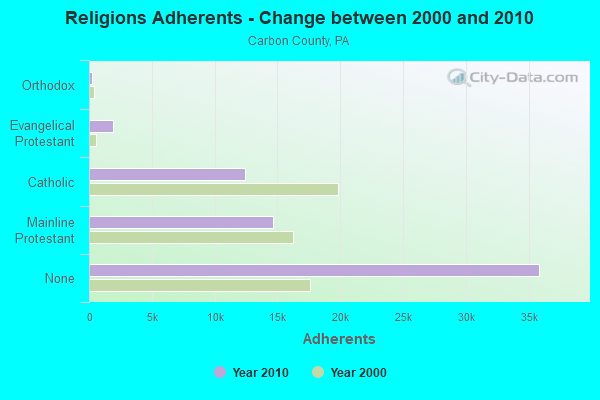
Religion statistics for Lansford, PA (based on Carbon County data)
Religion
Adherents
Congregations
Mainline Protestant
14,613
52
Catholic
12,418
14
Evangelical Protestant
1,943
18
Orthodox
264
2
Other
162
3
None
35,849
-
Source: Clifford Grammich, Kirk Hadaway, Richard Houseal, Dale E.Jones, Alexei Krindatch, Richie Stanley and Richard H.Taylor. 2012. 2010 U.S.Religion Census: Religious Congregations & Membership Study. Association of Statisticians of American Religious Bodies. Jones, Dale E., et al. 2002. Congregations and Membership in the United States 2000. Nashville, TN: Glenmary Research Center. Graphs represent county-level data
.08 Mi S Of Int Pa Rt 902 & Us Rt 209 (Lat: 40.831472 Lon: -75.872417), Call Sign: WXR350, Assigned Frequencies: 155.175 MHz, 155.340 MHz, Grant Date: 08/22/2023, Expiration Date: 11/15/2033, Registrant: Green\'s Communications Inc, 210 West Market Street, Pottsville, PA 17901, Phone: (570) 628-5556, Fax: (570) 622-6666, Email:
FCC Registered Microwave Towers:
1
Us 209 650 Ft E Of Summit Hill Boro Line (Lat: 40.844528 Lon: -75.843250), Overall height: 62.5 m, Call Sign: WCX431, Assigned Frequencies: 950.000 MHz, Grant Date: 01/23/1989, Expiration Date: 08/01/2030, Registrant: Cc Broadcasting LLC, 2311 Easton Ave., Bethlehem, PA 18107-5009
Aircraft: GREENALL ROBERT E VANS RV-7 (Category: Land, Seats: 2, Weight: Up to 12,499 Pounds), Engine: LYCOMING YO-360-A1A (180 HP) (Reciprocating) N-Number: 516RG, N516RG, N-516RG, Serial Number: 72697, Year manufactured: 2017, Airworthiness Date: 11/24/2017, Certificate Issue Date: 03/08/2017 Registrant (Individual): Robert E Greenall, 420 W Bertsch St, Lansford, PA 18232
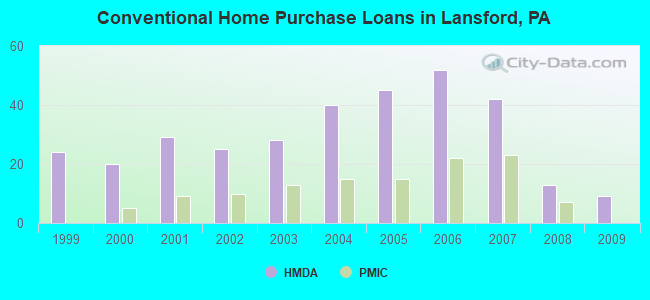
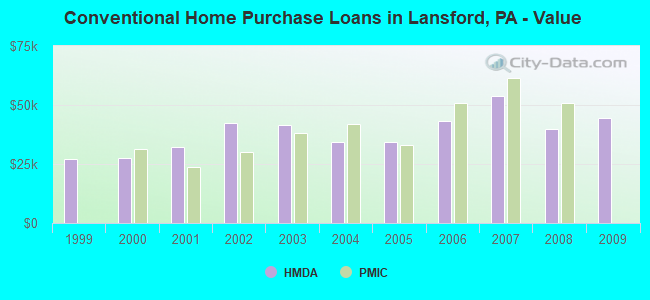
Home Mortgage Disclosure Act Aggregated Statistics For Year 2009 (Based on 1 full tract)
A) FHA, FSA/RHS & VA Home Purchase Loans
B) Conventional Home Purchase Loans
C) Refinancings
D) Home Improvement Loans
E) Loans on Dwellings For 5+ Families
F) Non-occupant Loans on < 5 Family Dwellings (A B C & D)
Number
Average Value
Number
Average Value
Number
Average Value
Number
Average Value
Number
Average Value
Number
Average Value
LOANS ORIGINATED
16
$53,375
9
$44,333
17
$62,882
8
$18,125
1
$110,000
11
$29,182
APPLICATIONS APPROVED, NOT ACCEPTED
1
$136,000
0
$0
2
$92,000
1
$32,000
1
$132,000
2
$92,000
APPLICATIONS DENIED
3
$68,667
10
$50,700
21
$52,381
5
$12,400
0
$0
2
$46,000
APPLICATIONS WITHDRAWN
3
$43,667
2
$40,000
9
$42,889
1
$35,000
0
$0
2
$40,000
FILES CLOSED FOR INCOMPLETENESS
0
$0
1
$50,000
2
$31,500
1
$22,000
0
$0
2
$51,000
Aggregated Statistics For Year 2008 (Based on 1 full tract)
A) FHA, FSA/RHS & VA Home Purchase Loans
B) Conventional Home Purchase Loans
C) Refinancings
D) Home Improvement Loans
E) Loans on Dwellings For 5+ Families
F) Non-occupant Loans on < 5 Family Dwellings (A B C & D)
G) Loans On Manufactured Home Dwelling (A B C & D)
Number
Average Value
Number
Average Value
Number
Average Value
Number
Average Value
Number
Average Value
Number
Average Value
Number
Average Value
LOANS ORIGINATED
15
$60,867
13
$39,692
30
$42,667
17
$19,706
1
$75,000
16
$36,438
0
$0
APPLICATIONS APPROVED, NOT ACCEPTED
0
$0
1
$34,000
5
$41,600
3
$10,000
0
$0
2
$20,500
0
$0
APPLICATIONS DENIED
2
$41,000
10
$51,200
39
$51,923
23
$35,739
1
$94,000
4
$61,000
3
$38,667
APPLICATIONS WITHDRAWN
2
$21,000
4
$41,000
13
$46,769
2
$3,500
0
$0
4
$37,000
1
$52,000
FILES CLOSED FOR INCOMPLETENESS
0
$0
1
$35,000
2
$57,000
0
$0
0
$0
0
$0
0
$0
Aggregated Statistics For Year 2007 (Based on 1 full tract)
A) FHA, FSA/RHS & VA Home Purchase Loans
B) Conventional Home Purchase Loans
C) Refinancings
D) Home Improvement Loans
E) Loans on Dwellings For 5+ Families
F) Non-occupant Loans on < 5 Family Dwellings (A B C & D)
Number
Average Value
Number
Average Value
Number
Average Value
Number
Average Value
Number
Average Value
Number
Average Value
LOANS ORIGINATED
6
$56,500
42
$54,000
36
$46,833
16
$30,688
3
$104,000
28
$39,464
APPLICATIONS APPROVED, NOT ACCEPTED
1
$57,000
6
$58,333
8
$56,875
1
$51,000
1
$245,000
3
$80,333
APPLICATIONS DENIED
1
$15,000
27
$52,556
65
$46,754
23
$27,391
0
$0
11
$50,000
APPLICATIONS WITHDRAWN
0
$0
3
$69,667
20
$55,950
0
$0
0
$0
2
$85,000
FILES CLOSED FOR INCOMPLETENESS
0
$0
5
$66,800
1
$90,000
1
$11,000
0
$0
1
$11,000
Aggregated Statistics For Year 2006 (Based on 1 full tract)
A) FHA, FSA/RHS & VA Home Purchase Loans
B) Conventional Home Purchase Loans
C) Refinancings
D) Home Improvement Loans
E) Loans on Dwellings For 5+ Families
F) Non-occupant Loans on < 5 Family Dwellings (A B C & D)
Number
Average Value
Number
Average Value
Number
Average Value
Number
Average Value
Number
Average Value
Number
Average Value
LOANS ORIGINATED
10
$59,900
52
$43,308
45
$40,044
27
$25,333
3
$100,667
24
$38,458
APPLICATIONS APPROVED, NOT ACCEPTED
0
$0
5
$65,200
8
$32,875
3
$9,667
0
$0
3
$42,667
APPLICATIONS DENIED
1
$99,000
21
$44,286
56
$48,018
41
$29,732
0
$0
14
$49,571
APPLICATIONS WITHDRAWN
1
$50,000
9
$42,778
9
$52,333
1
$80,000
0
$0
4
$46,500
FILES CLOSED FOR INCOMPLETENESS
0
$0
1
$58,000
8
$50,875
1
$40,000
0
$0
1
$40,000
Aggregated Statistics For Year 2005 (Based on 1 full tract)
A) FHA, FSA/RHS & VA Home Purchase Loans
B) Conventional Home Purchase Loans
C) Refinancings
D) Home Improvement Loans
E) Loans on Dwellings For 5+ Families
F) Non-occupant Loans on < 5 Family Dwellings (A B C & D)
G) Loans On Manufactured Home Dwelling (A B C & D)
Number
Average Value
Number
Average Value
Number
Average Value
Number
Average Value
Number
Average Value
Number
Average Value
Number
Average Value
LOANS ORIGINATED
6
$51,167
45
$34,156
50
$37,600
25
$20,280
1
$150,000
27
$28,259
0
$0
APPLICATIONS APPROVED, NOT ACCEPTED
0
$0
8
$44,375
14
$41,857
3
$21,333
0
$0
6
$34,000
0
$0
APPLICATIONS DENIED
1
$34,000
26
$51,615
66
$47,758
18
$17,333
1
$125,000
9
$36,667
2
$41,500
APPLICATIONS WITHDRAWN
0
$0
7
$61,571
30
$55,767
3
$117,667
0
$0
5
$47,600
0
$0
FILES CLOSED FOR INCOMPLETENESS
1
$39,000
3
$38,667
3
$63,667
0
$0
0
$0
1
$24,000
0
$0
Aggregated Statistics For Year 2004 (Based on 1 full tract)
A) FHA, FSA/RHS & VA Home Purchase Loans
B) Conventional Home Purchase Loans
C) Refinancings
D) Home Improvement Loans
E) Loans on Dwellings For 5+ Families
F) Non-occupant Loans on < 5 Family Dwellings (A B C & D)
Number
Average Value
Number
Average Value
Number
Average Value
Number
Average Value
Number
Average Value
Number
Average Value
LOANS ORIGINATED
5
$45,800
40
$34,225
33
$45,909
16
$11,938
1
$40,000
10
$30,500
APPLICATIONS APPROVED, NOT ACCEPTED
0
$0
5
$27,200
6
$37,000
4
$16,000
0
$0
1
$12,000
APPLICATIONS DENIED
2
$28,500
9
$36,444
62
$46,177
30
$17,867
0
$0
2
$36,000
APPLICATIONS WITHDRAWN
0
$0
3
$37,667
28
$49,536
4
$41,250
0
$0
0
$0
FILES CLOSED FOR INCOMPLETENESS
0
$0
2
$22,500
7
$59,857
0
$0
0
$0
3
$28,333
Aggregated Statistics For Year 2003 (Based on 1 full tract)
A) FHA, FSA/RHS & VA Home Purchase Loans
B) Conventional Home Purchase Loans
C) Refinancings
D) Home Improvement Loans
F) Non-occupant Loans on < 5 Family Dwellings (A B C & D)
Number
Average Value
Number
Average Value
Number
Average Value
Number
Average Value
Number
Average Value
LOANS ORIGINATED
1
$30,000
28
$41,357
83
$36,145
21
$13,190
17
$31,882
APPLICATIONS APPROVED, NOT ACCEPTED
0
$0
5
$41,800
18
$41,444
2
$29,500
3
$54,667
APPLICATIONS DENIED
0
$0
3
$22,667
54
$43,556
23
$15,739
3
$18,333
APPLICATIONS WITHDRAWN
0
$0
4
$40,000
39
$46,949
1
$10,000
2
$38,500
FILES CLOSED FOR INCOMPLETENESS
0
$0
2
$32,500
2
$47,000
3
$26,333
1
$35,000
Aggregated Statistics For Year 2002 (Based on 1 full tract)
A) FHA, FSA/RHS & VA Home Purchase Loans
B) Conventional Home Purchase Loans
C) Refinancings
D) Home Improvement Loans
F) Non-occupant Loans on < 5 Family Dwellings (A B C & D)
Number
Average Value
Number
Average Value
Number
Average Value
Number
Average Value
Number
Average Value
LOANS ORIGINATED
3
$50,667
25
$42,320
50
$36,100
21
$15,762
11
$23,818
APPLICATIONS APPROVED, NOT ACCEPTED
0
$0
4
$16,750
17
$34,353
4
$44,750
1
$30,000
APPLICATIONS DENIED
1
$35,000
9
$28,778
50
$44,300
10
$21,100
5
$32,400
APPLICATIONS WITHDRAWN
0
$0
2
$27,000
39
$40,385
1
$2,000
1
$56,000
FILES CLOSED FOR INCOMPLETENESS
0
$0
2
$22,000
4
$50,500
0
$0
0
$0
Aggregated Statistics For Year 2001 (Based on 1 full tract)
A) FHA, FSA/RHS & VA Home Purchase Loans
B) Conventional Home Purchase Loans
C) Refinancings
D) Home Improvement Loans
E) Loans on Dwellings For 5+ Families
F) Non-occupant Loans on < 5 Family Dwellings (A B C & D)
Number
Average Value
Number
Average Value
Number
Average Value
Number
Average Value
Number
Average Value
Number
Average Value
LOANS ORIGINATED
4
$32,250
29
$32,379
37
$37,108
26
$14,769
0
$0
12
$25,667
APPLICATIONS APPROVED, NOT ACCEPTED
1
$20,000
3
$29,333
10
$36,800
3
$21,667
1
$89,000
1
$20,000
APPLICATIONS DENIED
1
$79,000
11
$34,273
58
$34,000
28
$16,857
0
$0
6
$35,833
APPLICATIONS WITHDRAWN
1
$40,000
4
$33,250
21
$41,667
1
$8,000
0
$0
1
$14,000
FILES CLOSED FOR INCOMPLETENESS
0
$0
0
$0
1
$5,000
0
$0
0
$0
0
$0
Aggregated Statistics For Year 2000 (Based on 1 full tract)
A) FHA, FSA/RHS & VA Home Purchase Loans
B) Conventional Home Purchase Loans
C) Refinancings
D) Home Improvement Loans
F) Non-occupant Loans on < 5 Family Dwellings (A B C & D)
Number
Average Value
Number
Average Value
Number
Average Value
Number
Average Value
Number
Average Value
LOANS ORIGINATED
9
$37,333
20
$27,650
20
$33,550
20
$16,550
10
$21,700
APPLICATIONS APPROVED, NOT ACCEPTED
0
$0
4
$33,000
17
$39,882
2
$22,000
3
$20,000
APPLICATIONS DENIED
1
$38,000
19
$28,368
55
$35,200
17
$8,412
3
$17,667
APPLICATIONS WITHDRAWN
1
$27,000
7
$50,143
22
$36,409
2
$22,000
4
$34,250
FILES CLOSED FOR INCOMPLETENESS
0
$0
2
$22,500
6
$41,000
0
$0
1
$21,000
Aggregated Statistics For Year 1999 (Based on 1 full tract)
A) FHA, FSA/RHS & VA Home Purchase Loans
B) Conventional Home Purchase Loans
C) Refinancings
D) Home Improvement Loans
F) Non-occupant Loans on < 5 Family Dwellings (A B C & D)
Detailed PMIC statistics for the following Tracts:0204.00
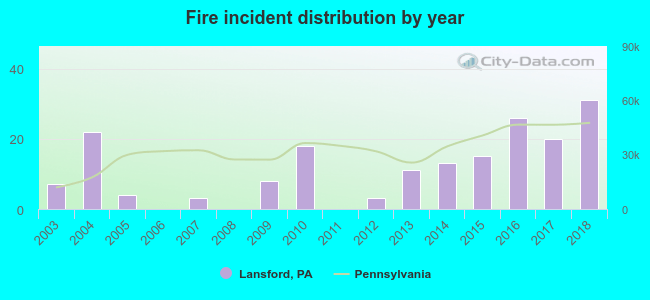
2003 - 2018 National Fire Incident Reporting System (NFIRS) incidents
According to the data from the years 2003 - 2018 the average number of fires per year is 11. The highest number of fire incidents - 31 took place in 2018, and the least - 0 in 2006. The data has a growing trend.
When looking into fire subcategories, the most incidents belonged to: Structure Fires (71.8%), and Outside Fires (11.0%).
Fire incident types reported to NFIRS in Lansford, PA


 Recent articles from our blog. Our writers, many of them Ph.D. graduates or candidates, create easy-to-read articles on a wide variety of topics.

 (26.6 miles


 According to the data from the years 2003 - 2018 the average number of fires per year is 11. The highest number of fire incidents - 31 took place in 2018, and the least - 0 in 2006. The data has a growing trend.
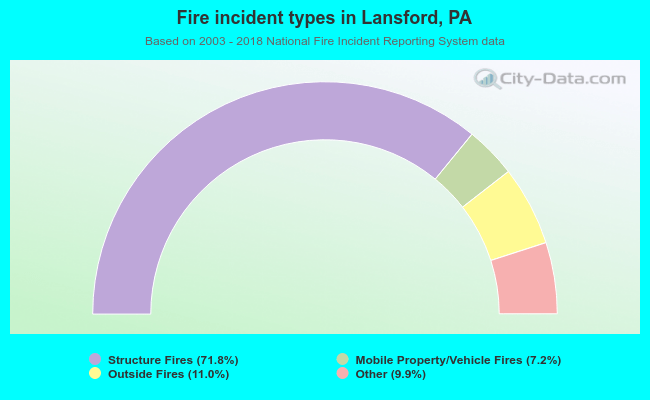 When looking into fire subcategories, the most incidents belonged to: Structure Fires (71.8%), and Outside Fires (11.0%).