Jensen Beach, Florida Submit your own pictures of this place and show them to the world
OSM Map
General Map
Google Map
MSN Map
OSM Map
General Map
Google Map
MSN Map
OSM Map
General Map
Google Map
MSN Map
OSM Map
General Map
Google Map
MSN Map
Please wait while loading the map...
Population in 2010: 11,707. Population change since 2000: +5.5%Males: 5,700 Females: 6,007
March 2022 cost of living index in Jensen Beach: 91.8 (less than average, U.S. average is 100) Percentage of residents living in poverty in 2022: 17.1%for White Non-Hispanic residents , 40.8% for Black residents , 63.8% for Hispanic or Latino residents , 27.9% for other race residents , 6.1% for two or more races residents )
Profiles of local businesses
Business Search - 14 Million verified businesses
Data:
Median household income ($)
Median household income (% change since 2000)
Household income diversity
Ratio of average income to average house value (%)
Ratio of average income to average rent
Median household income ($) - White
Median household income ($) - Black or African American
Median household income ($) - Asian
Median household income ($) - Hispanic or Latino
Median household income ($) - American Indian and Alaska Native
Median household income ($) - Multirace
Median household income ($) - Other Race
Median household income for houses/condos with a mortgage ($)
Median household income for apartments without a mortgage ($)
Races - White alone (%)
Races - White alone (% change since 2000)
Races - Black alone (%)
Races - Black alone (% change since 2000)
Races - American Indian alone (%)
Races - American Indian alone (% change since 2000)
Races - Asian alone (%)
Races - Asian alone (% change since 2000)
Races - Hispanic (%)
Races - Hispanic (% change since 2000)
Races - Native Hawaiian and Other Pacific Islander alone (%)
Races - Native Hawaiian and Other Pacific Islander alone (% change since 2000)
Races - Two or more races (%)
Races - Two or more races (% change since 2000)
Races - Other race alone (%)
Races - Other race alone (% change since 2000)
Racial diversity
Unemployment (%)
Unemployment (% change since 2000)
Unemployment (%) - White
Unemployment (%) - Black or African American
Unemployment (%) - Asian
Unemployment (%) - Hispanic or Latino
Unemployment (%) - American Indian and Alaska Native
Unemployment (%) - Multirace
Unemployment (%) - Other Race
Population density (people per square mile)
Population - Males (%)
Population - Females (%)
Population - Males (%) - White
Population - Males (%) - Black or African American
Population - Males (%) - Asian
Population - Males (%) - Hispanic or Latino
Population - Males (%) - American Indian and Alaska Native
Population - Males (%) - Multirace
Population - Males (%) - Other Race
Population - Females (%) - White
Population - Females (%) - Black or African American
Population - Females (%) - Asian
Population - Females (%) - Hispanic or Latino
Population - Females (%) - American Indian and Alaska Native
Population - Females (%) - Multirace
Population - Females (%) - Other Race
Coronavirus confirmed cases (May 07, 2024)
Deaths caused by coronavirus (May 07, 2024)
Coronavirus confirmed cases (per 100k population) (May 07, 2024)
Deaths caused by coronavirus (per 100k population) (May 07, 2024)
Daily increase in number of cases (May 07, 2024)
Weekly increase in number of cases (May 07, 2024)
Cases doubled (in days) (May 07, 2024)
Hospitalized patients (Apr 18, 2022)
Negative test results (Apr 18, 2022)
Total test results (Apr 18, 2022)
COVID Vaccine doses distributed (per 100k population) (Sep 19, 2023)
COVID Vaccine doses administered (per 100k population) (Sep 19, 2023)
COVID Vaccine doses distributed (Sep 19, 2023)
COVID Vaccine doses administered (Sep 19, 2023)
Likely homosexual households (%)
Likely homosexual households (% change since 2000)
Likely homosexual households - Lesbian couples (%)
Likely homosexual households - Lesbian couples (% change since 2000)
Likely homosexual households - Gay men (%)
Likely homosexual households - Gay men (% change since 2000)
Cost of living index
Median gross rent ($)
Median contract rent ($)
Median monthly housing costs ($)
Median house or condo value ($)
Median house or condo value ($ change since 2000)
Mean house or condo value by units in structure - 1, detached ($)
Mean house or condo value by units in structure - 1, attached ($)
Mean house or condo value by units in structure - 2 ($)
Mean house or condo value by units in structure by units in structure - 3 or 4 ($)
Mean house or condo value by units in structure - 5 or more ($)
Mean house or condo value by units in structure - Boat, RV, van, etc. ($)
Mean house or condo value by units in structure - Mobile home ($)
Median house or condo value ($) - White
Median house or condo value ($) - Black or African American
Median house or condo value ($) - Asian
Median house or condo value ($) - Hispanic or Latino
Median house or condo value ($) - American Indian and Alaska Native
Median house or condo value ($) - Multirace
Median house or condo value ($) - Other Race
Median resident age
Resident age diversity
Median resident age - Males
Median resident age - Females
Median resident age - White
Median resident age - Black or African American
Median resident age - Asian
Median resident age - Hispanic or Latino
Median resident age - American Indian and Alaska Native
Median resident age - Multirace
Median resident age - Other Race
Median resident age - Males - White
Median resident age - Males - Black or African American
Median resident age - Males - Asian
Median resident age - Males - Hispanic or Latino
Median resident age - Males - American Indian and Alaska Native
Median resident age - Males - Multirace
Median resident age - Males - Other Race
Median resident age - Females - White
Median resident age - Females - Black or African American
Median resident age - Females - Asian
Median resident age - Females - Hispanic or Latino
Median resident age - Females - American Indian and Alaska Native
Median resident age - Females - Multirace
Median resident age - Females - Other Race
Commute - mean travel time to work (minutes)
Travel time to work - Less than 5 minutes (%)
Travel time to work - Less than 5 minutes (% change since 2000)
Travel time to work - 5 to 9 minutes (%)
Travel time to work - 5 to 9 minutes (% change since 2000)
Travel time to work - 10 to 19 minutes (%)
Travel time to work - 10 to 19 minutes (% change since 2000)
Travel time to work - 20 to 29 minutes (%)
Travel time to work - 20 to 29 minutes (% change since 2000)
Travel time to work - 30 to 39 minutes (%)
Travel time to work - 30 to 39 minutes (% change since 2000)
Travel time to work - 40 to 59 minutes (%)
Travel time to work - 40 to 59 minutes (% change since 2000)
Travel time to work - 60 to 89 minutes (%)
Travel time to work - 60 to 89 minutes (% change since 2000)
Travel time to work - 90 or more minutes (%)
Travel time to work - 90 or more minutes (% change since 2000)
Marital status - Never married (%)
Marital status - Now married (%)
Marital status - Separated (%)
Marital status - Widowed (%)
Marital status - Divorced (%)
Median family income ($)
Median family income (% change since 2000)
Median non-family income ($)
Median non-family income (% change since 2000)
Median per capita income ($)
Median per capita income (% change since 2000)
Median family income ($) - White
Median family income ($) - Black or African American
Median family income ($) - Asian
Median family income ($) - Hispanic or Latino
Median family income ($) - American Indian and Alaska Native
Median family income ($) - Multirace
Median family income ($) - Other Race
Median year house/condo built
Median year apartment built
Year house built - Built 2005 or later (%)
Year house built - Built 2000 to 2004 (%)
Year house built - Built 1990 to 1999 (%)
Year house built - Built 1980 to 1989 (%)
Year house built - Built 1970 to 1979 (%)
Year house built - Built 1960 to 1969 (%)
Year house built - Built 1950 to 1959 (%)
Year house built - Built 1940 to 1949 (%)
Year house built - Built 1939 or earlier (%)
Average household size
Household density (households per square mile)
Average household size - White
Average household size - Black or African American
Average household size - Asian
Average household size - Hispanic or Latino
Average household size - American Indian and Alaska Native
Average household size - Multirace
Average household size - Other Race
Occupied housing units (%)
Vacant housing units (%)
Owner occupied housing units (%)
Renter occupied housing units (%)
Vacancy status - For rent (%)
Vacancy status - For sale only (%)
Vacancy status - Rented or sold, not occupied (%)
Vacancy status - For seasonal, recreational, or occasional use (%)
Vacancy status - For migrant workers (%)
Vacancy status - Other vacant (%)
Residents with income below the poverty level (%)
Residents with income below 50% of the poverty level (%)
Children below poverty level (%)
Poor families by family type - Married-couple family (%)
Poor families by family type - Male, no wife present (%)
Poor families by family type - Female, no husband present (%)
Poverty status for native-born residents (%)
Poverty status for foreign-born residents (%)
Poverty among high school graduates not in families (%)
Poverty among people who did not graduate high school not in families (%)
Residents with income below the poverty level (%) - White
Residents with income below the poverty level (%) - Black or African American
Residents with income below the poverty level (%) - Asian
Residents with income below the poverty level (%) - Hispanic or Latino
Residents with income below the poverty level (%) - American Indian and Alaska Native
Residents with income below the poverty level (%) - Multirace
Residents with income below the poverty level (%) - Other Race
Air pollution - Air Quality Index (AQI)
Air pollution - CO
Air pollution - NO2
Air pollution - SO2
Air pollution - Ozone
Air pollution - PM10
Air pollution - PM25
Air pollution - Pb
Crime - Murders per 100,000 population
Crime - Rapes per 100,000 population
Crime - Robberies per 100,000 population
Crime - Assaults per 100,000 population
Crime - Burglaries per 100,000 population
Crime - Thefts per 100,000 population
Crime - Auto thefts per 100,000 population
Crime - Arson per 100,000 population
Crime - City-data.com crime index
Crime - Violent crime index
Crime - Property crime index
Crime - Murders per 100,000 population (5 year average)
Crime - Rapes per 100,000 population (5 year average)
Crime - Robberies per 100,000 population (5 year average)
Crime - Assaults per 100,000 population (5 year average)
Crime - Burglaries per 100,000 population (5 year average)
Crime - Thefts per 100,000 population (5 year average)
Crime - Auto thefts per 100,000 population (5 year average)
Crime - Arson per 100,000 population (5 year average)
Crime - City-data.com crime index (5 year average)
Crime - Violent crime index (5 year average)
Crime - Property crime index (5 year average)
1996 Presidential Elections Results (%) - Democratic Party (Clinton)
1996 Presidential Elections Results (%) - Republican Party (Dole)
1996 Presidential Elections Results (%) - Other
2000 Presidential Elections Results (%) - Democratic Party (Gore)
2000 Presidential Elections Results (%) - Republican Party (Bush)
2000 Presidential Elections Results (%) - Other
2004 Presidential Elections Results (%) - Democratic Party (Kerry)
2004 Presidential Elections Results (%) - Republican Party (Bush)
2004 Presidential Elections Results (%) - Other
2008 Presidential Elections Results (%) - Democratic Party (Obama)
2008 Presidential Elections Results (%) - Republican Party (McCain)
2008 Presidential Elections Results (%) - Other
2012 Presidential Elections Results (%) - Democratic Party (Obama)
2012 Presidential Elections Results (%) - Republican Party (Romney)
2012 Presidential Elections Results (%) - Other
2016 Presidential Elections Results (%) - Democratic Party (Clinton)
2016 Presidential Elections Results (%) - Republican Party (Trump)
2016 Presidential Elections Results (%) - Other
2020 Presidential Elections Results (%) - Democratic Party (Biden)
2020 Presidential Elections Results (%) - Republican Party (Trump)
2020 Presidential Elections Results (%) - Other
Ancestries Reported - Arab (%)
Ancestries Reported - Czech (%)
Ancestries Reported - Danish (%)
Ancestries Reported - Dutch (%)
Ancestries Reported - English (%)
Ancestries Reported - French (%)
Ancestries Reported - French Canadian (%)
Ancestries Reported - German (%)
Ancestries Reported - Greek (%)
Ancestries Reported - Hungarian (%)
Ancestries Reported - Irish (%)
Ancestries Reported - Italian (%)
Ancestries Reported - Lithuanian (%)
Ancestries Reported - Norwegian (%)
Ancestries Reported - Polish (%)
Ancestries Reported - Portuguese (%)
Ancestries Reported - Russian (%)
Ancestries Reported - Scotch-Irish (%)
Ancestries Reported - Scottish (%)
Ancestries Reported - Slovak (%)
Ancestries Reported - Subsaharan African (%)
Ancestries Reported - Swedish (%)
Ancestries Reported - Swiss (%)
Ancestries Reported - Ukrainian (%)
Ancestries Reported - United States (%)
Ancestries Reported - Welsh (%)
Ancestries Reported - West Indian (%)
Ancestries Reported - Other (%)
Educational Attainment - No schooling completed (%)
Educational Attainment - Less than high school (%)
Educational Attainment - High school or equivalent (%)
Educational Attainment - Less than 1 year of college (%)
Educational Attainment - 1 or more years of college (%)
Educational Attainment - Associate degree (%)
Educational Attainment - Bachelor's degree (%)
Educational Attainment - Master's degree (%)
Educational Attainment - Professional school degree (%)
Educational Attainment - Doctorate degree (%)
School Enrollment - Nursery, preschool (%)
School Enrollment - Kindergarten (%)
School Enrollment - Grade 1 to 4 (%)
School Enrollment - Grade 5 to 8 (%)
School Enrollment - Grade 9 to 12 (%)
School Enrollment - College undergrad (%)
School Enrollment - Graduate or professional (%)
School Enrollment - Not enrolled in school (%)
School enrollment - Public schools (%)
School enrollment - Private schools (%)
School enrollment - Not enrolled (%)
Median number of rooms in houses and condos
Median number of rooms in apartments
Housing units lacking complete plumbing facilities (%)
Housing units lacking complete kitchen facilities (%)
Density of houses
Urban houses (%)
Rural houses (%)
Households with people 60 years and over (%)
Households with people 65 years and over (%)
Households with people 75 years and over (%)
Households with one or more nonrelatives (%)
Households with no nonrelatives (%)
Population in households (%)
Family households (%)
Nonfamily households (%)
Population in families (%)
Family households with own children (%)
Median number of bedrooms in owner occupied houses
Mean number of bedrooms in owner occupied houses
Median number of bedrooms in renter occupied houses
Mean number of bedrooms in renter occupied houses
Median number of vehichles in owner occupied houses
Mean number of vehichles in owner occupied houses
Median number of vehichles in renter occupied houses
Mean number of vehichles in renter occupied houses
Mortgage status - with mortgage (%)
Mortgage status - with second mortgage (%)
Mortgage status - with home equity loan (%)
Mortgage status - with both second mortgage and home equity loan (%)
Mortgage status - without a mortgage (%)
Average family size
Average family size - White
Average family size - Black or African American
Average family size - Asian
Average family size - Hispanic or Latino
Average family size - American Indian and Alaska Native
Average family size - Multirace
Average family size - Other Race
Geographical mobility - Same house 1 year ago (%)
Geographical mobility - Moved within same county (%)
Geographical mobility - Moved from different county within same state (%)
Geographical mobility - Moved from different state (%)
Geographical mobility - Moved from abroad (%)
Place of birth - Born in state of residence (%)
Place of birth - Born in other state (%)
Place of birth - Native, outside of US (%)
Place of birth - Foreign born (%)
Housing units in structures - 1, detached (%)
Housing units in structures - 1, attached (%)
Housing units in structures - 2 (%)
Housing units in structures - 3 or 4 (%)
Housing units in structures - 5 to 9 (%)
Housing units in structures - 10 to 19 (%)
Housing units in structures - 20 to 49 (%)
Housing units in structures - 50 or more (%)
Housing units in structures - Mobile home (%)
Housing units in structures - Boat, RV, van, etc. (%)
House/condo owner moved in on average (years ago)
Renter moved in on average (years ago)
Year householder moved into unit - Moved in 1999 to March 2000 (%)
Year householder moved into unit - Moved in 1995 to 1998 (%)
Year householder moved into unit - Moved in 1990 to 1994 (%)
Year householder moved into unit - Moved in 1980 to 1989 (%)
Year householder moved into unit - Moved in 1970 to 1979 (%)
Year householder moved into unit - Moved in 1969 or earlier (%)
Means of transportation to work - Drove car alone (%)
Means of transportation to work - Carpooled (%)
Means of transportation to work - Public transportation (%)
Means of transportation to work - Bus or trolley bus (%)
Means of transportation to work - Streetcar or trolley car (%)
Means of transportation to work - Subway or elevated (%)
Means of transportation to work - Railroad (%)
Means of transportation to work - Ferryboat (%)
Means of transportation to work - Taxicab (%)
Means of transportation to work - Motorcycle (%)
Means of transportation to work - Bicycle (%)
Means of transportation to work - Walked (%)
Means of transportation to work - Other means (%)
Working at home (%)
Industry diversity
Most Common Industries - Agriculture, forestry, fishing and hunting, and mining (%)
Most Common Industries - Agriculture, forestry, fishing and hunting (%)
Most Common Industries - Mining, quarrying, and oil and gas extraction (%)
Most Common Industries - Construction (%)
Most Common Industries - Manufacturing (%)
Most Common Industries - Wholesale trade (%)
Most Common Industries - Retail trade (%)
Most Common Industries - Transportation and warehousing, and utilities (%)
Most Common Industries - Transportation and warehousing (%)
Most Common Industries - Utilities (%)
Most Common Industries - Information (%)
Most Common Industries - Finance and insurance, and real estate and rental and leasing (%)
Most Common Industries - Finance and insurance (%)
Most Common Industries - Real estate and rental and leasing (%)
Most Common Industries - Professional, scientific, and management, and administrative and waste management services (%)
Most Common Industries - Professional, scientific, and technical services (%)
Most Common Industries - Management of companies and enterprises (%)
Most Common Industries - Administrative and support and waste management services (%)
Most Common Industries - Educational services, and health care and social assistance (%)
Most Common Industries - Educational services (%)
Most Common Industries - Health care and social assistance (%)
Most Common Industries - Arts, entertainment, and recreation, and accommodation and food services (%)
Most Common Industries - Arts, entertainment, and recreation (%)
Most Common Industries - Accommodation and food services (%)
Most Common Industries - Other services, except public administration (%)
Most Common Industries - Public administration (%)
Occupation diversity
Most Common Occupations - Management, business, science, and arts occupations (%)
Most Common Occupations - Management, business, and financial occupations (%)
Most Common Occupations - Management occupations (%)
Most Common Occupations - Business and financial operations occupations (%)
Most Common Occupations - Computer, engineering, and science occupations (%)
Most Common Occupations - Computer and mathematical occupations (%)
Most Common Occupations - Architecture and engineering occupations (%)
Most Common Occupations - Life, physical, and social science occupations (%)
Most Common Occupations - Education, legal, community service, arts, and media occupations (%)
Most Common Occupations - Community and social service occupations (%)
Most Common Occupations - Legal occupations (%)
Most Common Occupations - Education, training, and library occupations (%)
Most Common Occupations - Arts, design, entertainment, sports, and media occupations (%)
Most Common Occupations - Healthcare practitioners and technical occupations (%)
Most Common Occupations - Health diagnosing and treating practitioners and other technical occupations (%)
Most Common Occupations - Health technologists and technicians (%)
Most Common Occupations - Service occupations (%)
Most Common Occupations - Healthcare support occupations (%)
Most Common Occupations - Protective service occupations (%)
Most Common Occupations - Fire fighting and prevention, and other protective service workers including supervisors (%)
Most Common Occupations - Law enforcement workers including supervisors (%)
Most Common Occupations - Food preparation and serving related occupations (%)
Most Common Occupations - Building and grounds cleaning and maintenance occupations (%)
Most Common Occupations - Personal care and service occupations (%)
Most Common Occupations - Sales and office occupations (%)
Most Common Occupations - Sales and related occupations (%)
Most Common Occupations - Office and administrative support occupations (%)
Most Common Occupations - Natural resources, construction, and maintenance occupations (%)
Most Common Occupations - Farming, fishing, and forestry occupations (%)
Most Common Occupations - Construction and extraction occupations (%)
Most Common Occupations - Installation, maintenance, and repair occupations (%)
Most Common Occupations - Production, transportation, and material moving occupations (%)
Most Common Occupations - Production occupations (%)
Most Common Occupations - Transportation occupations (%)
Most Common Occupations - Material moving occupations (%)
People in Group quarters - Institutionalized population (%)
People in Group quarters - Correctional institutions (%)
People in Group quarters - Federal prisons and detention centers (%)
People in Group quarters - Halfway houses (%)
People in Group quarters - Local jails and other confinement facilities (including police lockups) (%)
People in Group quarters - Military disciplinary barracks (%)
People in Group quarters - State prisons (%)
People in Group quarters - Other types of correctional institutions (%)
People in Group quarters - Nursing homes (%)
People in Group quarters - Hospitals/wards, hospices, and schools for the handicapped (%)
People in Group quarters - Hospitals/wards and hospices for chronically ill (%)
People in Group quarters - Hospices or homes for chronically ill (%)
People in Group quarters - Military hospitals or wards for chronically ill (%)
People in Group quarters - Other hospitals or wards for chronically ill (%)
People in Group quarters - Hospitals or wards for drug/alcohol abuse (%)
People in Group quarters - Mental (Psychiatric) hospitals or wards (%)
People in Group quarters - Schools, hospitals, or wards for the mentally retarded (%)
People in Group quarters - Schools, hospitals, or wards for the physically handicapped (%)
People in Group quarters - Institutions for the deaf (%)
People in Group quarters - Institutions for the blind (%)
People in Group quarters - Orthopedic wards and institutions for the physically handicapped (%)
People in Group quarters - Wards in general hospitals for patients who have no usual home elsewhere (%)
People in Group quarters - Wards in military hospitals for patients who have no usual home elsewhere (%)
People in Group quarters - Juvenile institutions (%)
People in Group quarters - Long-term care (%)
People in Group quarters - Homes for abused, dependent, and neglected children (%)
People in Group quarters - Residential treatment centers for emotionally disturbed children (%)
People in Group quarters - Training schools for juvenile delinquents (%)
People in Group quarters - Short-term care, detention or diagnostic centers for delinquent children (%)
People in Group quarters - Type of juvenile institution unknown (%)
People in Group quarters - Noninstitutionalized population (%)
People in Group quarters - College dormitories (includes college quarters off campus) (%)
People in Group quarters - Military quarters (%)
People in Group quarters - On base (%)
People in Group quarters - Barracks, unaccompanied personnel housing (UPH), (Enlisted/Officer), ;and similar group living quarters for military personnel (%)
People in Group quarters - Transient quarters for temporary residents (%)
People in Group quarters - Military ships (%)
People in Group quarters - Group homes (%)
People in Group quarters - Homes or halfway houses for drug/alcohol abuse (%)
People in Group quarters - Homes for the mentally ill (%)
People in Group quarters - Homes for the mentally retarded (%)
People in Group quarters - Homes for the physically handicapped (%)
People in Group quarters - Other group homes (%)
People in Group quarters - Religious group quarters (%)
People in Group quarters - Dormitories (%)
People in Group quarters - Agriculture workers' dormitories on farms (%)
People in Group quarters - Job Corps and vocational training facilities (%)
People in Group quarters - Other workers' dormitories (%)
People in Group quarters - Crews of maritime vessels (%)
People in Group quarters - Other nonhousehold living situations (%)
People in Group quarters - Other noninstitutional group quarters (%)
Residents speaking English at home (%)
Residents speaking English at home - Born in the United States (%)
Residents speaking English at home - Native, born elsewhere (%)
Residents speaking English at home - Foreign born (%)
Residents speaking Spanish at home (%)
Residents speaking Spanish at home - Born in the United States (%)
Residents speaking Spanish at home - Native, born elsewhere (%)
Residents speaking Spanish at home - Foreign born (%)
Residents speaking other language at home (%)
Residents speaking other language at home - Born in the United States (%)
Residents speaking other language at home - Native, born elsewhere (%)
Residents speaking other language at home - Foreign born (%)
Class of Workers - Employee of private company (%)
Class of Workers - Self-employed in own incorporated business (%)
Class of Workers - Private not-for-profit wage and salary workers (%)
Class of Workers - Local government workers (%)
Class of Workers - State government workers (%)
Class of Workers - Federal government workers (%)
Class of Workers - Self-employed workers in own not incorporated business and Unpaid family workers (%)
House heating fuel used in houses and condos - Utility gas (%)
House heating fuel used in houses and condos - Bottled, tank, or LP gas (%)
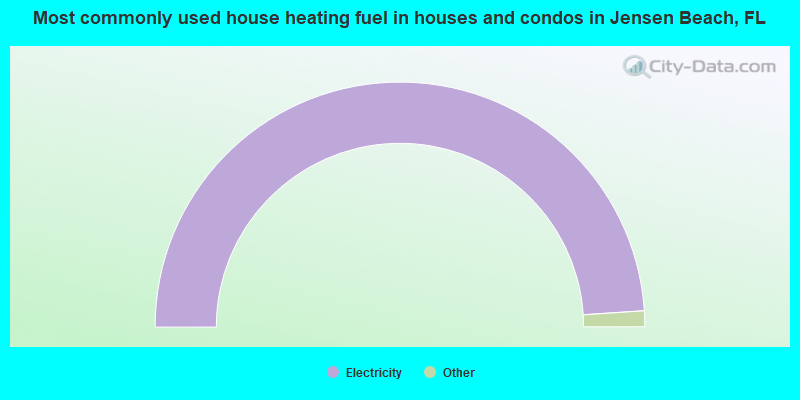
House heating fuel used in houses and condos - Electricity (%)
House heating fuel used in houses and condos - Fuel oil, kerosene, etc. (%)
House heating fuel used in houses and condos - Coal or coke (%)
House heating fuel used in houses and condos - Wood (%)
House heating fuel used in houses and condos - Solar energy (%)
House heating fuel used in houses and condos - Other fuel (%)
House heating fuel used in houses and condos - No fuel used (%)
House heating fuel used in apartments - Utility gas (%)
House heating fuel used in apartments - Bottled, tank, or LP gas (%)
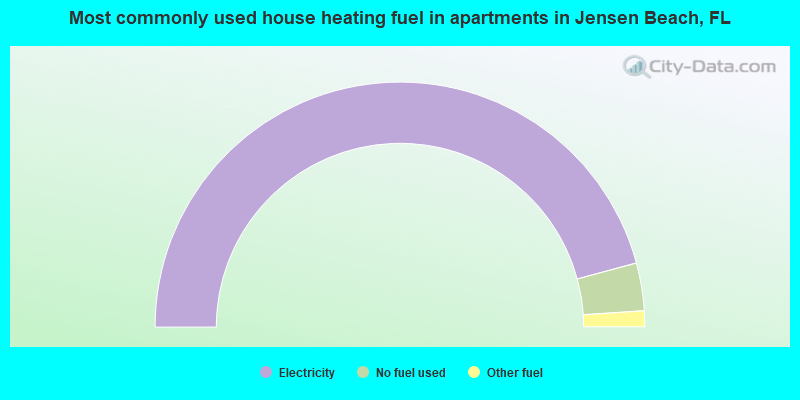
House heating fuel used in apartments - Electricity (%)
House heating fuel used in apartments - Fuel oil, kerosene, etc. (%)
House heating fuel used in apartments - Coal or coke (%)
House heating fuel used in apartments - Wood (%)
House heating fuel used in apartments - Solar energy (%)
House heating fuel used in apartments - Other fuel (%)
House heating fuel used in apartments - No fuel used (%)
Armed forces status - In Armed Forces (%)
Armed forces status - Civilian (%)
Armed forces status - Civilian - Veteran (%)
Armed forces status - Civilian - Nonveteran (%)
Fatal accidents locations in years 2005-2021
Fatal accidents locations in 2005
Fatal accidents locations in 2006
Fatal accidents locations in 2007
Fatal accidents locations in 2008
Fatal accidents locations in 2009
Fatal accidents locations in 2010
Fatal accidents locations in 2011
Fatal accidents locations in 2012
Fatal accidents locations in 2013
Fatal accidents locations in 2014
Fatal accidents locations in 2015
Fatal accidents locations in 2016
Fatal accidents locations in 2017
Fatal accidents locations in 2018
Fatal accidents locations in 2019
Fatal accidents locations in 2020
Fatal accidents locations in 2021
Alcohol use - People drinking some alcohol every month (%)
Alcohol use - People not drinking at all (%)
Alcohol use - Average days/month drinking alcohol
Alcohol use - Average drinks/week
Alcohol use - Average days/year people drink much
Audiometry - Average condition of hearing (%)
Audiometry - People that can hear a whisper from across a quiet room (%)
Audiometry - People that can hear normal voice from across a quiet room (%)
Audiometry - Ears ringing, roaring, buzzing (%)
Audiometry - Had a job exposure to loud noise (%)
Audiometry - Had off-work exposure to loud noise (%)
Blood Pressure & Cholesterol - Has high blood pressure (%)
Blood Pressure & Cholesterol - Checking blood pressure at home (%)
Blood Pressure & Cholesterol - Frequently checking blood cholesterol (%)
Blood Pressure & Cholesterol - Has high cholesterol level (%)
Consumer Behavior - Money monthly spent on food at supermarket/grocery store
Consumer Behavior - Money monthly spent on food at other stores
Consumer Behavior - Money monthly spent on eating out
Consumer Behavior - Money monthly spent on carryout/delivered foods
Consumer Behavior - Income spent on food at supermarket/grocery store (%)
Consumer Behavior - Income spent on food at other stores (%)
Consumer Behavior - Income spent on eating out (%)
Consumer Behavior - Income spent on carryout/delivered foods (%)
Current Health Status - General health condition (%)
Current Health Status - Blood donors (%)
Current Health Status - Has blood ever tested for HIV virus (%)
Current Health Status - Left-handed people (%)
Dermatology - People using sunscreen (%)
Diabetes - Diabetics (%)
Diabetes - Had a blood test for high blood sugar (%)
Diabetes - People taking insulin (%)
Diet Behavior & Nutrition - Diet health (%)
Diet Behavior & Nutrition - Milk product consumption (# of products/month)
Diet Behavior & Nutrition - Meals not home prepared (#/week)
Diet Behavior & Nutrition - Meals from fast food or pizza place (#/week)
Diet Behavior & Nutrition - Ready-to-eat foods (#/month)
Diet Behavior & Nutrition - Frozen meals/pizza (#/month)
Drug Use - People that ever used marijuana or hashish (%)
Drug Use - Ever used hard drugs (%)
Drug Use - Ever used any form of cocaine (%)
Drug Use - Ever used heroin (%)
Drug Use - Ever used methamphetamine (%)
Health Insurance - People covered by health insurance (%)
Kidney Conditions-Urology - Avg. # of times urinating at night
Medical Conditions - People with asthma (%)
Medical Conditions - People with anemia (%)
Medical Conditions - People with psoriasis (%)
Medical Conditions - People with overweight (%)
Medical Conditions - Elderly people having difficulties in thinking or remembering (%)
Medical Conditions - People who ever received blood transfusion (%)
Medical Conditions - People having trouble seeing even with glass/contacts (%)
Medical Conditions - People with arthritis (%)
Medical Conditions - People with gout (%)
Medical Conditions - People with congestive heart failure (%)
Medical Conditions - People with coronary heart disease (%)
Medical Conditions - People with angina pectoris (%)
Medical Conditions - People who ever had heart attack (%)
Medical Conditions - People who ever had stroke (%)
Medical Conditions - People with emphysema (%)
Medical Conditions - People with thyroid problem (%)
Medical Conditions - People with chronic bronchitis (%)
Medical Conditions - People with any liver condition (%)
Medical Conditions - People who ever had cancer or malignancy (%)
Mental Health - People who have little interest in doing things (%)
Mental Health - People feeling down, depressed, or hopeless (%)
Mental Health - People who have trouble sleeping or sleeping too much (%)
Mental Health - People feeling tired or having little energy (%)
Mental Health - People with poor appetite or overeating (%)
Mental Health - People feeling bad about themself (%)
Mental Health - People who have trouble concentrating on things (%)
Mental Health - People moving or speaking slowly or too fast (%)
Mental Health - People having thoughts they would be better off dead (%)
Oral Health - Average years since last visit a dentist
Oral Health - People embarrassed because of mouth (%)
Oral Health - People with gum disease (%)
Oral Health - General health of teeth and gums (%)
Oral Health - Average days a week using dental floss/device
Oral Health - Average days a week using mouthwash for dental problem
Oral Health - Average number of teeth
Pesticide Use - Households using pesticides to control insects (%)
Pesticide Use - Households using pesticides to kill weeds (%)
Physical Activity - People doing vigorous-intensity work activities (%)
Physical Activity - People doing moderate-intensity work activities (%)
Physical Activity - People walking or bicycling (%)
Physical Activity - People doing vigorous-intensity recreational activities (%)
Physical Activity - People doing moderate-intensity recreational activities (%)
Physical Activity - Average hours a day doing sedentary activities
Physical Activity - Average hours a day watching TV or videos
Physical Activity - Average hours a day using computer
Physical Functioning - People having limitations keeping them from working (%)
Physical Functioning - People limited in amount of work they can do (%)
Physical Functioning - People that need special equipment to walk (%)
Physical Functioning - People experiencing confusion/memory problems (%)
Physical Functioning - People requiring special healthcare equipment (%)
Prescription Medications - Average number of prescription medicines taking
Preventive Aspirin Use - Adults 40+ taking low-dose aspirin (%)
Reproductive Health - Vaginal deliveries (%)
Reproductive Health - Cesarean deliveries (%)
Reproductive Health - Deliveries resulted in a live birth (%)
Reproductive Health - Pregnancies resulted in a delivery (%)
Reproductive Health - Women breastfeeding newborns (%)
Reproductive Health - Women that had a hysterectomy (%)
Reproductive Health - Women that had both ovaries removed (%)
Reproductive Health - Women that have ever taken birth control pills (%)
Reproductive Health - Women taking birth control pills (%)
Reproductive Health - Women that have ever used Depo-Provera or injectables (%)
Reproductive Health - Women that have ever used female hormones (%)
Sexual Behavior - People 18+ that ever had sex (vaginal, anal, or oral) (%)
Sexual Behavior - Males 18+ that ever had vaginal sex with a woman (%)
Sexual Behavior - Males 18+ that ever performed oral sex on a woman (%)
Sexual Behavior - Males 18+ that ever had anal sex with a woman (%)
Sexual Behavior - Males 18+ that ever had any sex with a man (%)
Sexual Behavior - Females 18+ that ever had vaginal sex with a man (%)
Sexual Behavior - Females 18+ that ever performed oral sex on a man (%)
Sexual Behavior - Females 18+ that ever had anal sex with a man (%)
Sexual Behavior - Females 18+ that ever had any kind of sex with a woman (%)
Sexual Behavior - Average age people first had sex
Sexual Behavior - Average number of female sex partners in lifetime (males 18+)
Sexual Behavior - Average number of female vaginal sex partners in lifetime (males 18+)
Sexual Behavior - Average age people first performed oral sex on a woman (18+)
Sexual Behavior - Average number of woman performed oral sex on in lifetime (18+)
Sexual Behavior - Average number of male sex partners in lifetime (males 18+)
Sexual Behavior - Average number of male anal sex partners in lifetime (males 18+)
Sexual Behavior - Average age people first performed oral sex on a man (18+)
Sexual Behavior - Average number of male oral sex partners in lifetime (18+)
Sexual Behavior - People using protection when performing oral sex (%)
Sexual Behavior - Average number of times people have vaginal or anal sex a year
Sexual Behavior - People having sex without condom (%)
Sexual Behavior - Average number of male sex partners in lifetime (females 18+)
Sexual Behavior - Average number of male vaginal sex partners in lifetime (females 18+)
Sexual Behavior - Average number of female sex partners in lifetime (females 18+)
Sexual Behavior - Circumcised males 18+ (%)
Sleep Disorders - Average hours sleeping at night
Sleep Disorders - People that has trouble sleeping (%)
Smoking-Cigarette Use - People smoking cigarettes (%)
Taste & Smell - People 40+ having problems with smell (%)
Taste & Smell - People 40+ having problems with taste (%)
Taste & Smell - People 40+ that ever had wisdom teeth removed (%)
Taste & Smell - People 40+ that ever had tonsils teeth removed (%)
Taste & Smell - People 40+ that ever had a loss of consciousness because of a head injury (%)
Taste & Smell - People 40+ that ever had a broken nose or other serious injury to face or skull (%)
Taste & Smell - People 40+ that ever had two or more sinus infections (%)
Weight - Average height (inches)
Weight - Average weight (pounds)
Weight - Average BMI
Weight - People that are obese (%)
Weight - People that ever were obese (%)
Weight - People trying to lose weight (%)
Latest news from Jensen Beach, FL collected exclusively by city-data.com from local newspapers, TV, and radio stations
Ancestries: Italian (18.4%), Irish (11.1%), English (10.8%), American (10.4%), German (8.8%), Polish (5.2%).
Current Local Time:
Land area: 7.25 square miles.
Population density: 1,616 people per square mile (low).
1,116 residents are foreign born (5.7% Latin America , 1.3% Europe ).
This place:
8.7%Florida:
21.1%
Median real estate property taxes paid for housing units with mortgages in 2022: $3,102 (0.7%)Median real estate property taxes paid for housing units with no mortgage in 2022: $3,125 (1.0%)
Nearest city with pop. 50,000+: Port St. Lucie, FL
Nearest city with pop. 200,000+: Hialeah, FL
Nearest city with pop. 1,000,000+: Philadelphia, PA
Nearest cities:
Latitude: 27.23 N, Longitude: 80.23 W
Daytime population change due to commuting: -604 (-4.7%)Workers who live and work in this place: 1,528 (27.1%)
Jensen Beach tourist attractions:
Unemployment in December 2023:
Most common occupations in Jensen Beach, FL (%)
Both Males Females
Other sales and related occupations, including supervisors (5.1%)
Other management occupations, except farmers and farm managers (5.1%)
Retail sales workers, except cashiers (4.6%)
Building and grounds cleaning and maintenance occupations (4.2%)
Carpenters (3.3%)
Preschool, kindergarten, elementary, and middle school teachers (3.3%)
Sales representatives, services, wholesale and manufacturing (3.1%)
Building and grounds cleaning and maintenance occupations (6.4%)
Other management occupations, except farmers and farm managers (6.2%)
Carpenters (6.2%)
Retail sales workers, except cashiers (5.3%)
Other sales and related occupations, including supervisors (4.5%)
Construction traders workers except carpenters, electricians, painters, plumbers, and construction laborers (3.6%)
Vehicle and mobile equipment mechanics, installers, and repairers (3.4%)
Preschool, kindergarten, elementary, and middle school teachers (6.3%)
Other sales and related occupations, including supervisors (5.9%)
Secretaries and administrative assistants (4.8%)
Registered nurses (4.7%)
Other office and administrative support workers, including supervisors (4.0%)
Other management occupations, except farmers and farm managers (3.9%)
Retail sales workers, except cashiers (3.8%)
Tornado activity:
Jensen Beach-area historical tornado activity is below Florida state average. It is 35% smaller than the overall U.S. average.
On 9/18/1954, a category F3 (max. wind speeds 158-206 mph) tornado 14.2 miles away from the Jensen Beach place center killed 2 people and injured 2 people and caused between $5000 and $50,000 in damages.
On 4/15/1958, a category F3 tornado 16.1 miles away from the place center injured 20 people and caused between $50,000 and $500,000 in damages.
Earthquake activity:
Jensen Beach-area historical earthquake activity is above Florida state average. It is 93% smaller than the overall U.S. average. On 9/10/2006 at 14:56:08, a magnitude 5.9 (5.9 MB, 5.5 MS, 5.8 MW, Class: Moderate, Intensity: VI - VII) earthquake occurred 401.0 miles away from the city center On 6/23/2016 at 17:20:29, a magnitude 3.8 (3.8 ML, Class: Light, Intensity: II - III) earthquake occurred 196.7 miles away from Jensen Beach center On 7/16/2016 at 20:00:10, a magnitude 3.7 (3.7 MB) earthquake occurred 181.6 miles away from the city center On 9/21/2016 at 16:30:52, a magnitude 3.8 (3.8 ML) earthquake occurred 201.3 miles away from Jensen Beach center On 9/4/2016 at 18:29:29, a magnitude 3.8 (3.8 ML) earthquake occurred 202.2 miles away from Jensen Beach center On 2/22/1992 at 04:21:34, a magnitude 3.2 (3.2 MB, Depth: 6.2 mi) earthquake occurred 102.8 miles away from Jensen Beach center Magnitude types: body-wave magnitude (MB), local magnitude (ML), surface-wave magnitude (MS), moment magnitude (MW) Natural disasters: The number of natural disasters in Martin County (28) is a lot greater than the US average (15).Major Disasters (Presidential) Declared: 14Emergencies Declared: 7Hurricanes: 17, Fires: 6, Tropical Storms: 3, Floods: 2, Freeze: 1, Storm: 1, Tornado: 1, Wind: 1, Other: 1 (Note: some incidents may be assigned to more than one category). Hospitals and medical centers in Jensen Beach: CONFICARE HOME HEALTH SOLUTIONS, LLC (630 NE JENSEN BEACH BLVD UNIT 630)
Other hospitals and medical centers near Jensen Beach: MARTIN MEDICAL CENTER (about 3 miles away; STUART, FL)
HOSPICE OF MARTIN AND SAINT LUCI (Hospital, about 3 miles away; STUART, FL)
TREASURE COAST KIDNEY CENTER NORTH (Dialysis Facility, about 3 miles away; STUART, FL)
VISITING NURSE ASSOCIATION OF FLORIDA INC (Home Health Center, about 3 miles away; STUART, FL)
ANCHOR HOME HEALTH SERVICES (Home Health Center, about 3 miles away; STUART, FL)
FLORIDA MENTOR (Hospital, about 4 miles away; STUART, FL)
STUART NURSING AND RESTORATIVE CARE CENTER (Nursing Home, about 4 miles away; STUART, FL)
Operable nuclear power plants near Jensen Beach:
10 miles: St. Lucie 1 and 2 in Hutchinson Island, FL.
Colleges/universities with over 2000 students nearest to Jensen Beach:
Indian River State College (about 16 miles; Fort Pierce, FL ; Full-time enrollment: 12,211)
Palm Beach Atlantic University (about 39 miles; West Palm Beach, FL ; FT enrollment: 2,868)
Palm Beach State College (about 44 miles; Lake Worth, FL ; FT enrollment: 19,938)
Lynn University (about 60 miles; Boca Raton, FL ; FT enrollment: 2,151)
Florida Atlantic University (about 61 miles; Boca Raton, FL ; FT enrollment: 24,403)
Florida Institute of Technology-Online (about 63 miles; Melbourne, FL ; FT enrollment: 3,046)
Florida Institute of Technology (about 63 miles; Melbourne, FL ; FT enrollment: 4,452)
Public high school in Jensen Beach:
Public elementary/middle school in Jensen Beach:
See full list of schools located in Jensen Beach
Notable locations in Jensen Beach: (A) , Jensen Beach Plaza (B) , The Savannahs Shopping Plaza (C) , Ocean Breeze Plaza (D) , Martin County Public Library System Hoke Branch Library (E) , Vince Bocchino Community Center (F) , Martin County Fire / Rescue Station 12 (G) , Martin County Fire Rescue Station 16 (H) . Display/hide their locations on the map
Churches in Jensen Beach include: (A) , Jensen Beach Church of God (B) , First Baptist Church of Jensen Beach (C) , Church of God (D) , All Saints Episcopal Church (E) . Display/hide their locations on the map
Cemetery: (1) . Display/hide its location on the map
Lake: (A) . Display/hide its location on the map
Creek: (A) . Display/hide its location on the map
Park in Jensen Beach: (1) . Display/hide its location on the map
Tourist attraction:
Hotels:
Birthplace of: Jennifer Sky - Actor.
Martin County has a predicted average indoor radon screening level less than 2 pCi/L (pico curies per liter) - Low Potential Drinking water stations with addresses in Jensen Beach and their reported violations in the past:
AQUARINA UTILITIES (Population served: 750, Groundwater):
Past health violations:
MCL, Average - Between APR-2006 and JUN-2006, Contaminant: TTHM. Follow-up actions: St Public Notif received (SEP-18-2006), St Compliance achieved (2 times from DEC-31-2006 to MAY-07-2007)
MCL, Average - Between JAN-2006 and MAR-2006, Contaminant: TTHM. Follow-up actions: St Public Notif received (MAY-24-2006), St Compliance achieved (2 times from DEC-31-2006 to MAY-07-2007)
MCL, Average - Between OCT-2005 and DEC-2005, Contaminant: TTHM. Follow-up actions: St Public Notif received (MAR-29-2006), St Compliance achieved (2 times from DEC-31-2006 to MAY-07-2007)
MCL, Average - Between JUL-2005 and SEP-2005, Contaminant: TTHM. Follow-up actions: St Public Notif received (MAR-29-2006), St Compliance achieved (2 times from DEC-31-2006 to MAY-07-2007)
MCL, Average - Between APR-2005 and JUN-2005, Contaminant: TTHM. Follow-up actions: St Violation/Reminder Notice (JUN-15-2005), St Public Notif received (MAR-29-2006), St Compliance achieved (2 times from DEC-31-2006 to MAY-07-2007)
Past monitoring violations:
Failure to Conduct Assessment Monitoring - In JUN-2012, Contaminant: E. COLI. Follow-up actions: St Public Notif requested (JUL-27-2012), St Violation/Reminder Notice (JUL-27-2012), St Compliance achieved (AUG-24-2012)
Monitoring and Reporting (DBP) - Between JUL-2006 and SEP-2006, Contaminant: Total Haloacetic Acids (HAA5). Follow-up actions: St Compliance achieved (JAN-31-2007), St Violation/Reminder Notice (APR-26-2007), St Compliance achieved (AUG-07-2007)
Monitoring and Reporting (DBP) - Between OCT-2005 and DEC-2005, Contaminant: TTHM. Follow-up actions: St Public Notif received (MAR-29-2006), St Compliance achieved (2 times from APR-10-2006 to DEC-31-2006)
Monitoring and Reporting (DBP) - Between JAN-2005 and MAR-2005, Contaminant: TTHM. Follow-up actions: St Public Notif received (MAR-29-2006), St Compliance achieved (DEC-31-2006)
Follow-up Or Routine LCR Tap M/R - In JUN-01-2003, Contaminant: Lead and Copper Rule. Follow-up actions: St Compliance achieved (MAY-06-2014)
One regular monitoring violation
Average household size: This place:
2.1 peopleFlorida:
2.5 people
Percentage of family households: This place:
57.9%Whole state:
65.2%
Percentage of households with unmarried partners: This place:
6.7%Whole state:
7.3%
Likely homosexual households (counted as self-reported same-sex unmarried-partner households)
Lesbian couples: 0.4% of all households Gay men: 0.3% of all households
People in group quarters in Jensen Beach in 2010:
106 people in other noninstitutional facilities
16 people in group homes intended for adults
10 people in group homes for juveniles (non-correctional)
people in other noninstitutional group quarters in 2000people in religious group quarters in 2000Banks with branches in Jensen Beach (2011 data):
Seacoast National Bank: Jensen Beach West Branch, Jensen Beach Branch, Hutchinson Island Branch. Info updated 2006/10/25: Bank assets: $2,135.8 mil, Deposits: $1,726.5 mil, headquarters in Stuart, FL, positive income , Commercial Lending Specialization, 42 total offices , Holding Company: Capgen Capital Group Iii Lp
Wells Fargo Bank, National Association: Jenson Beach Remote Branch, Jensen Beach Branch, Northside Jensen Beach Branch. Info updated 2011/04/05: Bank assets: $1,161,490.0 mil, Deposits: $905,653.0 mil, headquarters in Sioux Falls, SD, positive income , 6395 total offices , Holding Company: Wells Fargo & Company
PNC Bank, National Association: Downtown Jensen Branch at 1021 Northeast Jensen Beach Boulevard, branch established on 1981/09/14; Jensen Beach Branch at 3639 Northwest Federal Highway, branch established on 1999/05/17. Info updated 2012/03/20: Bank assets: $263,309.6 mil, Deposits: $197,343.0 mil, headquarters in Wilmington, DE, positive income , Commercial Lending Specialization, 3085 total offices , Holding Company: Pnc Financial Services Group, Inc., The
BankAtlantic: Jensen Beach Branch at 1170 N.E. Jensen Beach Boulevard, branch established on 1955/08/15. Info updated 2011/07/21: Bank assets: $3,648.1 mil, Deposits: $3,293.2 mil, headquarters in Fort Lauderdale, FL, negative income in the last year , Commercial Lending Specialization, 78 total offices
TD Bank, National Association: Jensen Beach Boulevard Branch at 50 Jensen Beach Boulevard, branch established on 1999/07/19. Info updated 2010/10/04: Bank assets: $188,912.6 mil, Deposits: $153,149.8 mil, headquarters in Wilmington, DE, positive income , 1314 total offices , Holding Company: Toronto-Dominion Bank, The
JPMorgan Chase Bank, National Association: Nw Federal Highway Branch at 2998 N.W. Federal Highway, branch established on 1992/02/10. Info updated 2011/11/10: Bank assets: $1,811,678.0 mil, Deposits: $1,190,738.0 mil, headquarters in Columbus, OH, positive income , International Specialization, 5577 total offices , Holding Company: Jpmorgan Chase & Co.
Bank of America, National Association: Jensen Beach Branch at 3321 N.W. Federal Highway, branch established on 1984/10/22. Info updated 2009/11/18: Bank assets: $1,451,969.3 mil, Deposits: $1,077,176.8 mil, headquarters in Charlotte, NC, positive income , 5782 total offices , Holding Company: Bank Of America Corporation
For population 15 years and over in Jensen Beach:
Never married: 29.1%Now married: 46.5%Separated: 0.7%Widowed: 10.0%Divorced: 13.6% For population 25 years and over in Jensen Beach:
High school or higher: 92.7%Bachelor's degree or higher: 36.8%Graduate or professional degree: 12.1%Unemployed: 5.2%Mean travel time to work (commute): 26.5 minutes
Education Gini index (Inequality in education) Here:
11.8Florida average:
12.2
Religion statistics for Jensen Beach, FL (based on Martin County data)
Religion Adherents Congregations Catholic 31,282 6 Evangelical Protestant 13,636 68 Mainline Protestant 11,467 19 Other 3,454 15 Black Protestant 1,198 8 Orthodox 200 1 None 85,081 -
Source: Clifford Grammich, Kirk Hadaway, Richard Houseal, Dale E.Jones, Alexei Krindatch, Richie Stanley and Richard H.Taylor. 2012. 2010 U.S.Religion Census: Religious Congregations & Membership Study. Association of Statisticians of American Religious Bodies. Jones, Dale E., et al. 2002. Congregations and Membership in the United States 2000. Nashville, TN: Glenmary Research Center. Graphs represent county-level data
Food Environment Statistics: Number of grocery stores : 28This county :
2.02 / 10,000 pop.Florida :
2.04 / 10,000 pop.
Number of supercenters and club stores : 1This county :
0.07 / 10,000 pop.State :
0.11 / 10,000 pop.
Number of convenience stores (no gas) : 17Here :
1.22 / 10,000 pop.State :
1.28 / 10,000 pop.
Number of convenience stores (with gas) : 48This county :
3.46 / 10,000 pop.Florida :
3.04 / 10,000 pop.
Number of full-service restaurants : 164Martin County :
11.82 / 10,000 pop.Florida :
7.45 / 10,000 pop.
Adult obesity rate : Martin County :
20.3%State :
23.7%
Low-income preschool obesity rate : Martin County :
16.5%Florida :
14.0%
Health and Nutrition: Healthy diet rate : Jensen Beach:
52.8%Florida:
51.4%
Average overall health of teeth and gums : Jensen Beach:
49.6%Florida:
49.4%
Average BMI : This city:
28.5Florida:
28.6
People feeling badly about themselves : Jensen Beach:
19.8%Florida:
19.5%
People not drinking alcohol at all : Jensen Beach:
10.3%Florida:
10.7%
Average hours sleeping at night : Jensen Beach:
6.9Florida:
6.9
General health condition : This city:
57.4%State:
57.0%
Average condition of hearing : Jensen Beach:
76.4%Florida:
79.2%
More about Health and Nutrition of Jensen Beach, FL Residents
Businesses in Jensen Beach, FL
Name Count Name Count
7-Eleven 1 La-Z-Boy 1 ALDO 1 LensCrafters 1 AT&T 1 Lowe's 1 Ace Hardware 1 Macy's 1 Aeropostale 1 Marriott 1 American Eagle Outfitters 1 MasterBrand Cabinets 9 Ann Taylor 1 McDonald's 1 Barnes & Noble 1 Men's Wearhouse 1 Baskin-Robbins 2 Motherhood Maternity 2 Bath & Body Works 1 New Balance 3 Brookstone 1 Nike 3 CVS 2 OfficeMax 1 Cache 1 Old Navy 1 Charlotte Russe 1 Olive Garden 1 Chick-Fil-A 1 Pac Sun 1 Cold Stone Creamery 1 Papa John's Pizza 1 Cracker Barrel 1 Payless 1 DHL 1 Pier 1 Imports 1 Dunkin Donuts 2 Publix Super Markets 2 Express 1 RadioShack 1 FedEx 6 Red Lobster 1 Finish Line 1 Rooms To Go 2 Firestone Complete Auto Care 1 Ruby Tuesday 1 Foot Locker 1 SONIC Drive-In 1 GNC 1 Sears 2 GameStop 1 Soma Intimates 1 Gap 1 Spencer Gifts 1 Gymboree 1 Sprint Nextel 1 H&R Block 1 Subway 3 Havertys Furniture 1 T-Mobile 2 Hobby Lobby 1 Taco Bell 1 Hollister Co. 1 Toys"R"Us 2 Home Depot 1 True Value 1 Hot Topic 1 UPS 2 JCPenney 1 Vans 2 Jones New York 2 Verizon Wireless 2 Journeys 1 Victoria's Secret 1 Justice 1 Walgreens 2 KFC 1 Wet Seal 1 Kohl's 1
Strongest AM radio stations in Jensen Beach:
WSTU (1450 AM; 1 kW; STUART, FL; Owner: TREASURE COAST BROADCASTERS, INC.)
WPSL (1590 AM; 5 kW; PORT ST. LUCIE, FL; Owner: PORT ST LUCIE BROADCASTERS, INC.)
WFTL (850 AM; 50 kW; WEST PALM BEACH, FL; Owner: JAMES CRYSTAL ENTERPRISES II, L.L.C.)
WJNA (640 AM; 38 kW; ROYAL PALM BEACH, FL; Owner: SOUTH FLORIDA RADIO, INC.)
WEFL (760 AM; 3 kW; TEQUESTA, FL; Owner: STAR OF THE PALM BEACHES, INC.)
WJNX (1330 AM; 5 kW; FORT PIERCE, FL; Owner: CLEAR CHANNEL BROADCASTING LICENSES, INC.)
WAQI (710 AM; 50 kW; MIAMI, FL; Owner: LICENSE CORPORATION #1)
WLVJ (1040 AM; 25 kW; BOYNTON BEACH, FL; Owner: JAMES CRYSTAL BOYNTON BEACH, INC.)
WWFE (670 AM; 50 kW; MIAMI, FL; Owner: FENIX BROADCASTING CORP.)
WJNO (1290 AM; 10 kW; WEST PALM BEACH, FL; Owner: CLEAR CHANNEL BROADCASTING LICENSES, INC.)
WRFX (940 AM; 50 kW; MIAMI, FL; Owner: CLEAR CHANNEL BROADCASTING LICENSES, INC.)
WWNN (1470 AM; 50 kW; POMPANO BEACH, FL; Owner: WWNN LICENSE, LLC)
WFLF (540 AM; 50 kW; PINE HILLS, FL; Owner: CLEAR CHANNEL BROADCASTING LICENSES, INC.)
Strongest FM radio stations in Jensen Beach:
WAVW (92.7 FM; STUART, FL; Owner: CAPSTAR TX LIMITED PARTNERSHIP)
WHLG (101.3 FM; PORT ST. LUCIE, FL; Owner: HORTON BROADCASTING COMPANY, INC.)
WWFR (91.7 FM; STUART, FL; Owner: FAMILY STATIONS, INC.)
WKGR (98.7 FM; FORT PIERCE, FL; Owner: CLEAR CHANNEL BROADCASTING LICENSES, INC.)
WLDI (95.5 FM; FORT PIERCE, FL; Owner: CLEAR CHANNEL BROADCASTING LICENSES, INC.)
W242AC (96.3 FM; PORT ST. LUCIE, FL; Owner: FRIENDS BROADCASTING, INC.)
WMBX (102.3 FM; JENSEN BEACH, FL; Owner: INFINITY RADIO OPERATIONS INC.)
WPBZ (103.1 FM; INDIANTOWN, FL; Owner: INFINITY RADIO OPERATIONS INC.)
WCNO (89.9 FM; PALM CITY, FL; Owner: NATIONAL CHRISTIAN NETWORK, INC.)
WRMF (97.9 FM; PALM BEACH, FL; Owner: PBB LICENSES, LLC)
WZZR (94.3 FM; RIVIERA BEACH, FL; Owner: CLEAR CHANNEL BROADCASTING LICENSES, INC.)
W244BD (96.7 FM; STUART, FL; Owner: SOUTHWEST FLORIDA COMMUNITY RADIO, INC.)
WQCS (88.9 FM; FORT PIERCE, FL; Owner: INDIAN RIVER COMMUNITY COLLEGE)
WIRK-FM (107.9 FM; WEST PALM BEACH, FL; Owner: INFINITY RADIO OPERATIONS INC.)
WAYF (88.1 FM; WEST PALM BEACH, FL; Owner: WAY-FM MEDIA GROUP. INC.)
WFLM (104.7 FM; WHITE CITY, FL; Owner: MIDWAY BROADCASTING COMPANY)
WOLL (105.5 FM; HOBE SOUND, FL; Owner: CLEAR CHANNEL BROADCASTING LICENSES, INC.)
W213AX (90.5 FM; FORT PIERCE, FL; Owner: PENSACOLA CHRISTIAN COLLEGE, INC.)
WEAT-FM (104.3 FM; WEST PALM BEACH, FL; Owner: INFINITY RADIO OPERATIONS INC.)
WCZR (101.7 FM; VERO BEACH, FL; Owner: CAPSTAR TX LIMITED PARTNERSHIP)
TV broadcast stations around Jensen Beach:
WTVX (Channel 34; FORT PIERCE, FL; Owner: C-34 FCC LICENSEE SUBSIDIARY, LLC)
WPBF (Channel 25; TEQUESTA, FL; Owner: WPBF-TV COMPANY)
WTCN-CA (Channel 43; PALM BEACH, FL; Owner: WILLIAM H. BROTHERS)
WTCE (Channel 21; FORT PIERCE, FL; Owner: JACKSONVILLE EDUCATORS B/CNG, INC.)
WFGC (Channel 61; PALM BEACH, FL; Owner: CHRISTIAN TELEVISION OF PALM BEACH COUNTY, INC.)
WPXP (Channel 67; LAKE WORTH, FL; Owner: PAXSON WEST PALM BEACH LICENSE, INC.)
WOCX-CA (Channel 5; SEBRING, ETC., FL; Owner: SEBRING TELEVISION CORPORATION)
WPTV (Channel 5; WEST PALM BEACH, FL; Owner: SCRIPPS HOWARD BROADCASTING COMPANY)
WFLX (Channel 29; WEST PALM BEACH, FL; Owner: RAYCOM NATIONAL, INC.)
WWHB-CA (Channel 15; STUART, FL; Owner: AMERICAN NETCOM, INC.)
WXEL-TV (Channel 42; WEST PALM BEACH, FL; Owner: BARRY TELECOMMUNICATIONS, INC.)
W53BS (Channel 53; JUPITER, FL; Owner: SPIRIT PRODUCTIONS, INC.)
WWCI-CA (Channel 10; VERO BEACH, FL; Owner: V-1 PRODUCTIONS, INC.)
W44AY (Channel 44; FORT PIERCE, FL; Owner: BARRY TELECOMMUNICATIONS, INC.)
WFPI-LP (Channel 8; FORT PIERCE, ETC, FL; Owner: TIGER EYE BROADCASTING CORPORATION)
National Bridge Inventory (NBI) Statistics 9 Number of bridges358ft / 109m Total length83,060 Total average daily traffic7,082 Total average daily truck traffic144,744 Total future (year 2042) average daily traffic
Home Mortgage Disclosure Act Aggregated Statistics For Year 2009(Based on 1 full and 2 partial tracts) A) FHA, FSA/RHS & VA B) Conventional C) Refinancings D) Home Improvement Loans F) Non-occupant Loans on G) Loans On Manufactured Number Average Value Number Average Value Number Average Value Number Average Value Number Average Value Number Average Value
LOANS ORIGINATED 29 $147,593 57 $212,008 94 $182,001 9 $90,011 34 $144,397 1 $7,170 APPLICATIONS APPROVED, NOT ACCEPTED 3 $113,790 10 $179,440 14 $166,334 1 $116,830 4 $199,810 0 $0 APPLICATIONS DENIED 7 $187,461 18 $167,114 72 $225,045 5 $16,442 21 $193,525 2 $22,665 APPLICATIONS WITHDRAWN 3 $215,647 10 $193,113 26 $225,470 0 $0 6 $195,852 1 $660,000 FILES CLOSED FOR INCOMPLETENESS 2 $132,665 3 $201,267 9 $227,912 0 $0 1 $40,000 0 $0
Aggregated Statistics For Year 2008(Based on 1 full and 2 partial tracts) A) FHA, FSA/RHS & VA B) Conventional C) Refinancings D) Home Improvement Loans F) Non-occupant Loans on G) Loans On Manufactured Number Average Value Number Average Value Number Average Value Number Average Value Number Average Value Number Average Value
LOANS ORIGINATED 16 $209,476 65 $241,406 72 $184,288 11 $35,822 24 $176,452 3 $44,580 APPLICATIONS APPROVED, NOT ACCEPTED 0 $0 8 $177,139 25 $215,183 5 $52,202 9 $116,814 0 $0 APPLICATIONS DENIED 7 $156,327 21 $402,428 56 $223,524 14 $54,986 11 $190,002 2 $23,315 APPLICATIONS WITHDRAWN 1 $124,000 9 $357,860 23 $256,838 3 $51,473 3 $149,743 1 $15,880 FILES CLOSED FOR INCOMPLETENESS 0 $0 6 $420,992 7 $316,244 1 $70,320 1 $496,090 0 $0
Aggregated Statistics For Year 2007(Based on 1 full and 2 partial tracts) A) FHA, FSA/RHS & VA B) Conventional C) Refinancings D) Home Improvement Loans F) Non-occupant Loans on G) Loans On Manufactured Number Average Value Number Average Value Number Average Value Number Average Value Number Average Value Number Average Value
LOANS ORIGINATED 2 $232,500 103 $258,627 176 $212,741 22 $95,391 58 $247,879 5 $41,300 APPLICATIONS APPROVED, NOT ACCEPTED 0 $0 14 $278,262 39 $214,750 8 $52,821 8 $236,814 0 $0 APPLICATIONS DENIED 1 $149,110 28 $454,007 118 $242,415 20 $86,205 14 $268,336 6 $117,543 APPLICATIONS WITHDRAWN 0 $0 14 $383,644 60 $222,258 3 $206,860 7 $277,140 0 $0 FILES CLOSED FOR INCOMPLETENESS 1 $109,140 0 $0 12 $271,618 0 $0 0 $0 0 $0
Aggregated Statistics For Year 2006(Based on 1 full and 2 partial tracts) A) FHA, FSA/RHS & VA B) Conventional C) Refinancings D) Home Improvement Loans E) Loans on Dwellings For 5+ Families F) Non-occupant Loans on G) Loans On Manufactured Number Average Value Number Average Value Number Average Value Number Average Value Number Average Value Number Average Value Number Average Value
LOANS ORIGINATED 1 $70,200 160 $226,234 219 $189,940 35 $90,017 0 $0 76 $190,176 5 $48,110 APPLICATIONS APPROVED, NOT ACCEPTED 0 $0 19 $192,958 43 $185,337 7 $82,269 0 $0 8 $162,018 2 $29,340 APPLICATIONS DENIED 0 $0 33 $196,071 90 $219,122 23 $77,753 0 $0 12 $273,066 3 $24,157 APPLICATIONS WITHDRAWN 0 $0 12 $180,779 75 $199,104 8 $113,919 1 $258,640 4 $211,502 2 $26,390 FILES CLOSED FOR INCOMPLETENESS 0 $0 8 $267,774 26 $230,047 1 $138,590 0 $0 1 $570,110 0 $0
Aggregated Statistics For Year 2005(Based on 1 full and 2 partial tracts) A) FHA, FSA/RHS & VA B) Conventional C) Refinancings D) Home Improvement Loans E) Loans on Dwellings For 5+ Families F) Non-occupant Loans on G) Loans On Manufactured Number Average Value Number Average Value Number Average Value Number Average Value Number Average Value Number Average Value Number Average Value
LOANS ORIGINATED 1 $141,000 265 $227,840 246 $202,115 41 $107,610 1 $456,920 122 $188,590 8 $56,572 APPLICATIONS APPROVED, NOT ACCEPTED 0 $0 36 $202,847 34 $165,541 5 $96,616 0 $0 14 $212,751 4 $35,148 APPLICATIONS DENIED 1 $128,070 59 $264,017 87 $212,998 17 $80,006 0 $0 22 $255,689 3 $31,513 APPLICATIONS WITHDRAWN 1 $44,070 32 $265,009 68 $199,301 12 $114,932 0 $0 8 $202,879 3 $47,803 FILES CLOSED FOR INCOMPLETENESS 0 $0 6 $214,365 53 $175,837 4 $50,878 0 $0 3 $124,723 0 $0
Aggregated Statistics For Year 2004(Based on 1 full and 2 partial tracts) A) FHA, FSA/RHS & VA B) Conventional C) Refinancings D) Home Improvement Loans E) Loans on Dwellings For 5+ Families F) Non-occupant Loans on G) Loans On Manufactured Number Average Value Number Average Value Number Average Value Number Average Value Number Average Value Number Average Value Number Average Value
LOANS ORIGINATED 4 $139,838 254 $196,208 261 $162,290 38 $87,825 0 $0 111 $170,909 7 $43,939 APPLICATIONS APPROVED, NOT ACCEPTED 1 $102,990 32 $170,155 49 $164,483 5 $90,710 0 $0 12 $186,922 1 $13,830 APPLICATIONS DENIED 1 $46,120 41 $171,432 84 $139,605 26 $63,235 0 $0 20 $121,959 6 $48,013 APPLICATIONS WITHDRAWN 1 $58,410 24 $197,737 62 $147,445 6 $65,258 1 $1,500,000 11 $145,577 0 $0 FILES CLOSED FOR INCOMPLETENESS 0 $0 6 $169,502 42 $142,776 6 $68,210 0 $0 2 $96,780 0 $0
Aggregated Statistics For Year 2003(Based on 1 full and 2 partial tracts) A) FHA, FSA/RHS & VA B) Conventional C) Refinancings D) Home Improvement Loans E) Loans on Dwellings For 5+ Families F) Non-occupant Loans on Number Average Value Number Average Value Number Average Value Number Average Value Number Average Value Number Average Value
LOANS ORIGINATED 4 $143,018 235 $169,457 494 $136,750 14 $39,363 0 $0 97 $139,280 APPLICATIONS APPROVED, NOT ACCEPTED 0 $0 21 $182,181 70 $139,444 8 $24,904 0 $0 9 $166,573 APPLICATIONS DENIED 1 $146,410 39 $151,650 150 $129,552 12 $24,536 0 $0 19 $139,483 APPLICATIONS WITHDRAWN 0 $0 27 $170,310 85 $135,569 4 $23,525 1 $1,000,000 7 $102,970 FILES CLOSED FOR INCOMPLETENESS 0 $0 4 $147,325 19 $147,133 1 $51,240 0 $0 1 $165,670
Aggregated Statistics For Year 2002(Based on 1 full and 2 partial tracts) A) FHA, FSA/RHS & VA B) Conventional C) Refinancings D) Home Improvement Loans E) Loans on Dwellings For 5+ Families F) Non-occupant Loans on Number Average Value Number Average Value Number Average Value Number Average Value Number Average Value Number Average Value
LOANS ORIGINATED 17 $112,564 220 $148,229 328 $124,246 25 $21,280 0 $0 83 $109,581 APPLICATIONS APPROVED, NOT ACCEPTED 2 $74,435 19 $145,375 42 $138,957 4 $32,748 1 $420,000 4 $93,352 APPLICATIONS DENIED 2 $77,630 17 $105,782 86 $85,643 13 $20,106 0 $0 5 $82,666 APPLICATIONS WITHDRAWN 1 $63,540 21 $188,997 55 $114,506 6 $12,147 0 $0 5 $151,060 FILES CLOSED FOR INCOMPLETENESS 0 $0 5 $106,450 25 $113,055 0 $0 0 $0 3 $124,730
Aggregated Statistics For Year 2001(Based on 1 full and 2 partial tracts) A) FHA, FSA/RHS & VA B) Conventional C) Refinancings D) Home Improvement Loans F) Non-occupant Loans on Number Average Value Number Average Value Number Average Value Number Average Value Number Average Value
LOANS ORIGINATED 29 $102,253 231 $128,709 212 $105,649 17 $28,669 58 $100,457 APPLICATIONS APPROVED, NOT ACCEPTED 1 $92,230 28 $122,538 29 $89,180 4 $21,440 6 $149,383 APPLICATIONS DENIED 1 $120,960 22 $93,570 76 $84,611 11 $19,608 6 $54,572 APPLICATIONS WITHDRAWN 1 $20,380 20 $165,308 58 $92,026 5 $15,812 3 $112,577 FILES CLOSED FOR INCOMPLETENESS 0 $0 4 $123,702 15 $119,607 1 $9,220 2 $96,845
Aggregated Statistics For Year 2000(Based on 1 full and 2 partial tracts) A) FHA, FSA/RHS & VA B) Conventional C) Refinancings D) Home Improvement Loans E) Loans on Dwellings For 5+ Families F) Non-occupant Loans on Number Average Value Number Average Value Number Average Value Number Average Value Number Average Value Number Average Value
LOANS ORIGINATED 13 $89,893 227 $120,809 53 $94,222 25 $19,466 1 $42,110 48 $107,374 APPLICATIONS APPROVED, NOT ACCEPTED 0 $0 27 $96,395 9 $64,419 6 $31,007 0 $0 5 $75,900 APPLICATIONS DENIED 3 $92,973 33 $106,835 57 $78,125 22 $18,688 0 $0 9 $74,532 APPLICATIONS WITHDRAWN 2 $77,720 18 $122,895 27 $75,271 3 $50,613 0 $0 4 $175,248 FILES CLOSED FOR INCOMPLETENESS 0 $0 4 $106,732 10 $86,645 1 $32,690 0 $0 1 $45,000
Aggregated Statistics For Year 1999(Based on 1 full and 2 partial tracts) A) FHA, FSA/RHS & VA B) Conventional C) Refinancings D) Home Improvement Loans F) Non-occupant Loans on Number Average Value Number Average Value Number Average Value Number Average Value Number Average Value
LOANS ORIGINATED 20 $81,096 156 $118,229 104 $85,472 23 $29,062 35 $94,574 APPLICATIONS APPROVED, NOT ACCEPTED 1 $48,700 15 $128,456 28 $80,046 9 $17,640 4 $58,545 APPLICATIONS DENIED 1 $64,550 24 $85,195 39 $82,668 15 $19,689 2 $85,420 APPLICATIONS WITHDRAWN 0 $0 18 $111,764 35 $84,303 4 $41,360 4 $73,762 FILES CLOSED FOR INCOMPLETENESS 0 $0 5 $104,432 21 $88,405 1 $19,630 3 $109,217
Detailed HMDA statistics for the following Tracts:
0002.00
, 0004.00 , 0005.00
Private Mortgage Insurance Companies Aggregated Statistics For Year 2009(Based on 1 full and 2 partial tracts) A) Conventional B) Refinancings Number Average Value Number Average Value
LOANS ORIGINATED 2 $172,390 0 $0 APPLICATIONS APPROVED, NOT ACCEPTED 0 $0 0 $0 APPLICATIONS DENIED 1 $156,790 1 $77,880 APPLICATIONS WITHDRAWN 1 $78,400 0 $0 FILES CLOSED FOR INCOMPLETENESS 0 $0 0 $0
Aggregated Statistics For Year 2008(Based on 1 full and 2 partial tracts) A) Conventional B) Refinancings C) Non-occupant Loans on Number Average Value Number Average Value Number Average Value
LOANS ORIGINATED 7 $219,514 4 $308,930 1 $264,740 APPLICATIONS APPROVED, NOT ACCEPTED 5 $237,142 5 $333,148 1 $178,620 APPLICATIONS DENIED 2 $273,620 0 $0 1 $182,410 APPLICATIONS WITHDRAWN 0 $0 1 $101,460 0 $0 FILES CLOSED FOR INCOMPLETENESS 0 $0 0 $0 0 $0
Aggregated Statistics For Year 2007(Based on 1 full and 2 partial tracts) A) Conventional B) Refinancings C) Non-occupant Loans on Number Average Value Number Average Value Number Average Value
LOANS ORIGINATED 22 $256,435 9 $200,010 2 $323,770 APPLICATIONS APPROVED, NOT ACCEPTED 1 $405,820 6 $294,227 2 $162,475 APPLICATIONS DENIED 1 $180,360 2 $169,490 0 $0 APPLICATIONS WITHDRAWN 2 $525,955 1 $283,870 0 $0 FILES CLOSED FOR INCOMPLETENESS 0 $0 0 $0 0 $0
Aggregated Statistics For Year 2006(Based on 1 full and 2 partial tracts) A) Conventional B) Refinancings C) Non-occupant Loans on Number Average Value Number Average Value Number Average Value
LOANS ORIGINATED 18 $261,614 3 $268,937 6 $282,045 APPLICATIONS APPROVED, NOT ACCEPTED 3 $232,780 2 $324,240 1 $223,000 APPLICATIONS DENIED 0 $0 0 $0 0 $0 APPLICATIONS WITHDRAWN 2 $314,705 1 $116,310 1 $296,120 FILES CLOSED FOR INCOMPLETENESS 0 $0 0 $0 0 $0
Aggregated Statistics For Year 2005(Based on 1 full and 2 partial tracts) A) Conventional B) Refinancings C) Non-occupant Loans on Number Average Value Number Average Value Number Average Value
LOANS ORIGINATED 26 $258,868 2 $285,070 10 $222,692 APPLICATIONS APPROVED, NOT ACCEPTED 2 $209,145 2 $171,675 1 $59,390 APPLICATIONS DENIED 1 $275,390 0 $0 0 $0 APPLICATIONS WITHDRAWN 2 $257,565 1 $267,990 0 $0 FILES CLOSED FOR INCOMPLETENESS 0 $0 0 $0 0 $0
Aggregated Statistics For Year 2004(Based on 1 full and 2 partial tracts) A) Conventional B) Refinancings C) Non-occupant Loans on D) Loans On Manufactured Number Average Value Number Average Value Number Average Value Number Average Value
LOANS ORIGINATED 39 $200,461 11 $218,437 8 $159,365 1 $50,730 APPLICATIONS APPROVED, NOT ACCEPTED 12 $188,635 3 $146,357 1 $229,230 0 $0 APPLICATIONS DENIED 1 $222,000 1 $410,000 0 $0 0 $0 APPLICATIONS WITHDRAWN 2 $256,535 0 $0 0 $0 0 $0 FILES CLOSED FOR INCOMPLETENESS 0 $0 1 $50,730 0 $0 0 $0
Aggregated Statistics For Year 2003(Based on 1 full and 2 partial tracts) A) Conventional B) Refinancings C) Non-occupant Loans on Number Average Value Number Average Value Number Average Value
LOANS ORIGINATED 55 $171,038 25 $148,278 11 $129,082 APPLICATIONS APPROVED, NOT ACCEPTED 11 $172,691 5 $146,380 2 $194,585 APPLICATIONS DENIED 2 $108,760 2 $122,205 1 $58,670 APPLICATIONS WITHDRAWN 6 $173,555 2 $218,120 2 $193,915 FILES CLOSED FOR INCOMPLETENESS 0 $0 0 $0 0 $0
Aggregated Statistics For Year 2002(Based on 1 full and 2 partial tracts) A) Conventional B) Refinancings C) Non-occupant Loans on Number Average Value Number Average Value Number Average Value
LOANS ORIGINATED 60 $152,771 29 $140,507 10 $108,461 APPLICATIONS APPROVED, NOT ACCEPTED 6 $197,797 11 $131,406 0 $0 APPLICATIONS DENIED 1 $331,650 0 $0 0 $0 APPLICATIONS WITHDRAWN 7 $144,126 4 $151,138 3 $120,950 FILES CLOSED FOR INCOMPLETENESS 1 $248,910 0 $0 0 $0
Aggregated Statistics For Year 2001(Based on 1 full and 2 partial tracts) A) Conventional B) Refinancings C) Non-occupant Loans on Number Average Value Number Average Value Number Average Value
LOANS ORIGINATED 53 $146,242 17 $124,999 12 $125,197 APPLICATIONS APPROVED, NOT ACCEPTED 10 $116,810 2 $151,280 2 $107,205 APPLICATIONS DENIED 3 $121,227 0 $0 1 $75,070 APPLICATIONS WITHDRAWN 0 $0 2 $123,745 0 $0 FILES CLOSED FOR INCOMPLETENESS 0 $0 0 $0 0 $0
Aggregated Statistics For Year 2000(Based on 1 full and 2 partial tracts) A) Conventional B) Refinancings C) Non-occupant Loans on Number Average Value Number Average Value Number Average Value
LOANS ORIGINATED 64 $122,549 6 $92,010 10 $94,692 APPLICATIONS APPROVED, NOT ACCEPTED 5 $124,688 2 $97,355 1 $71,220 APPLICATIONS DENIED 7 $113,449 1 $94,000 1 $70,790 APPLICATIONS WITHDRAWN 3 $137,663 1 $85,000 0 $0 FILES CLOSED FOR INCOMPLETENESS 0 $0 0 $0 0 $0
Aggregated Statistics For Year 1999(Based on 1 full and 2 partial tracts) A) Conventional B) Refinancings C) Non-occupant Loans on Number Average Value Number Average Value Number Average Value
LOANS ORIGINATED 34 $111,486 8 $129,411 7 $89,276 APPLICATIONS APPROVED, NOT ACCEPTED 3 $214,297 2 $86,990 1 $106,590 APPLICATIONS DENIED 6 $105,455 1 $82,460 1 $62,150 APPLICATIONS WITHDRAWN 2 $193,500 1 $76,050 1 $79,540 FILES CLOSED FOR INCOMPLETENESS 1 $109,840 0 $0 0 $0
Detailed PMIC statistics for the following Tracts:
0002.00
, 0004.00 , 0005.00 Fire-safe hotels and motels in Jensen Beach, Florida:
Land Mark Motel, 2135 Ne Dixie Hwy, Jensen Beach, Florida 34957
Pelican Rest Motel, 3580 Ne Indian Riv Dr, Jensen Beach, Florida 34957
Sheraton Inn, 10978 S A1a, Jensen Beach, Florida 34957
All 3 fire-safe hotels and motels in Jensen Beach, Florida
Most common first names in Jensen Beach, FL among deceased individuals Name Count Lived (average)
John 169 77.6 years Robert 141 76.4 years William 134 77.0 years Mary 99 81.5 years Joseph 94 77.7 years James 90 76.0 years George 88 79.3 years Charles 75 76.6 years Richard 73 73.4 years Edward 58 77.9 years
Most common last names in Jensen Beach, FL among deceased individuals Last name Count Lived (average)
Smith 35 78.7 years Miller 21 77.5 years Johnson 19 78.5 years White 18 80.5 years Brown 17 78.8 years Taylor 16 81.8 years Kelly 14 75.5 years Wilson 14 77.6 years Williams 14 80.8 years Phillips 13 82.9 years
Jensen Beach compared to Florida state average:
Unemployed percentage below state average. Black race population percentage significantly below state average. Hispanic race population percentage significantly below state average. Median age significantly above state average. Foreign-born population percentage below state average. Length of stay since moving in above state average. Jensen Beach on our top lists :
#35 on the list of "Top 101 cities with the largest percentage of divorced people (15+ years)(population 5,000+)"
#68 on the list of "Top 101 cities with largest percentage of females in occupations: office and administrative support occupations (population 5,000+)"
#100 on the list of "Top 101 cities with largest percentage of males in industries: retail trade (population 5,000+)"
#39 (34996) on the list of "Top 101 zip codes with the smallest percentage of returns reporting salary or wage in 2012 (pop 5,000+)"
#94 (34996) on the list of "Top 101 zip codes with the highest 2012 average taxable interest for individuals (pop 5,000+)"
#3 on the list of "Top 101 counties with the largest number of people without health insurance coverage in 2000 (pop. 50,000+)"
#9 on the list of "Top 101 counties with the lowest number of births per 1000 residents 2007-2013"
#69 on the list of "Top 101 counties with the largest decrease in the number of births per 1000 residents 2000-2006 to 2007-2013 (pop 50,000+)"
#73 on the list of "Top 101 counties with the highest number of deaths per 1000 residents 2007-2013 (pop. 50,000+)"
Top Patent Applicants
Warren Ross Federgreen (7)
Michael Heissenberg (3)
Keith Kopp (3)
William Kozarek (2)
Ronald J. Rudolph (2)
Billie E. Sealey (2)
Gregory Blackman (2)
George William Mcclurg (2)
George W. Mcclurg (2)
Jeanne Desanctis (1)
Total of 64 patent applications in 2008-2024.


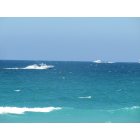
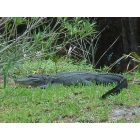


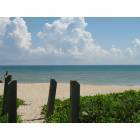


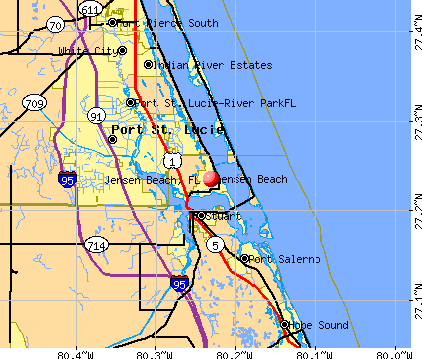


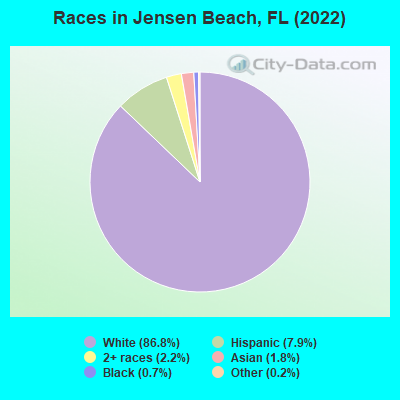
 Recent articles from our blog. Our writers, many of them Ph.D. graduates or candidates, create easy-to-read articles on a wide variety of topics.


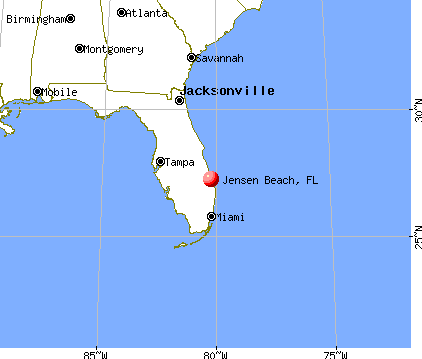
 (8.1 miles
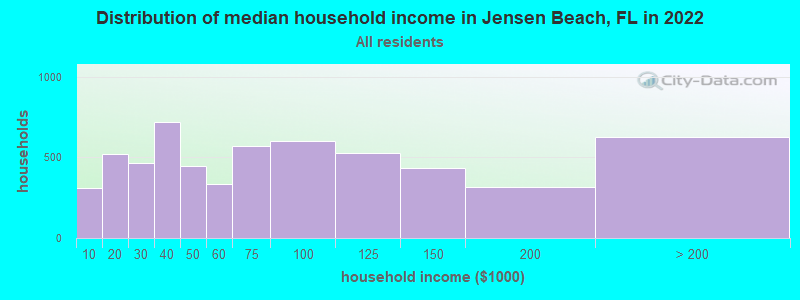
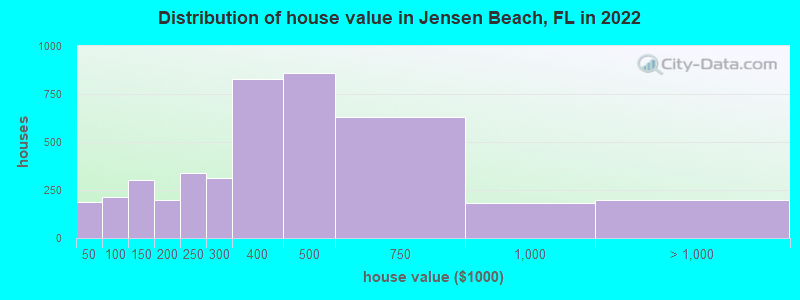
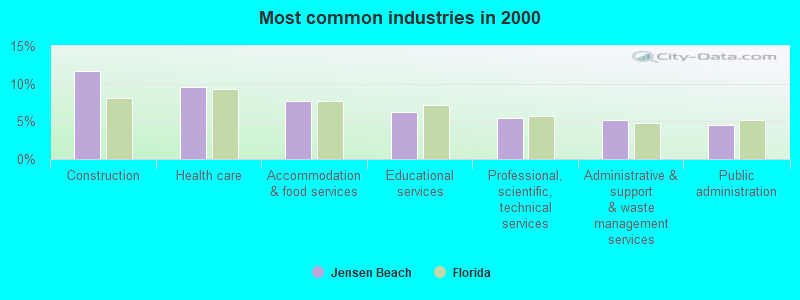
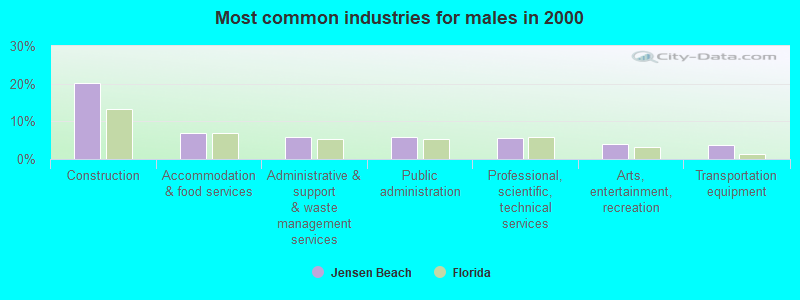
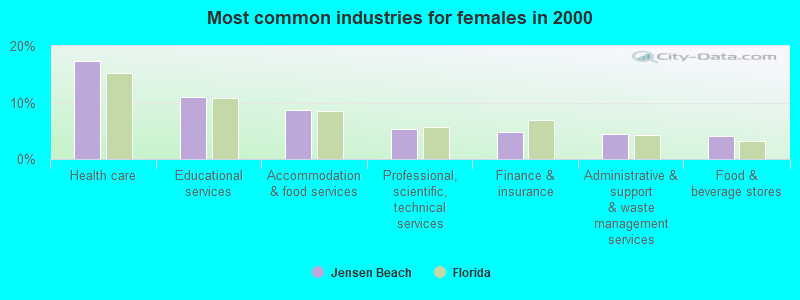
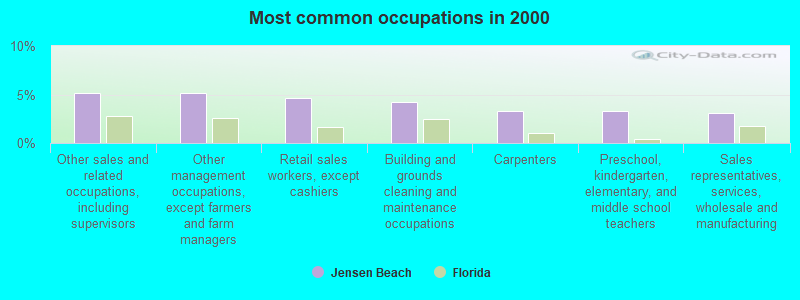
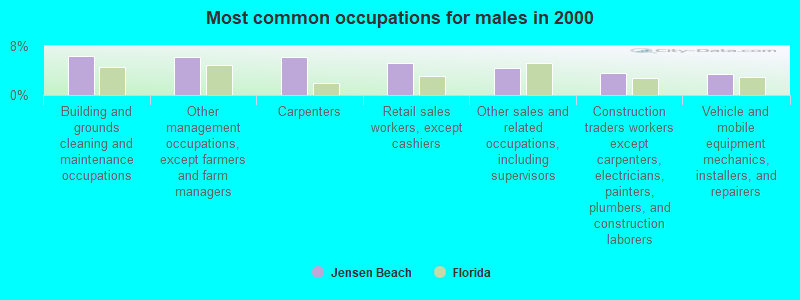
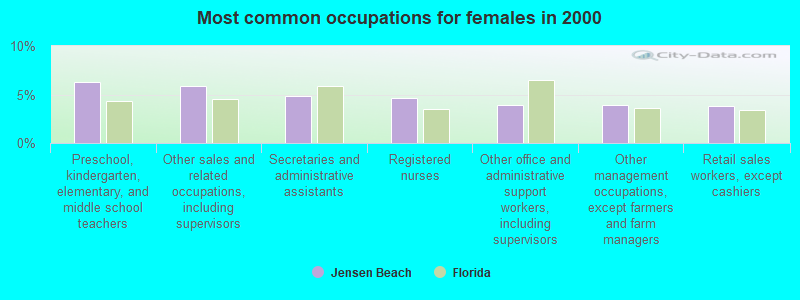
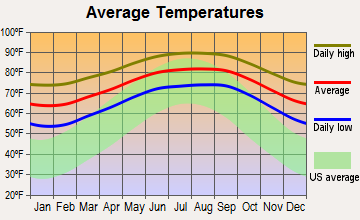
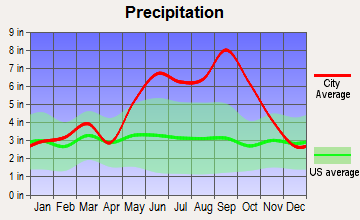
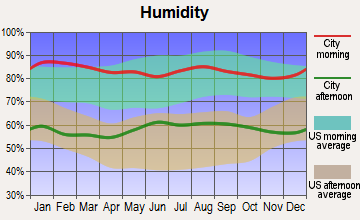
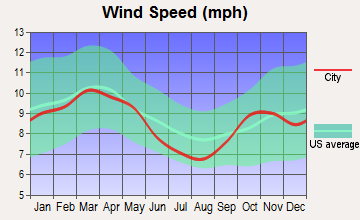
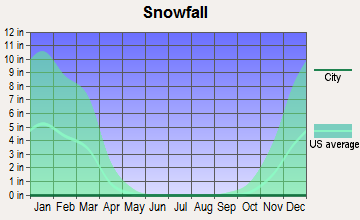
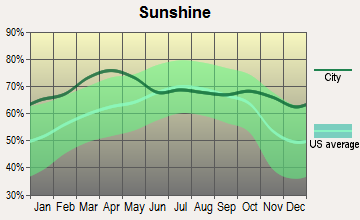
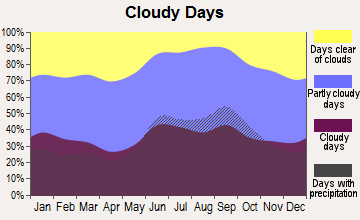


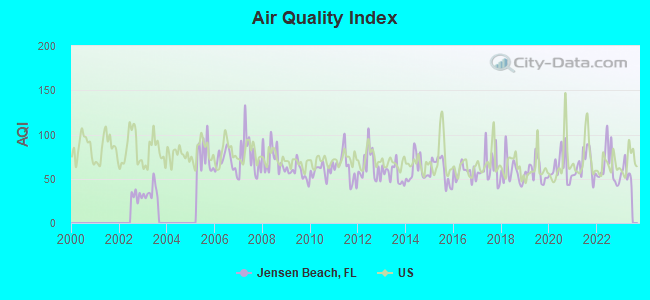
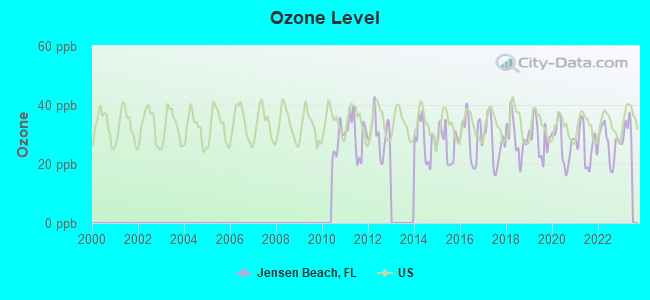
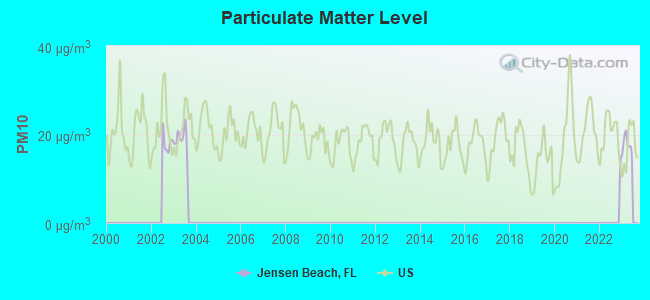
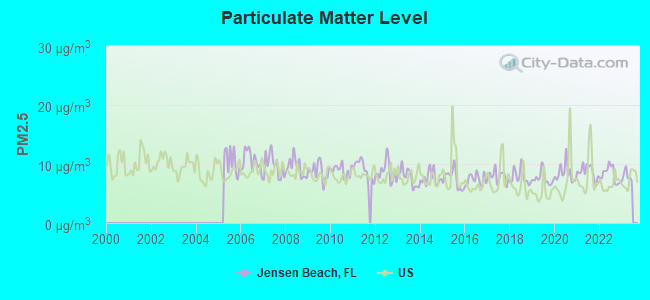
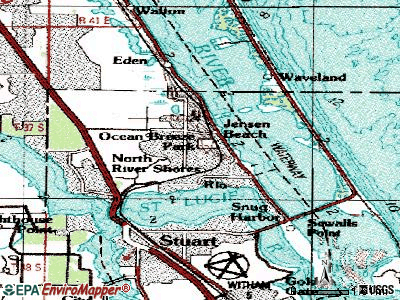
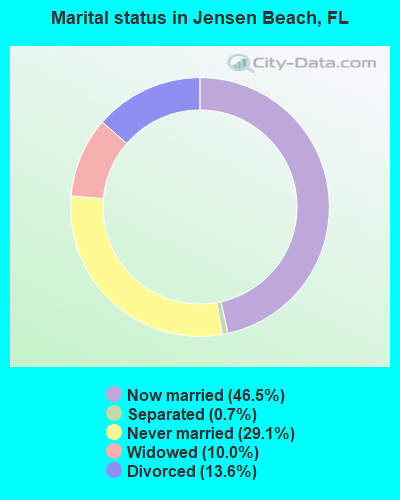
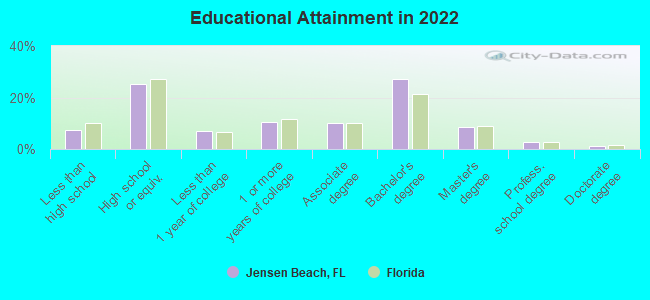
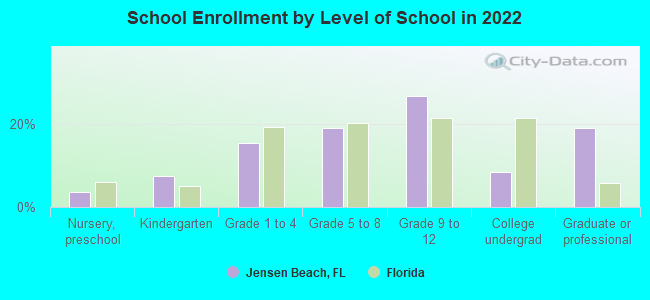
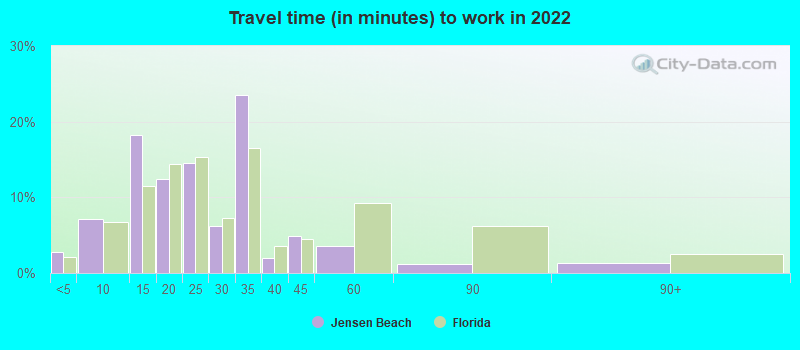
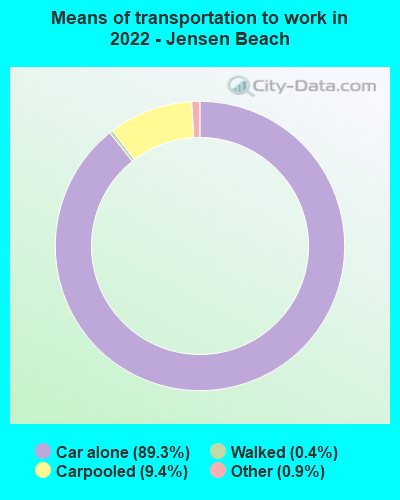
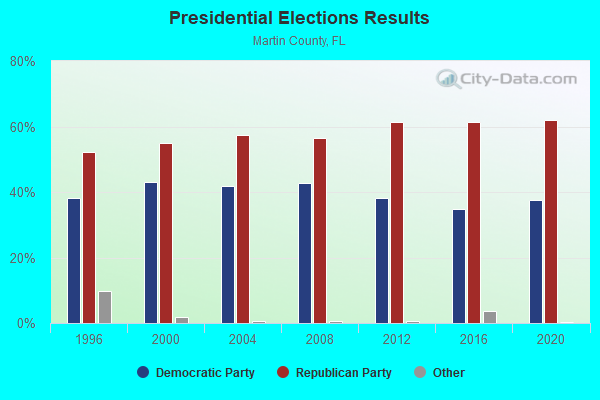
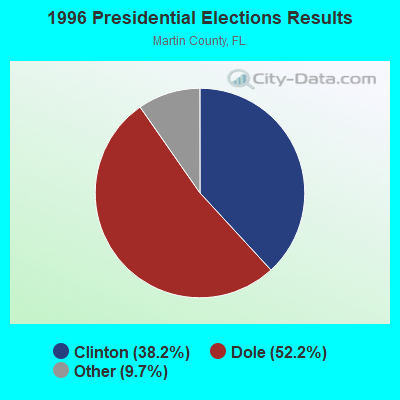
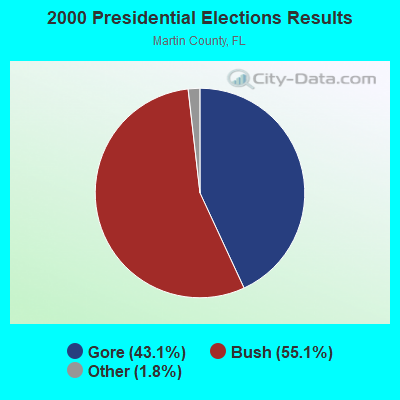
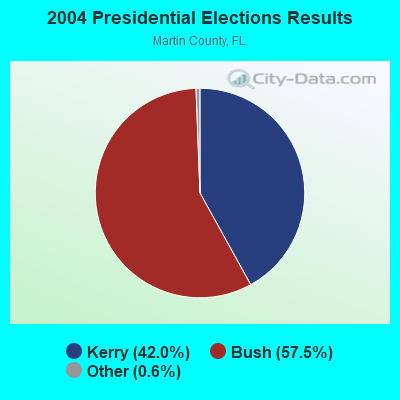
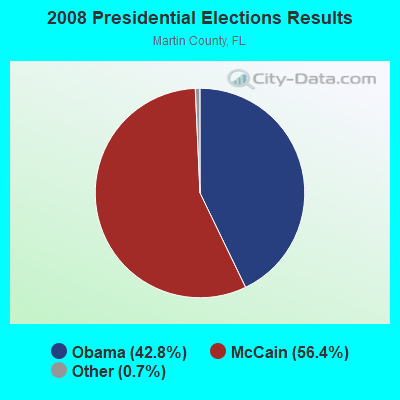
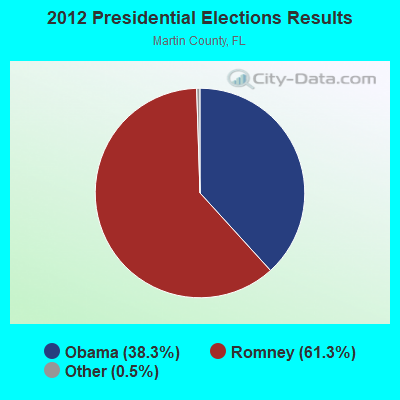
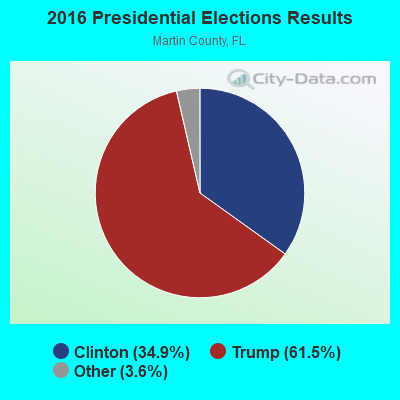
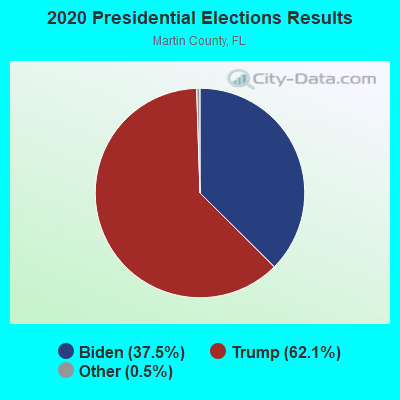
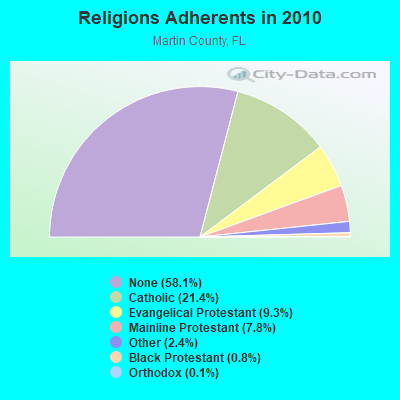
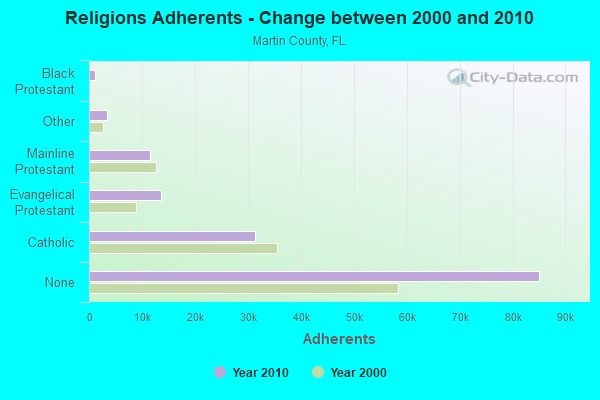
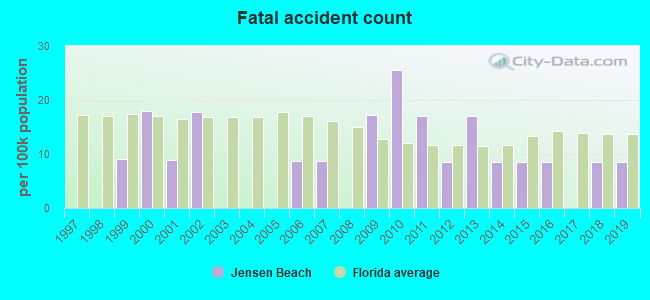
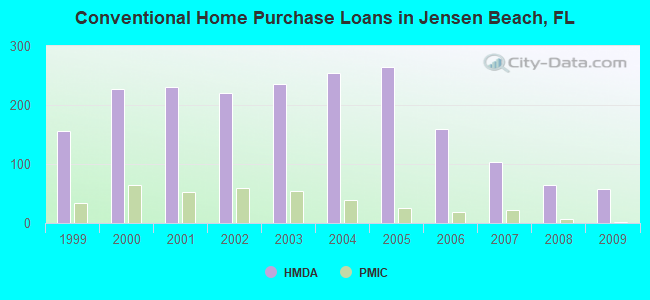
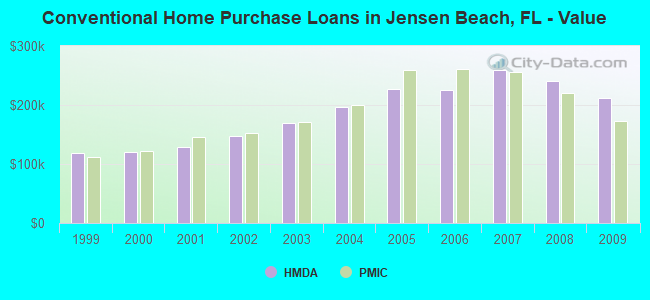
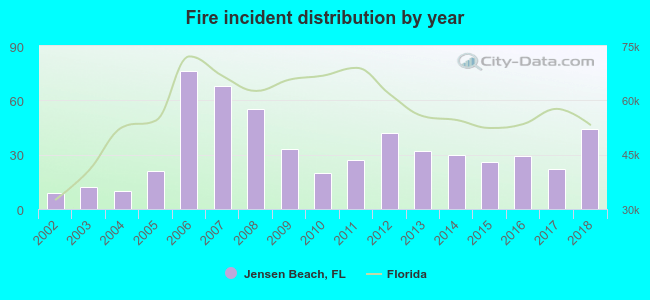 According to the data from the years 2002 - 2018 the average number of fire incidents per year is 33. The highest number of reported fires - 76 took place in 2006, and the least - 9 in 2002. The data has a rising trend.
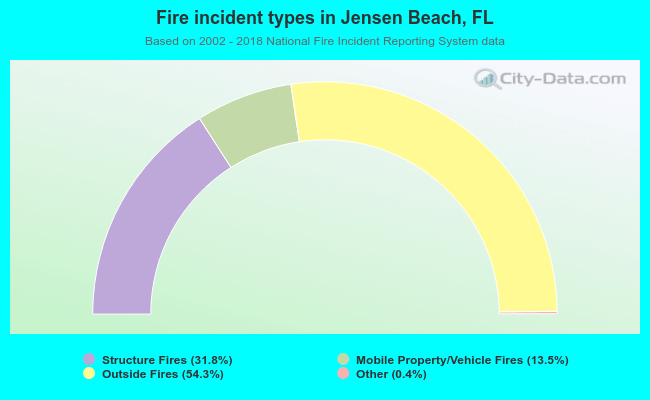 When looking into fire subcategories, the most incidents belonged to: Outside Fires (54.3%), and Structure Fires (31.8%).