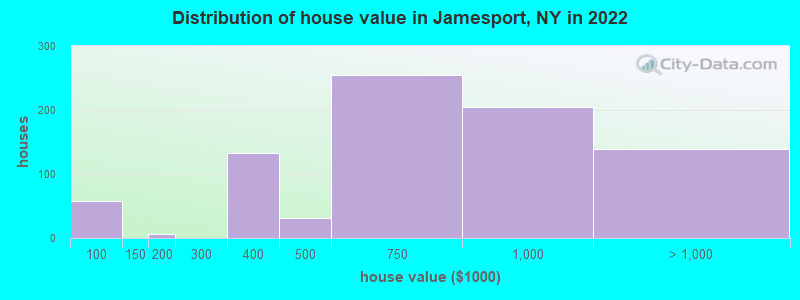
Estimated median house or condo value in 2022: $711,589 (it was $195,600 in 2000)
Jamesport:
$711,589
NY:
$400,400
Mean prices in 2022:all housing units: over $1,000,000; detached houses: over $1,000,000March 2022 cost of living index in Jamesport: 146.9 (very high, U.S. average is 100)
Ancestries: American (22.2%), Irish (18.0%), Italian (16.2%), German (12.6%), Polish (8.4%), British (3.9%).
Current Local Time: EST time zone
Elevation: 10 feet
Land area: 4.42 square miles.
Population density: 387 people per square mile (very low).
320 residents are foreign born (11.4% Asia, 7.9% Europe).
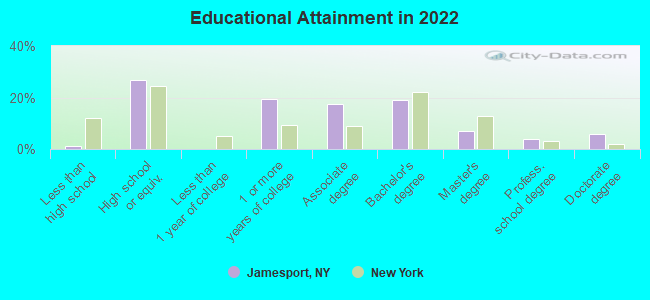
This place:
19.6%
New York:
22.6%
Median real estate property taxes paid for housing units with mortgages in 2022: $10,001 (1.7%) Median real estate property taxes paid for housing units with no mortgage in 2022: $9,738 (1.1%)
Nearest city with pop. 50,000+: West Haven, CT (30.4 miles , pop. 52,360).
Nearest city with pop. 200,000+: North Hempstead, NY (58.2 miles , pop. 222,611).
Nearest city with pop. 1,000,000+: Queens, NY (67.0 miles , pop. 2,229,379).
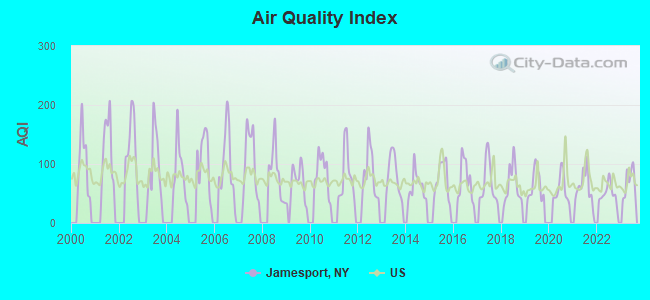
Air Quality Index (AQI) level in 2023 was 70.4. This is about average.
City:
70.4
U.S.:
72.6
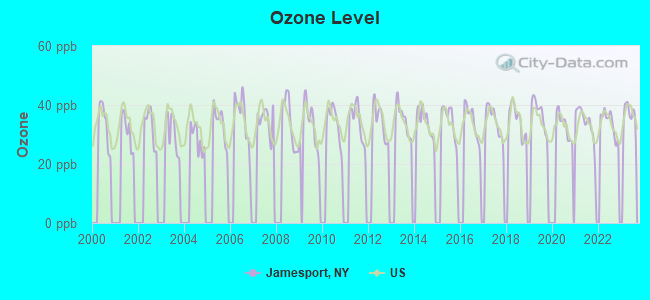
Ozone [ppb] level in 2023 was 37.3. This is about average.Closest monitor was 7.2 miles away from the city center.
City:
37.3
U.S.:
33.3
Tornado activity:
Jamesport-area historical tornado activity is near New York state average. It is 65% smaller than the overall U.S. average.
On 7/10/1989, a category F4 (max. wind speeds 207-260 mph) tornado 31.5 miles away from the Jamesport place center injured 40 peopleand causedbetween $50,000,000 and $500,000,000 in damages.
On 8/8/1999, a category F2 (max. wind speeds 113-157 mph) tornado 4.9 miles away from the place center injured one personand caused $1 million in damages.
Earthquake activity:
Jamesport-area historical earthquake activity is significantly above New York state average. It is 72% smaller than the overall U.S. average.
On 10/7/1983 at 10:18:46, a magnitude 5.3 (5.1 MB, 5.3 LG, 5.1 ML, Class: Moderate, Intensity: VI - VII) earthquake occurred 226.7 miles away from the city center On 4/20/2002 at 10:50:47, a magnitude 5.3 (5.3 ML, Depth: 3.0 mi) earthquake occurred 253.3 miles away from Jamesport center On 8/23/2011 at 17:51:04, a magnitude 5.8 (5.8 MW, Depth: 3.7 mi) earthquake occurred 354.9 miles away from the city center On 4/20/2002 at 10:50:47, a magnitude 5.2 (5.2 MB, 4.2 MS, 5.2 MW, 5.0 MW) earthquake occurred 251.8 miles away from Jamesport center On 8/22/1992 at 12:20:32, a magnitude 4.8 (4.8 MB, 3.8 MS, 4.7 LG, Depth: 6.2 mi, Class: Light, Intensity: IV - V) earthquake occurred 174.6 miles away from Jamesport center On 1/19/1982 at 00:14:42, a magnitude 4.7 (4.5 MB, 4.7 MD, 4.5 LG) earthquake occurred 183.7 miles away from Jamesport center Magnitude types: regional Lg-wave magnitude (LG), body-wave magnitude (MB), duration magnitude (MD), local magnitude (ML), surface-wave magnitude (MS), moment magnitude (MW)
Natural disasters:
The number of natural disasters in Suffolk County (28) is a lot greater than the US average (15). Major Disasters (Presidential) Declared: 19 Emergencies Declared: 7
Causes of natural disasters: Hurricanes: 9, Floods: 7, Storms: 7, Snowstorms: 4, Winter Storms: 3, Blizzards: 2, Heavy Rain: 1, Power Outage: 1, Tropical Depression: 1, Tropical Storm: 1, Water Shortage: 1, Other: 3 (Note: some incidents may be assigned to more than one category).
Hospitals and medical centers in Jamesport:
AID TO THE DEVELOPMENTALLY DISABLED, INC (SOUTH JAMESPORT AVE)
Other hospitals and medical centers near Jamesport:
GENTIVA HEALTH SVS HAUPPAUGE - RIVERHEAD SUB-UNIT (Home Health Center, about 5 miles away; RIVERHEAD, NY)
AID TO THE DEVELOPMENTALLY DISABLED, INC (Hospital, about 5 miles away; RIVERHEAD, NY)
PECONIC BAY HOMEHEALTH SVS (Home Health Center, about 6 miles away; RIVERHEAD, NY)
PECONIC BAY MEDICAL CENTER Acute Care Hospitals (about 6 miles away; RIVERHEAD, NY)
PECONIC BAY SKILLED NURSING FACILITY (Nursing Home, about 6 miles away; RIVERHEAD, NY)
INDEPENDENT GROUP HOME LIVING PROGRAM, INC (Hospital, about 6 miles away; FLANDERS, NY)
EAST END DIALYSIS MANAGEMENT LLC (Dialysis Facility, about 6 miles away; RIVERHEAD, NY)
Likely homosexual households (counted as self-reported same-sex unmarried-partner households)
Lesbian couples: 0.3% of all households
Gay men: 1.0% of all households
15 people in group homes intended for adults in 2010
59 people in agriculture workers' dormitories on farms in 2000
8 people in homes for the mentally ill in 2000
Banks with branches in Jamesport (2011 data):
Capital One, National Association: Jamesport Branch at Main Road, branch established on 1961/06/24. Info updated 2011/07/01: Bank assets: $133,477.8 mil, Deposits: $97,063.7 mil, headquarters in Mclean, VA, positive income, 984 total offices, Holding Company: Capital One Financial Corporation
Religion statistics for Jamesport, NY (based on Suffolk County data)
Religion
Adherents
Congregations
Catholic
879,457
75
Mainline Protestant
69,205
182
Evangelical Protestant
58,909
264
Other
50,771
124
Orthodox
10,190
10
Black Protestant
8,298
49
None
416,520
-
Source: Clifford Grammich, Kirk Hadaway, Richard Houseal, Dale E.Jones, Alexei Krindatch, Richie Stanley and Richard H.Taylor. 2012. 2010 U.S.Religion Census: Religious Congregations & Membership Study. Association of Statisticians of American Religious Bodies. Jones, Dale E., et al. 2002. Congregations and Membership in the United States 2000. Nashville, TN: Glenmary Research Center. Graphs represent county-level data
Frank Moy, N Of Sound Ave & E Of Herricks Ln (Lat: 40.986389 Lon: -72.585000), Type: 128.0, Overall height: 122 m, Registrant: Long Island Lighting Company, Hicks-ville, Phone: (516) 545-5116
N Of Sound Ave & E Of Herricks Ln (Lat: 40.986389 Lon: -72.585000), Type: 128.0, Overall height: 122 m, Registrant: Long Island Lighting Company, Hicks-ville, Phone: (516) 545-5116
FCC Registered Broadcast Land Mobile Towers:
6
Main Rd (Lat: 40.950944 Lon: -72.577306), Call Sign: KNCU551, Assigned Frequencies: 461.875 MHz, 466.875 MHz, Grant Date: 12/12/1996, Expiration Date: 01/21/2002, Cancellation Date: 05/05/2002, Registrant: Half Hollow Nursery Inc, 595 Half Hollow Rd, Dix Hills, NY 11746, Phone: (516) 667-4400
Herricks Ln 1 Mi Ne Rt 25 (Lat: 40.959278 Lon: -72.583417), Call Sign: KXF465, Assigned Frequencies: 151.655 MHz, Grant Date: 03/05/2013, Expiration Date: 03/21/2023, Cancellation Date: 05/27/2023, Registrant: North Fork Nursery, 448 Herricks Lane, Jamesport, NY 11947, Phone: (631) 722-3850
N S Sound Ave East Of Herricks Ln (Lat: 40.986500 Lon: -72.585083), Call Sign: KNHP384, Licensee ID: L00194394, Assigned Frequencies: 37.4600 MHz, Grant Date: 11/04/1998, Expiration Date: 11/04/2003, Cancellation Date: 11/03/2003, Registrant: Keyspan Corp Dba Keyspan Energy, 175 E Old Country Rd, Hicksville, NY 11801, Phone: (516) 545-5116
N Side Sound Ave E Of Herricks Ln (Lat: 40.986500 Lon: -72.585083), Structure height: 122 m, Call Sign: WFB674, Assigned Frequencies: 451.625 MHz, 451.675 MHz, 173.396 MHz, 451.525 MHz, 456.525 MHz, Grant Date: 07/21/2021, Expiration Date: 07/17/2031, Certifier: Lynda Nicolino, Registrant: Long Island Power Authority, 175 East Old Country Rd., Operations 2 Bldg, 2nd Fl, Hicksville, NY 11801, Phone: (516) 949-2100, Fax: (516) 949-8346, Email:
Ns Sound Ave Eo Herricks Ln (Lat: 40.986500 Lon: -72.585083), Call Sign: WRY346, Assigned Frequencies: 158.235 MHz, 160.425 MHz, Grant Date: 03/16/2022, Expiration Date: 04/07/2032, Certifier: Lynda Nicolino, Registrant: Long Island Power Authority, 333 Earle Ovington Blvd, Suite 403, Uniondale, NY 11553, Phone: (516) 222-7700, Fax: (516) 222-9137, Email:
5792 Sound Avenue (Lat: 40.988611 Lon: -72.607778), Type: Tower, Structure height: 49 m, Call Sign: WPTL235, Assigned Frequencies: 855.837 MHz, Grant Date: 10/23/2001, Expiration Date: 10/23/2011, Cancellation Date: 12/16/2004, Registrant: Wiley Rein & Fielding LLP, 1776 K Street, N.W., Washington, DC 20006, Phone: (202) 719-7019, Fax: (202) 719-7207, Email:
FCC Registered Microwave Towers:
1
Jamesport, N Of Sound Ave & E Of Herricks Ln (Lat: 40.986389 Lon: -72.585000), Type: Gtower, Structure height: 122 m, Overall height: 128 m, Call Sign: WQYW582, Assigned Frequencies: 11325.0 MHz, 11325.0 MHz, 11325.0 MHz, 11325.0 MHz, 11325.0 MHz, 11325.0 MHz, 11325.0 MHz, Grant Date: 02/13/2017, Expiration Date: 02/13/2027, Certifier: Martin Flatley, Registrant: Integrated Wireless Technologies, 101-1 Colin Drive, Holbrook, NY 11741, Phone: (631) 595-2555, Fax: (631) 595-2521, Email:
FCC Registered Amateur Radio Licenses:
3
Call Sign: N2JUM, Previous Call Sign: KB2IBG, Grant Date: 08/08/1989, Expiration Date: 08/08/1999, Cancellation Date: 08/09/2001, Registrant: Anthony T Litsch Jr, 1 Legend Ln, Jamesport, NY 11947
Call Sign: W0MMR, Previous Call Sign: KC2ENT, Licensee ID: L00073673, Grant Date: 01/28/2009, Expiration Date: 03/17/2019, Cancellation Date: 03/18/2021, Registrant: Martin M Rosen, Jamesport, NY 11947
Call Sign: WA2WGZ, Previous Call Sign: N2WJB, Licensee ID: L01151106, Grant Date: 05/13/2006, Expiration Date: 07/02/2016, Cancellation Date: 07/03/2018, Registrant: Joseph Goldman, P.O. Box #71, Jamesport, NY 11947
Home Mortgage Disclosure Act Aggregated Statistics For Year 2009 (Based on 1 partial tract)
A) FHA, FSA/RHS & VA Home Purchase Loans
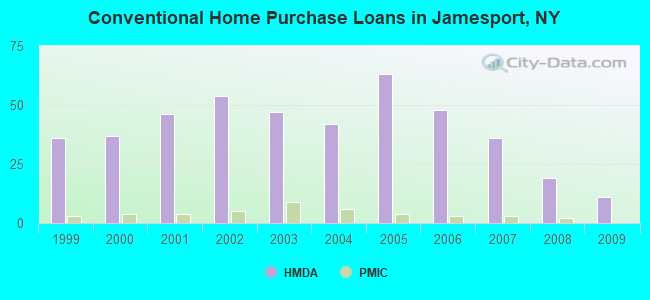
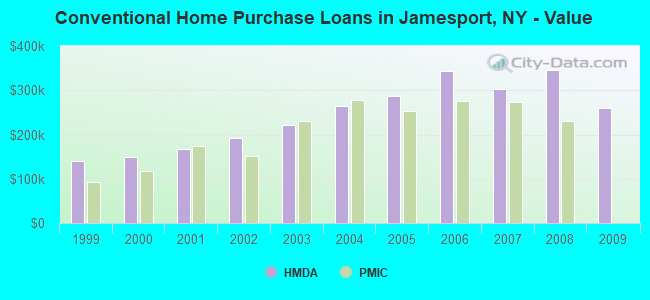
B) Conventional Home Purchase Loans
C) Refinancings
D) Home Improvement Loans
F) Non-occupant Loans on < 5 Family Dwellings (A B C & D)
G) Loans On Manufactured Home Dwelling (A B C & D)
Number
Average Value
Number
Average Value
Number
Average Value
Number
Average Value
Number
Average Value
Number
Average Value
LOANS ORIGINATED
3
$317,597
11
$260,819
43
$275,493
6
$166,352
9
$383,739
1
$22,790
APPLICATIONS APPROVED, NOT ACCEPTED
1
$186,100
2
$236,235
7
$341,711
1
$165,340
2
$308,020
0
$0
APPLICATIONS DENIED
2
$417,275
2
$283,205
21
$301,127
3
$77,733
4
$325,298
1
$33,420
APPLICATIONS WITHDRAWN
1
$289,660
4
$297,382
14
$285,772
1
$99,760
1
$219,520
0
$0
FILES CLOSED FOR INCOMPLETENESS
0
$0
1
$113,940
3
$347,473
0
$0
1
$172,180
0
$0
Aggregated Statistics For Year 2008 (Based on 1 partial tract)
A) FHA, FSA/RHS & VA Home Purchase Loans
B) Conventional Home Purchase Loans
C) Refinancings
D) Home Improvement Loans
F) Non-occupant Loans on < 5 Family Dwellings (A B C & D)
G) Loans On Manufactured Home Dwelling (A B C & D)
Number
Average Value
Number
Average Value
Number
Average Value
Number
Average Value
Number
Average Value
Number
Average Value
LOANS ORIGINATED
2
$333,590
19
$346,298
21
$261,121
8
$107,484
10
$442,897
1
$67,350
APPLICATIONS APPROVED, NOT ACCEPTED
0
$0
4
$486,840
6
$290,167
2
$97,355
2
$317,260
0
$0
APPLICATIONS DENIED
0
$0
5
$238,362
21
$279,798
6
$134,070
4
$240,222
0
$0
APPLICATIONS WITHDRAWN
1
$306,880
3
$339,627
11
$270,809
2
$147,490
2
$311,185
0
$0
FILES CLOSED FOR INCOMPLETENESS
0
$0
0
$0
3
$295,063
0
$0
1
$121,540
0
$0
Aggregated Statistics For Year 2007 (Based on 1 partial tract)
A) FHA, FSA/RHS & VA Home Purchase Loans
B) Conventional Home Purchase Loans
C) Refinancings
D) Home Improvement Loans
F) Non-occupant Loans on < 5 Family Dwellings (A B C & D)
G) Loans On Manufactured Home Dwelling (A B C & D)
Number
Average Value
Number
Average Value
Number
Average Value
Number
Average Value
Number
Average Value
Number
Average Value
LOANS ORIGINATED
1
$192,180
36
$303,615
45
$294,820
14
$181,400
14
$568,235
1
$75,960
APPLICATIONS APPROVED, NOT ACCEPTED
0
$0
5
$271,734
11
$302,229
3
$99,253
3
$300,210
1
$30,890
APPLICATIONS DENIED
0
$0
8
$264,214
35
$316,746
7
$142,950
2
$319,540
1
$48,610
APPLICATIONS WITHDRAWN
0
$0
4
$330,805
11
$287,843
2
$119,005
1
$406,130
0
$0
FILES CLOSED FOR INCOMPLETENESS
0
$0
1
$182,810
6
$295,948
1
$114,450
0
$0
0
$0
Aggregated Statistics For Year 2006 (Based on 1 partial tract)
A) FHA, FSA/RHS & VA Home Purchase Loans
B) Conventional Home Purchase Loans
C) Refinancings
D) Home Improvement Loans
F) Non-occupant Loans on < 5 Family Dwellings (A B C & D)
G) Loans On Manufactured Home Dwelling (A B C & D)
Number
Average Value
Number
Average Value
Number
Average Value
Number
Average Value
Number
Average Value
Number
Average Value
LOANS ORIGINATED
1
$351,950
48
$343,112
58
$267,292
19
$116,285
13
$389,967
1
$41,020
APPLICATIONS APPROVED, NOT ACCEPTED
0
$0
5
$382,838
17
$256,075
4
$98,115
1
$223,070
0
$0
APPLICATIONS DENIED
0
$0
11
$260,266
29
$305,211
8
$163,061
2
$250,920
2
$36,080
APPLICATIONS WITHDRAWN
0
$0
8
$346,884
21
$282,366
3
$188,297
2
$327,515
1
$40,260
FILES CLOSED FOR INCOMPLETENESS
0
$0
2
$248,515
11
$282,916
2
$131,030
1
$243,830
0
$0
Aggregated Statistics For Year 2005 (Based on 1 partial tract)
B) Conventional Home Purchase Loans
C) Refinancings
D) Home Improvement Loans
F) Non-occupant Loans on < 5 Family Dwellings (A B C & D)
G) Loans On Manufactured Home Dwelling (A B C & D)
Number
Average Value
Number
Average Value
Number
Average Value
Number
Average Value
Number
Average Value
LOANS ORIGINATED
63
$286,349
73
$251,691
11
$119,556
14
$349,597
2
$41,145
APPLICATIONS APPROVED, NOT ACCEPTED
8
$276,526
13
$299,575
3
$189,730
3
$378,280
0
$0
APPLICATIONS DENIED
16
$254,149
33
$266,451
6
$118,498
2
$338,150
2
$39,625
APPLICATIONS WITHDRAWN
13
$280,117
24
$293,902
4
$207,688
3
$462,933
1
$22,790
FILES CLOSED FOR INCOMPLETENESS
5
$203,472
16
$264,641
1
$177,240
1
$220,030
0
$0
Aggregated Statistics For Year 2004 (Based on 1 partial tract)
A) FHA, FSA/RHS & VA Home Purchase Loans
B) Conventional Home Purchase Loans
C) Refinancings
D) Home Improvement Loans
F) Non-occupant Loans on < 5 Family Dwellings (A B C & D)
G) Loans On Manufactured Home Dwelling (A B C & D)
Number
Average Value
Number
Average Value
Number
Average Value
Number
Average Value
Number
Average Value
Number
Average Value
LOANS ORIGINATED
0
$0
42
$264,064
72
$202,423
16
$98,843
13
$264,360
1
$49,370
APPLICATIONS APPROVED, NOT ACCEPTED
0
$0
10
$325,083
18
$209,903
2
$92,165
4
$289,915
0
$0
APPLICATIONS DENIED
1
$240,540
9
$248,502
29
$201,311
6
$69,630
6
$275,903
1
$30,130
APPLICATIONS WITHDRAWN
1
$97,740
7
$304,130
21
$194,072
3
$75,537
1
$141,030
0
$0
FILES CLOSED FOR INCOMPLETENESS
0
$0
2
$166,985
14
$223,124
1
$109,380
0
$0
0
$0
Aggregated Statistics For Year 2003 (Based on 1 partial tract)
A) FHA, FSA/RHS & VA Home Purchase Loans
B) Conventional Home Purchase Loans
C) Refinancings
D) Home Improvement Loans
F) Non-occupant Loans on < 5 Family Dwellings (A B C & D)
Number
Average Value
Number
Average Value
Number
Average Value
Number
Average Value
Number
Average Value
LOANS ORIGINATED
1
$326,370
47
$221,361
134
$180,726
14
$53,877
16
$260,448
APPLICATIONS APPROVED, NOT ACCEPTED
0
$0
10
$232,640
22
$190,176
2
$52,790
2
$266,240
APPLICATIONS DENIED
0
$0
6
$227,542
41
$182,996
3
$51,820
4
$202,052
APPLICATIONS WITHDRAWN
0
$0
5
$211,828
23
$175,060
3
$49,207
0
$0
FILES CLOSED FOR INCOMPLETENESS
0
$0
2
$268,900
7
$165,629
0
$0
1
$190,150
Aggregated Statistics For Year 2002 (Based on 1 partial tract)
A) FHA, FSA/RHS & VA Home Purchase Loans
B) Conventional Home Purchase Loans
C) Refinancings
D) Home Improvement Loans
F) Non-occupant Loans on < 5 Family Dwellings (A B C & D)
Number
Average Value
Number
Average Value
Number
Average Value
Number
Average Value
Number
Average Value
LOANS ORIGINATED
2
$187,115
54
$192,713
85
$161,414
12
$49,880
13
$175,039
APPLICATIONS APPROVED, NOT ACCEPTED
1
$71,400
5
$200,990
12
$177,683
3
$38,150
2
$203,700
APPLICATIONS DENIED
1
$77,230
5
$173,088
28
$154,976
5
$51,146
2
$205,600
APPLICATIONS WITHDRAWN
0
$0
6
$207,623
17
$149,224
3
$64,567
1
$65,830
FILES CLOSED FOR INCOMPLETENESS
0
$0
3
$314,727
10
$181,696
1
$42,030
2
$190,155
Aggregated Statistics For Year 2001 (Based on 1 partial tract)
A) FHA, FSA/RHS & VA Home Purchase Loans
B) Conventional Home Purchase Loans
C) Refinancings
D) Home Improvement Loans
F) Non-occupant Loans on < 5 Family Dwellings (A B C & D)
Number
Average Value
Number
Average Value
Number
Average Value
Number
Average Value
Number
Average Value
LOANS ORIGINATED
4
$150,275
46
$166,848
56
$141,480
10
$39,778
9
$168,462
APPLICATIONS APPROVED, NOT ACCEPTED
0
$0
6
$171,078
11
$122,917
3
$55,113
1
$284,090
APPLICATIONS DENIED
1
$189,140
9
$178,056
24
$124,975
6
$46,462
3
$97,060
APPLICATIONS WITHDRAWN
0
$0
4
$176,922
18
$125,643
3
$38,910
1
$49,630
FILES CLOSED FOR INCOMPLETENESS
0
$0
1
$272,950
4
$98,242
1
$33,170
0
$0
Aggregated Statistics For Year 2000 (Based on 1 partial tract)
A) FHA, FSA/RHS & VA Home Purchase Loans
B) Conventional Home Purchase Loans
C) Refinancings
D) Home Improvement Loans
E) Loans on Dwellings For 5+ Families
F) Non-occupant Loans on < 5 Family Dwellings (A B C & D)
Number
Average Value
Number
Average Value
Number
Average Value
Number
Average Value
Number
Average Value
Number
Average Value
LOANS ORIGINATED
3
$129,807
37
$149,771
15
$110,665
9
$29,793
1
$95,200
4
$176,418
APPLICATIONS APPROVED, NOT ACCEPTED
0
$0
6
$105,585
5
$89,178
3
$38,570
0
$0
2
$92,040
APPLICATIONS DENIED
0
$0
12
$160,128
15
$109,669
8
$27,124
0
$0
3
$114,870
APPLICATIONS WITHDRAWN
1
$233,200
7
$158,756
12
$86,193
1
$20,760
0
$0
1
$251,930
FILES CLOSED FOR INCOMPLETENESS
0
$0
2
$190,915
2
$133,185
0
$0
0
$0
0
$0
Aggregated Statistics For Year 1999 (Based on 1 partial tract)
A) FHA, FSA/RHS & VA Home Purchase Loans
B) Conventional Home Purchase Loans
C) Refinancings
D) Home Improvement Loans
F) Non-occupant Loans on < 5 Family Dwellings (A B C & D)
Detailed PMIC statistics for the following Tracts:1699.00
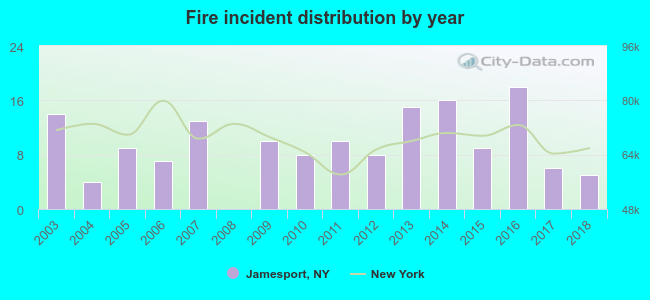
2003 - 2018 National Fire Incident Reporting System (NFIRS) incidents
According to the data from the years 2003 - 2018 the average number of fires per year is 10. The highest number of fire incidents - 18 took place in 2016, and the least - 0 in 2008. The data has a dropping trend.
When looking into fire subcategories, the most reports belonged to: Structure Fires (46.7%), and Outside Fires (38.8%).
Fire incident types reported to NFIRS in Jamesport, NY


 Recent articles from our blog. Our writers, many of them Ph.D. graduates or candidates, create easy-to-read articles on a wide variety of topics.

 (30.4 miles


 According to the data from the years 2003 - 2018 the average number of fires per year is 10. The highest number of fire incidents - 18 took place in 2016, and the least - 0 in 2008. The data has a dropping trend.
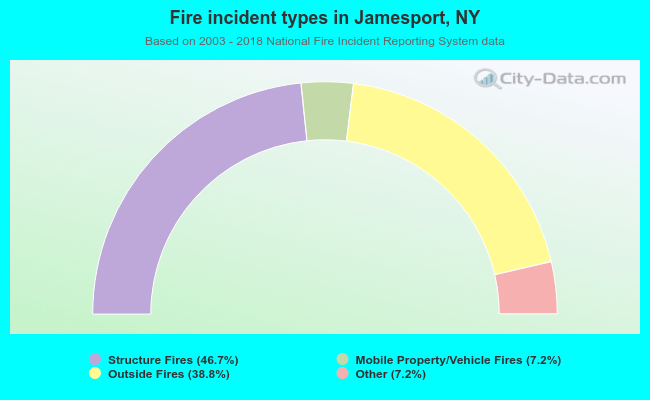 When looking into fire subcategories, the most reports belonged to: Structure Fires (46.7%), and Outside Fires (38.8%).